AIR QUALITY MATTERS


This website currently provides information about air quality (primarily nitrogen dioxide NO2 pollution) in several parts of London - as listed below.  Clicking the names on that list gives access to the data.  The data focuses on particular locations or (government) wards.

Borough of Brent

Borough of Camden

Royal Borough of Greenwich

Borough of Hackney

Borough of Hammersmith and Fulham

Borough of Haringey

Borough of Hillingdon

Borough of Hounslow

Borough of Islington

Borough of Lambeth

Borough of Lewisham

Borough of Newham

Borough of Southwark

Borough of Tower Hamlets

Royal Borough of Kensington and Chelsea

City of Westminster

Breathe London

Silvertown Tunnel

York


Click map for monthly NO2 data from the reference monitors shown since 01 2021


Click map for monthly PM2.5 data from the reference monitors shown since 01 2021


Click here for Breathe London charts illustrating NO2 and PM2.5 adjacent hospitals


HS2 charts for Brent, Camden, Kensington & Chelsea, and Westminster

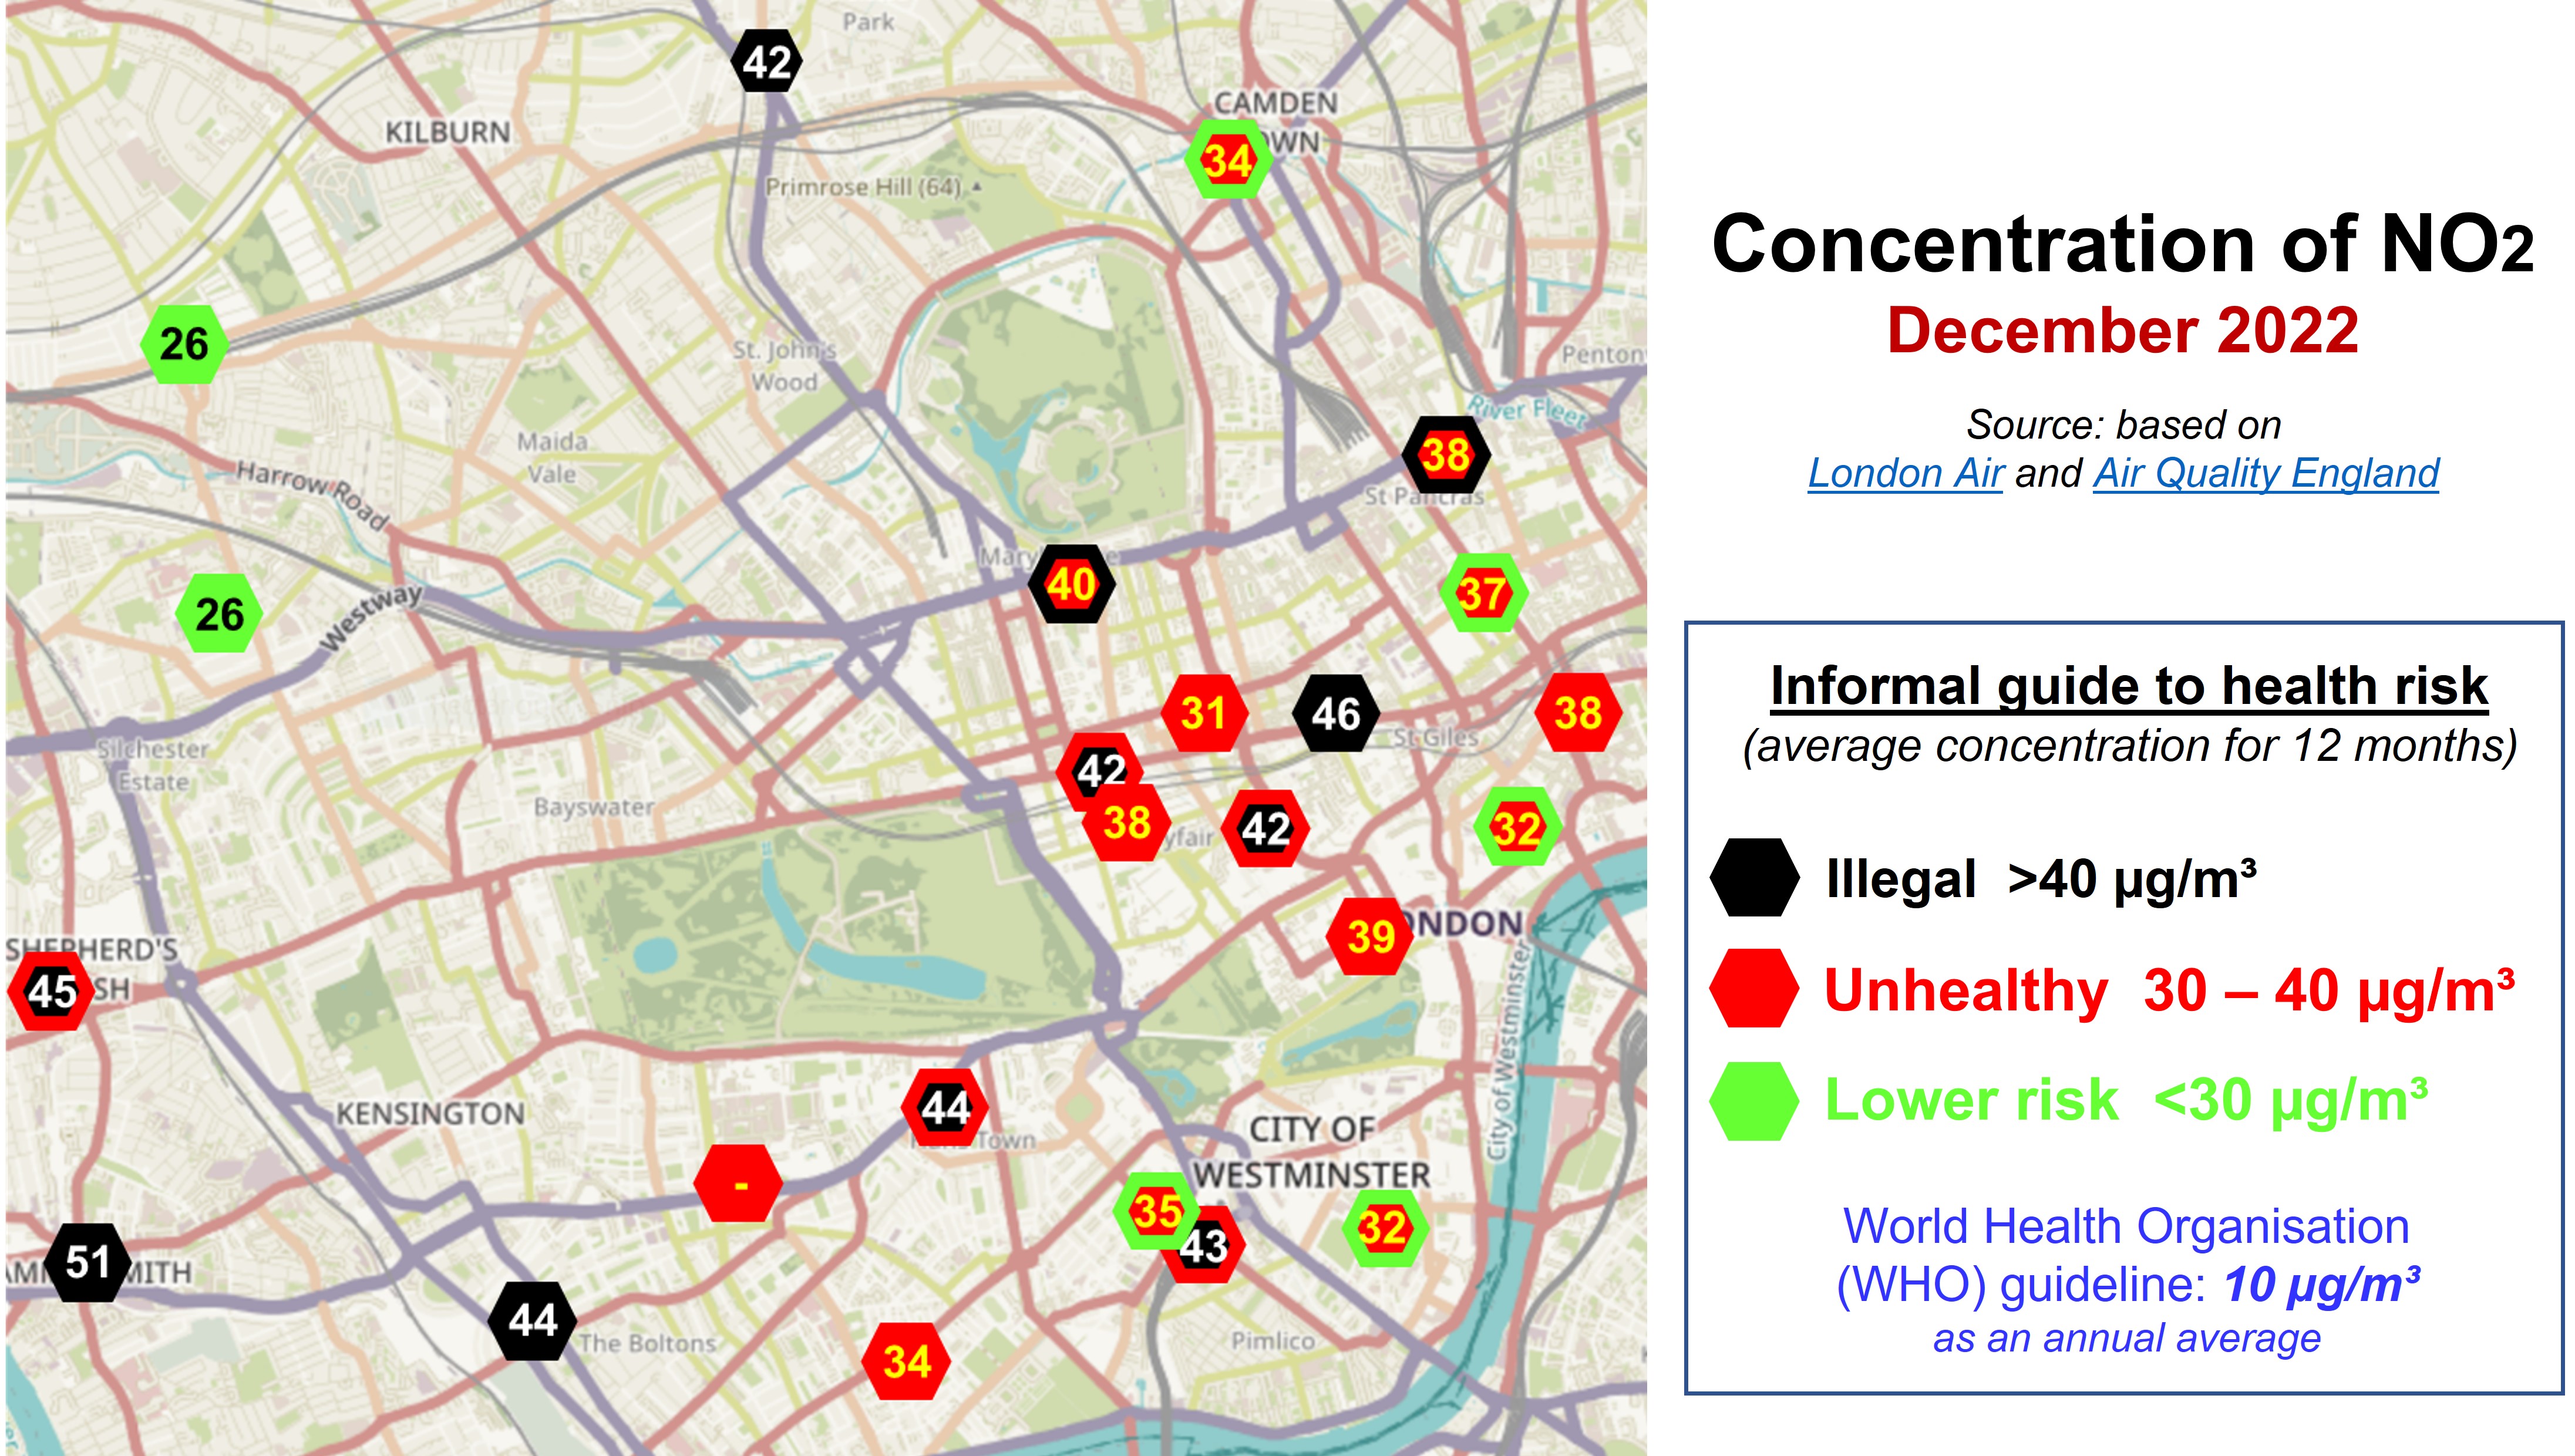
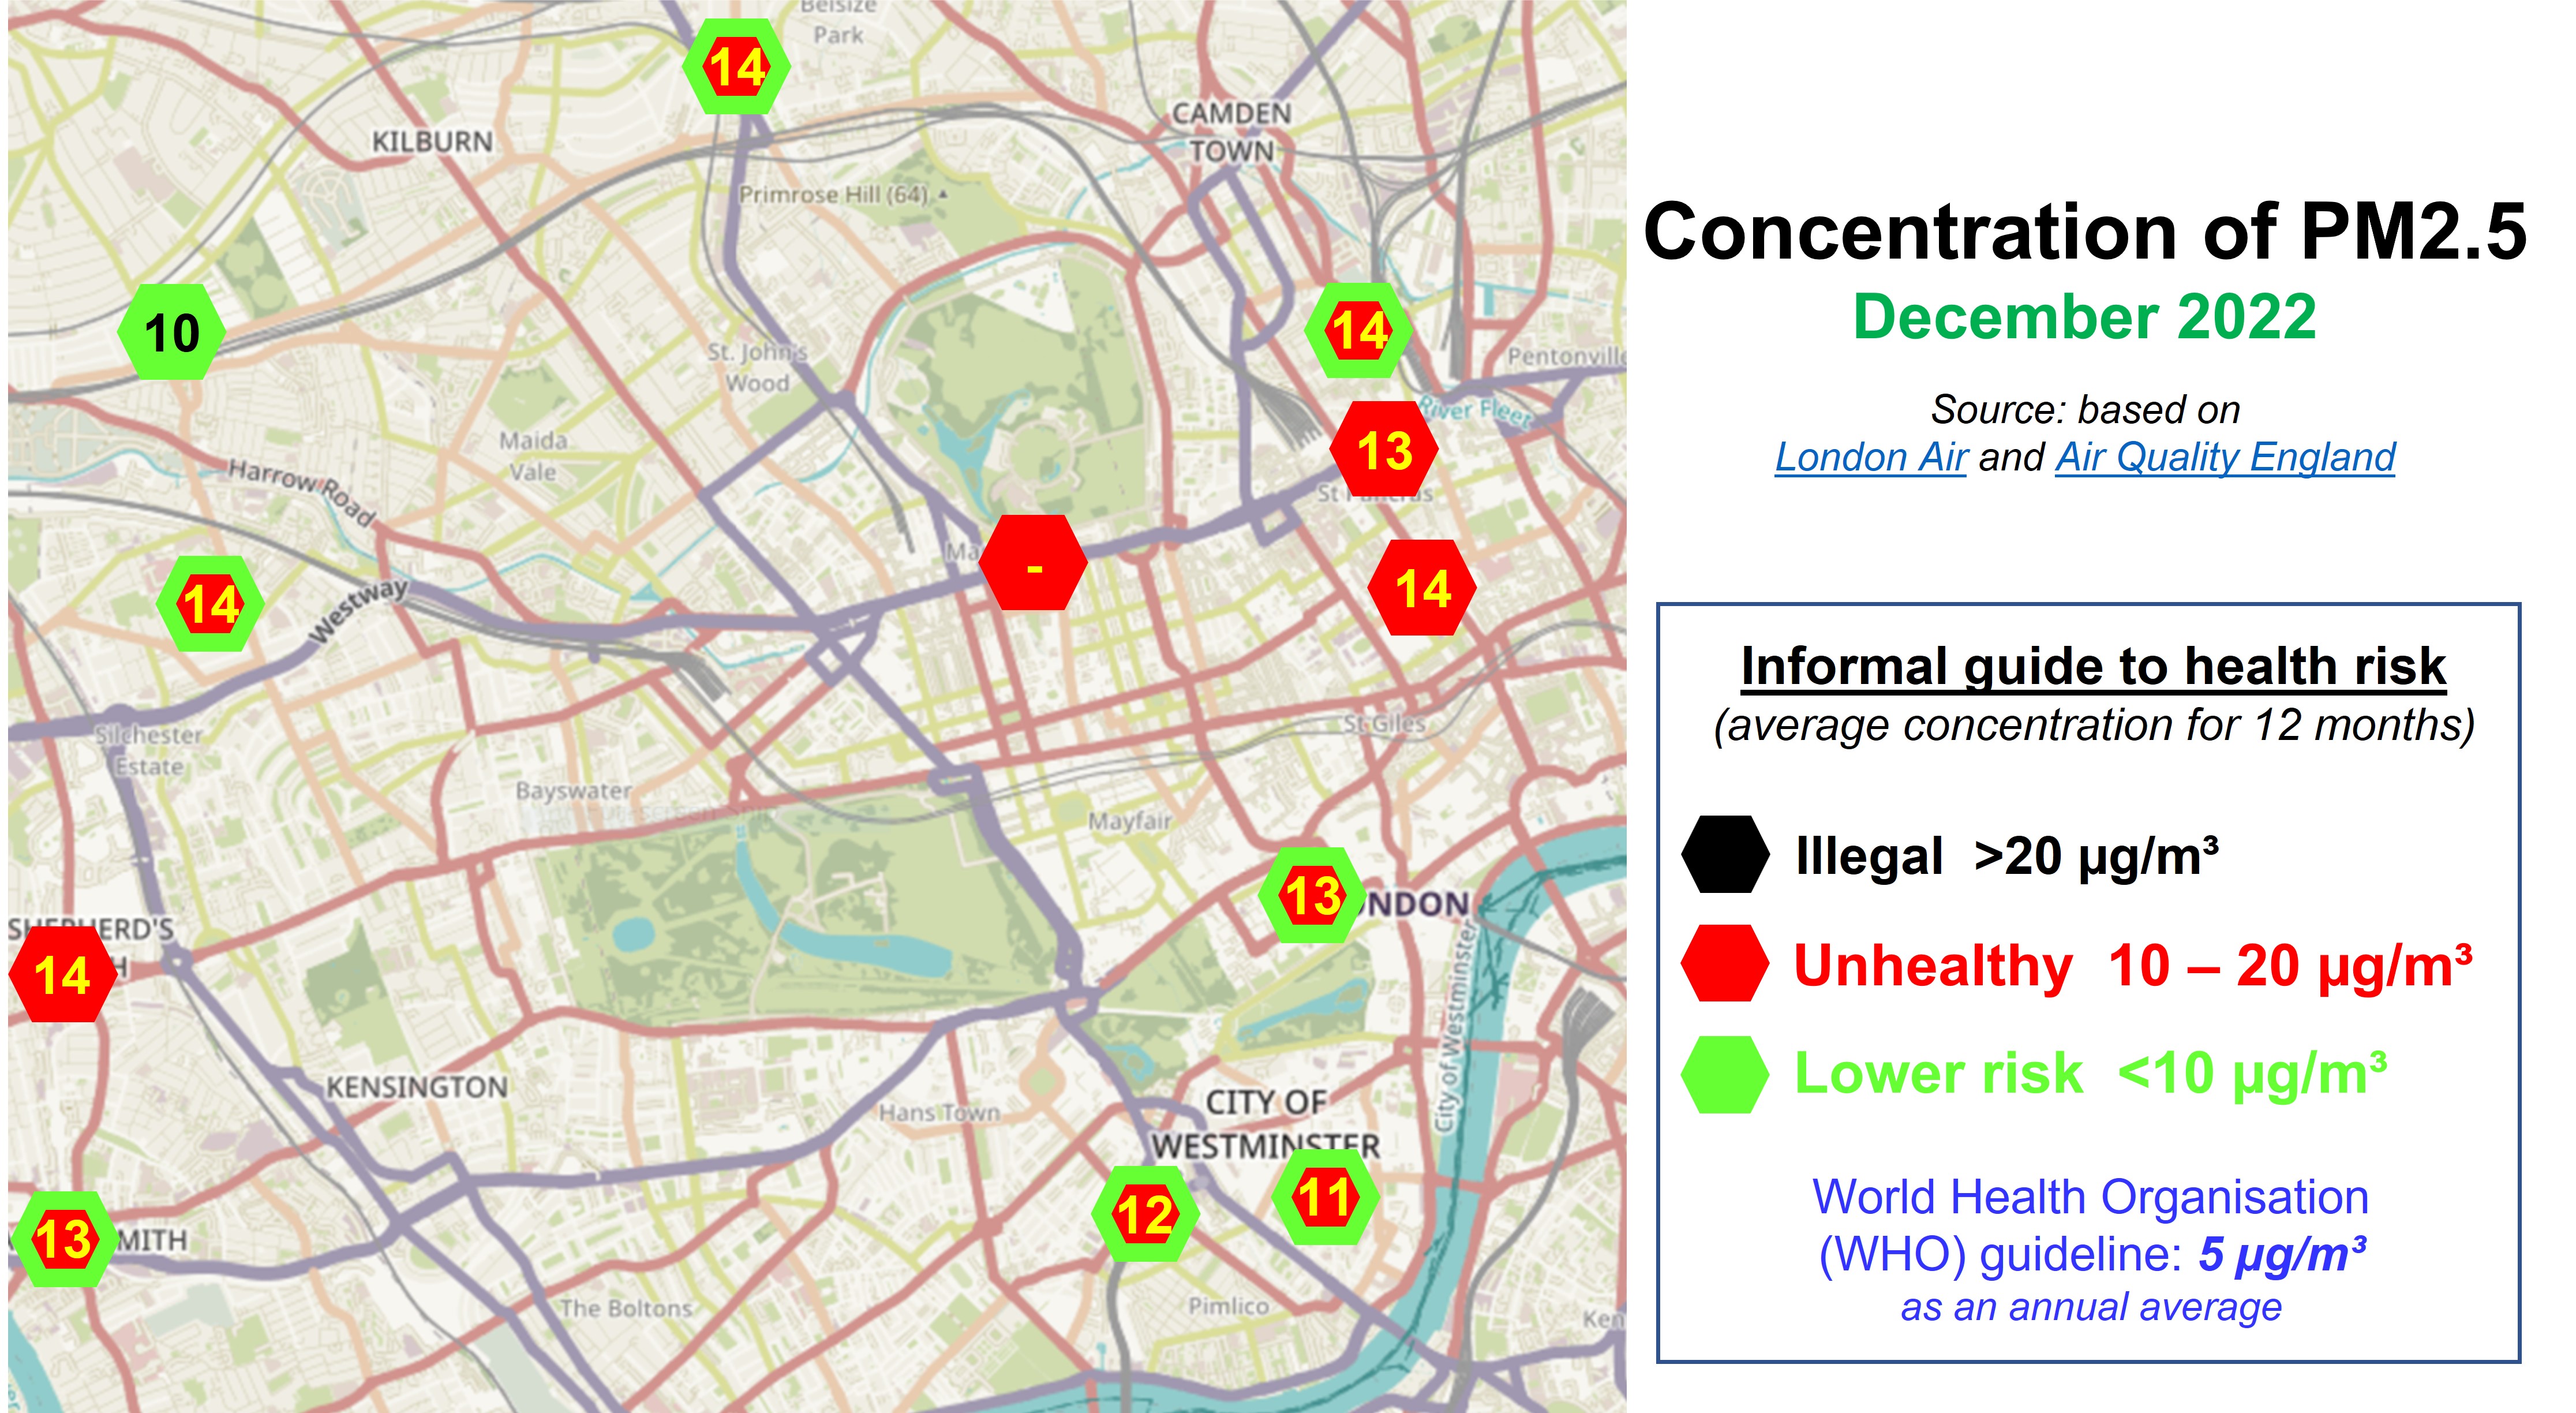
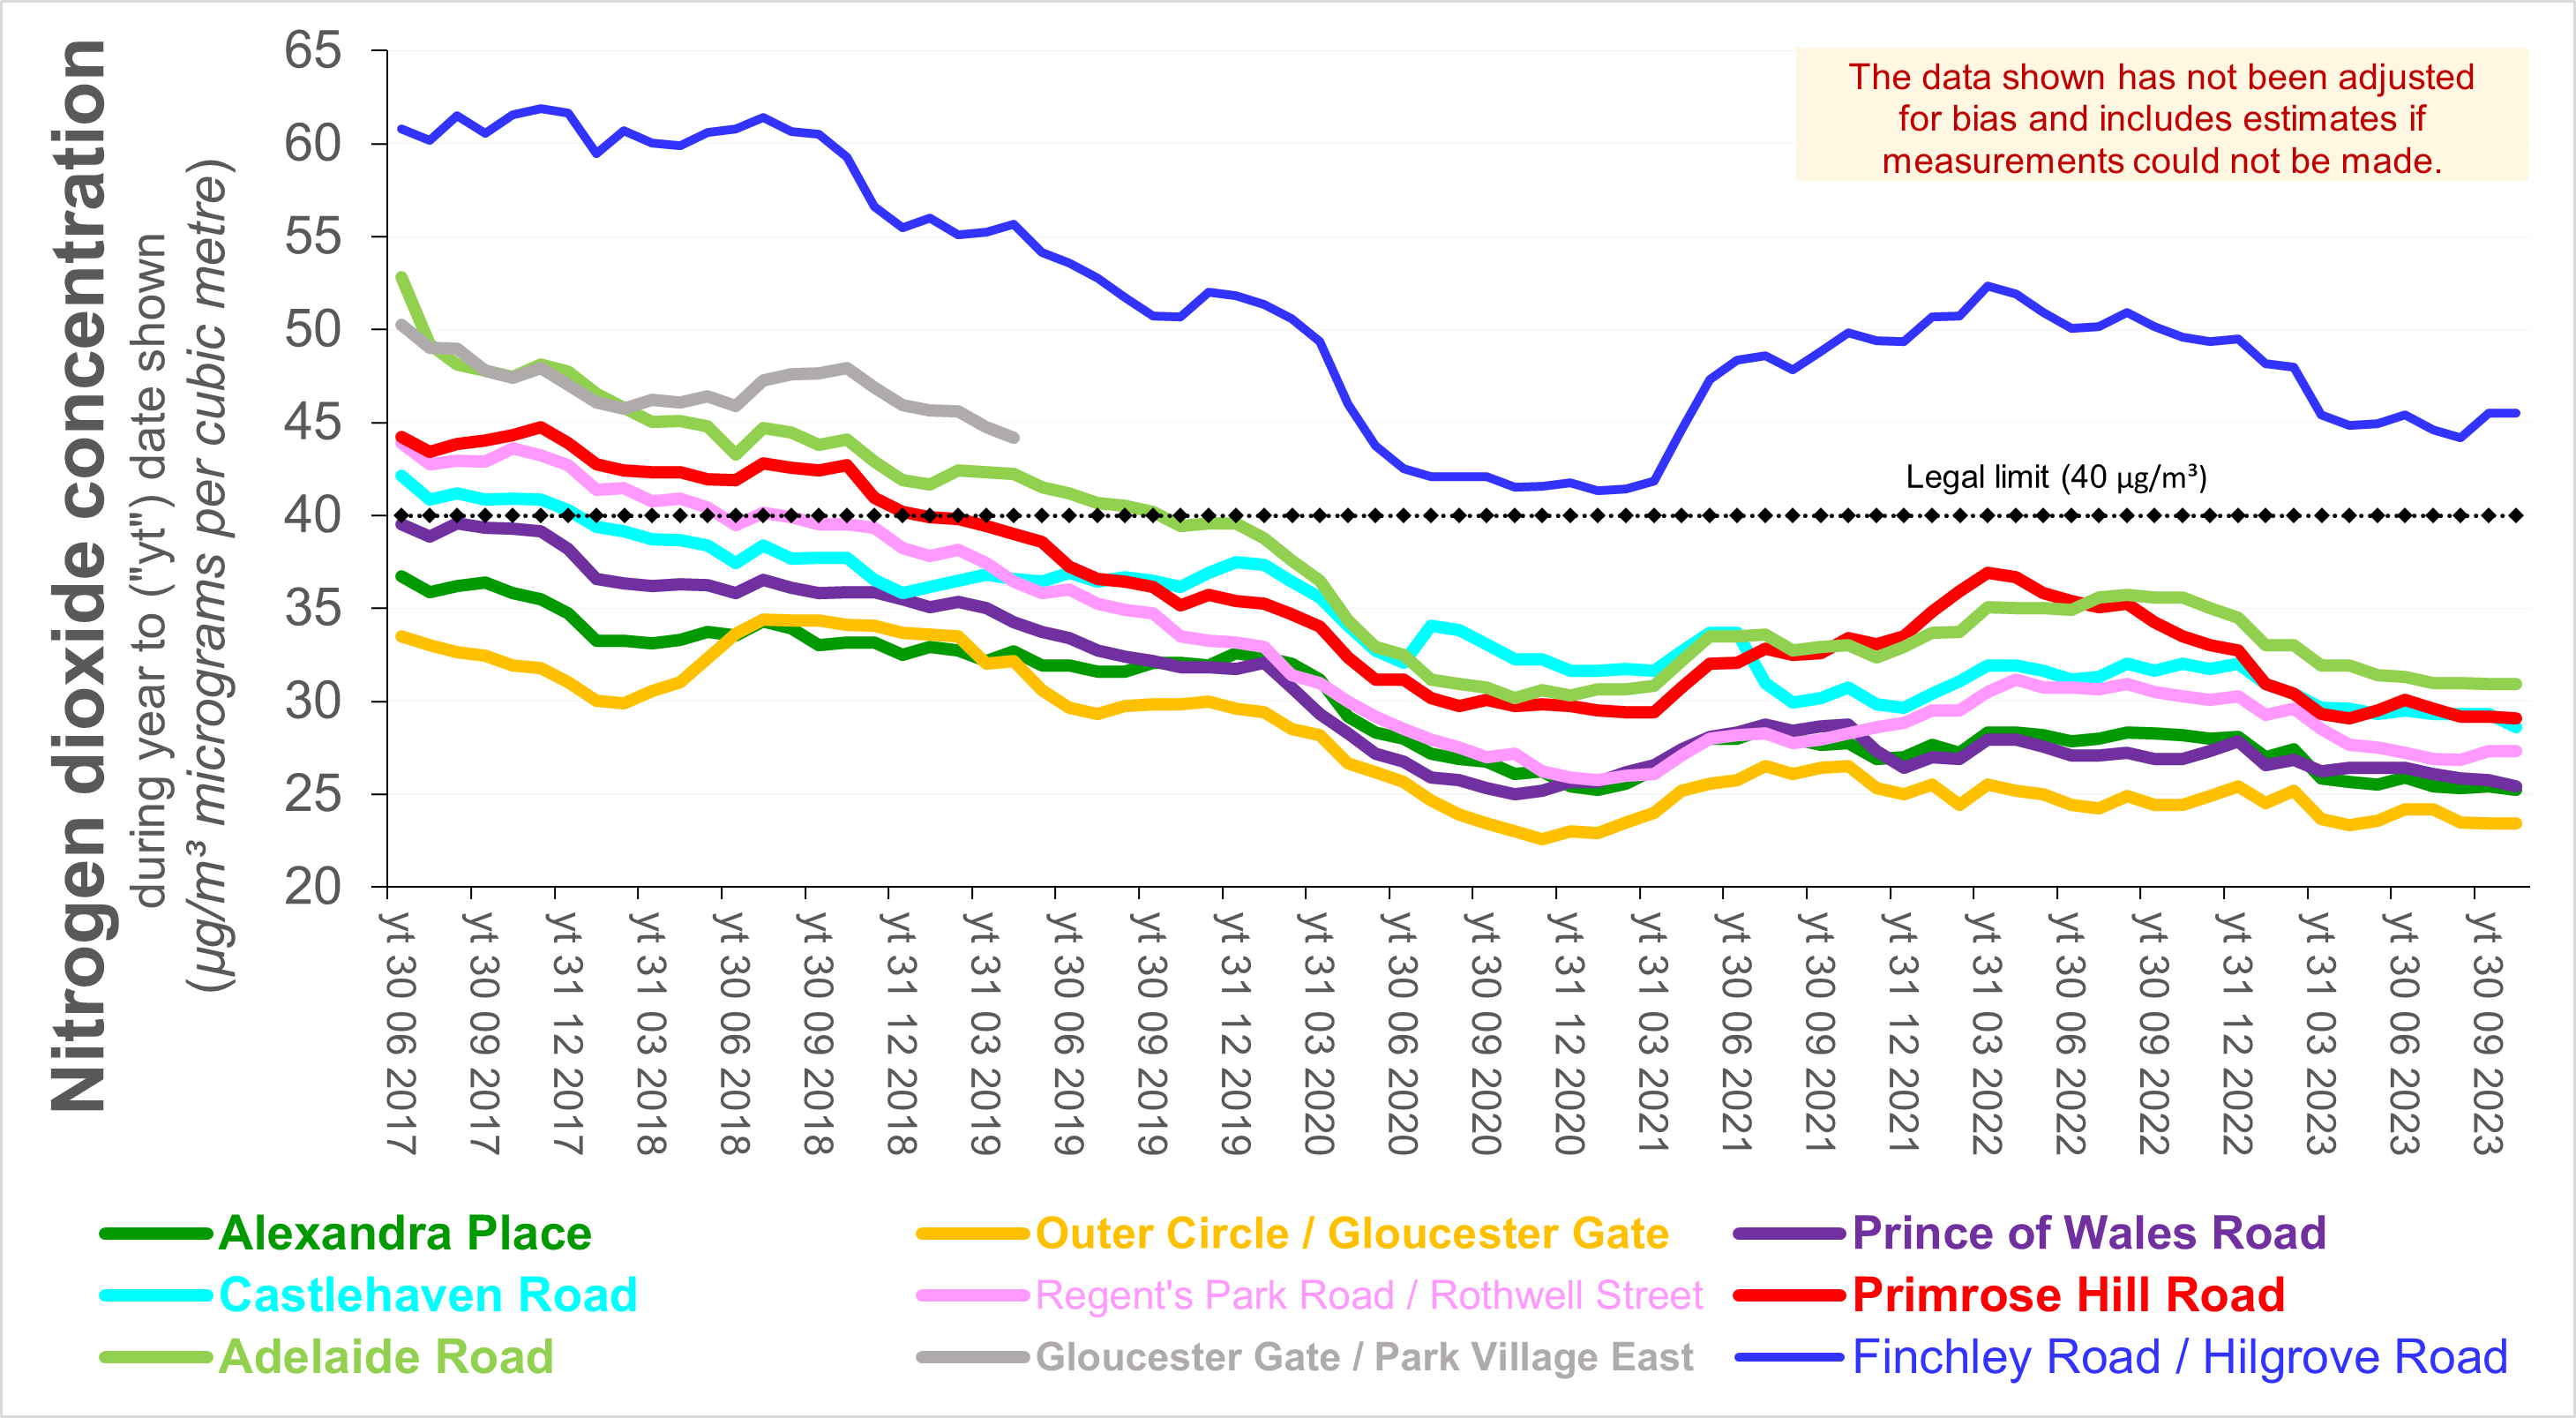
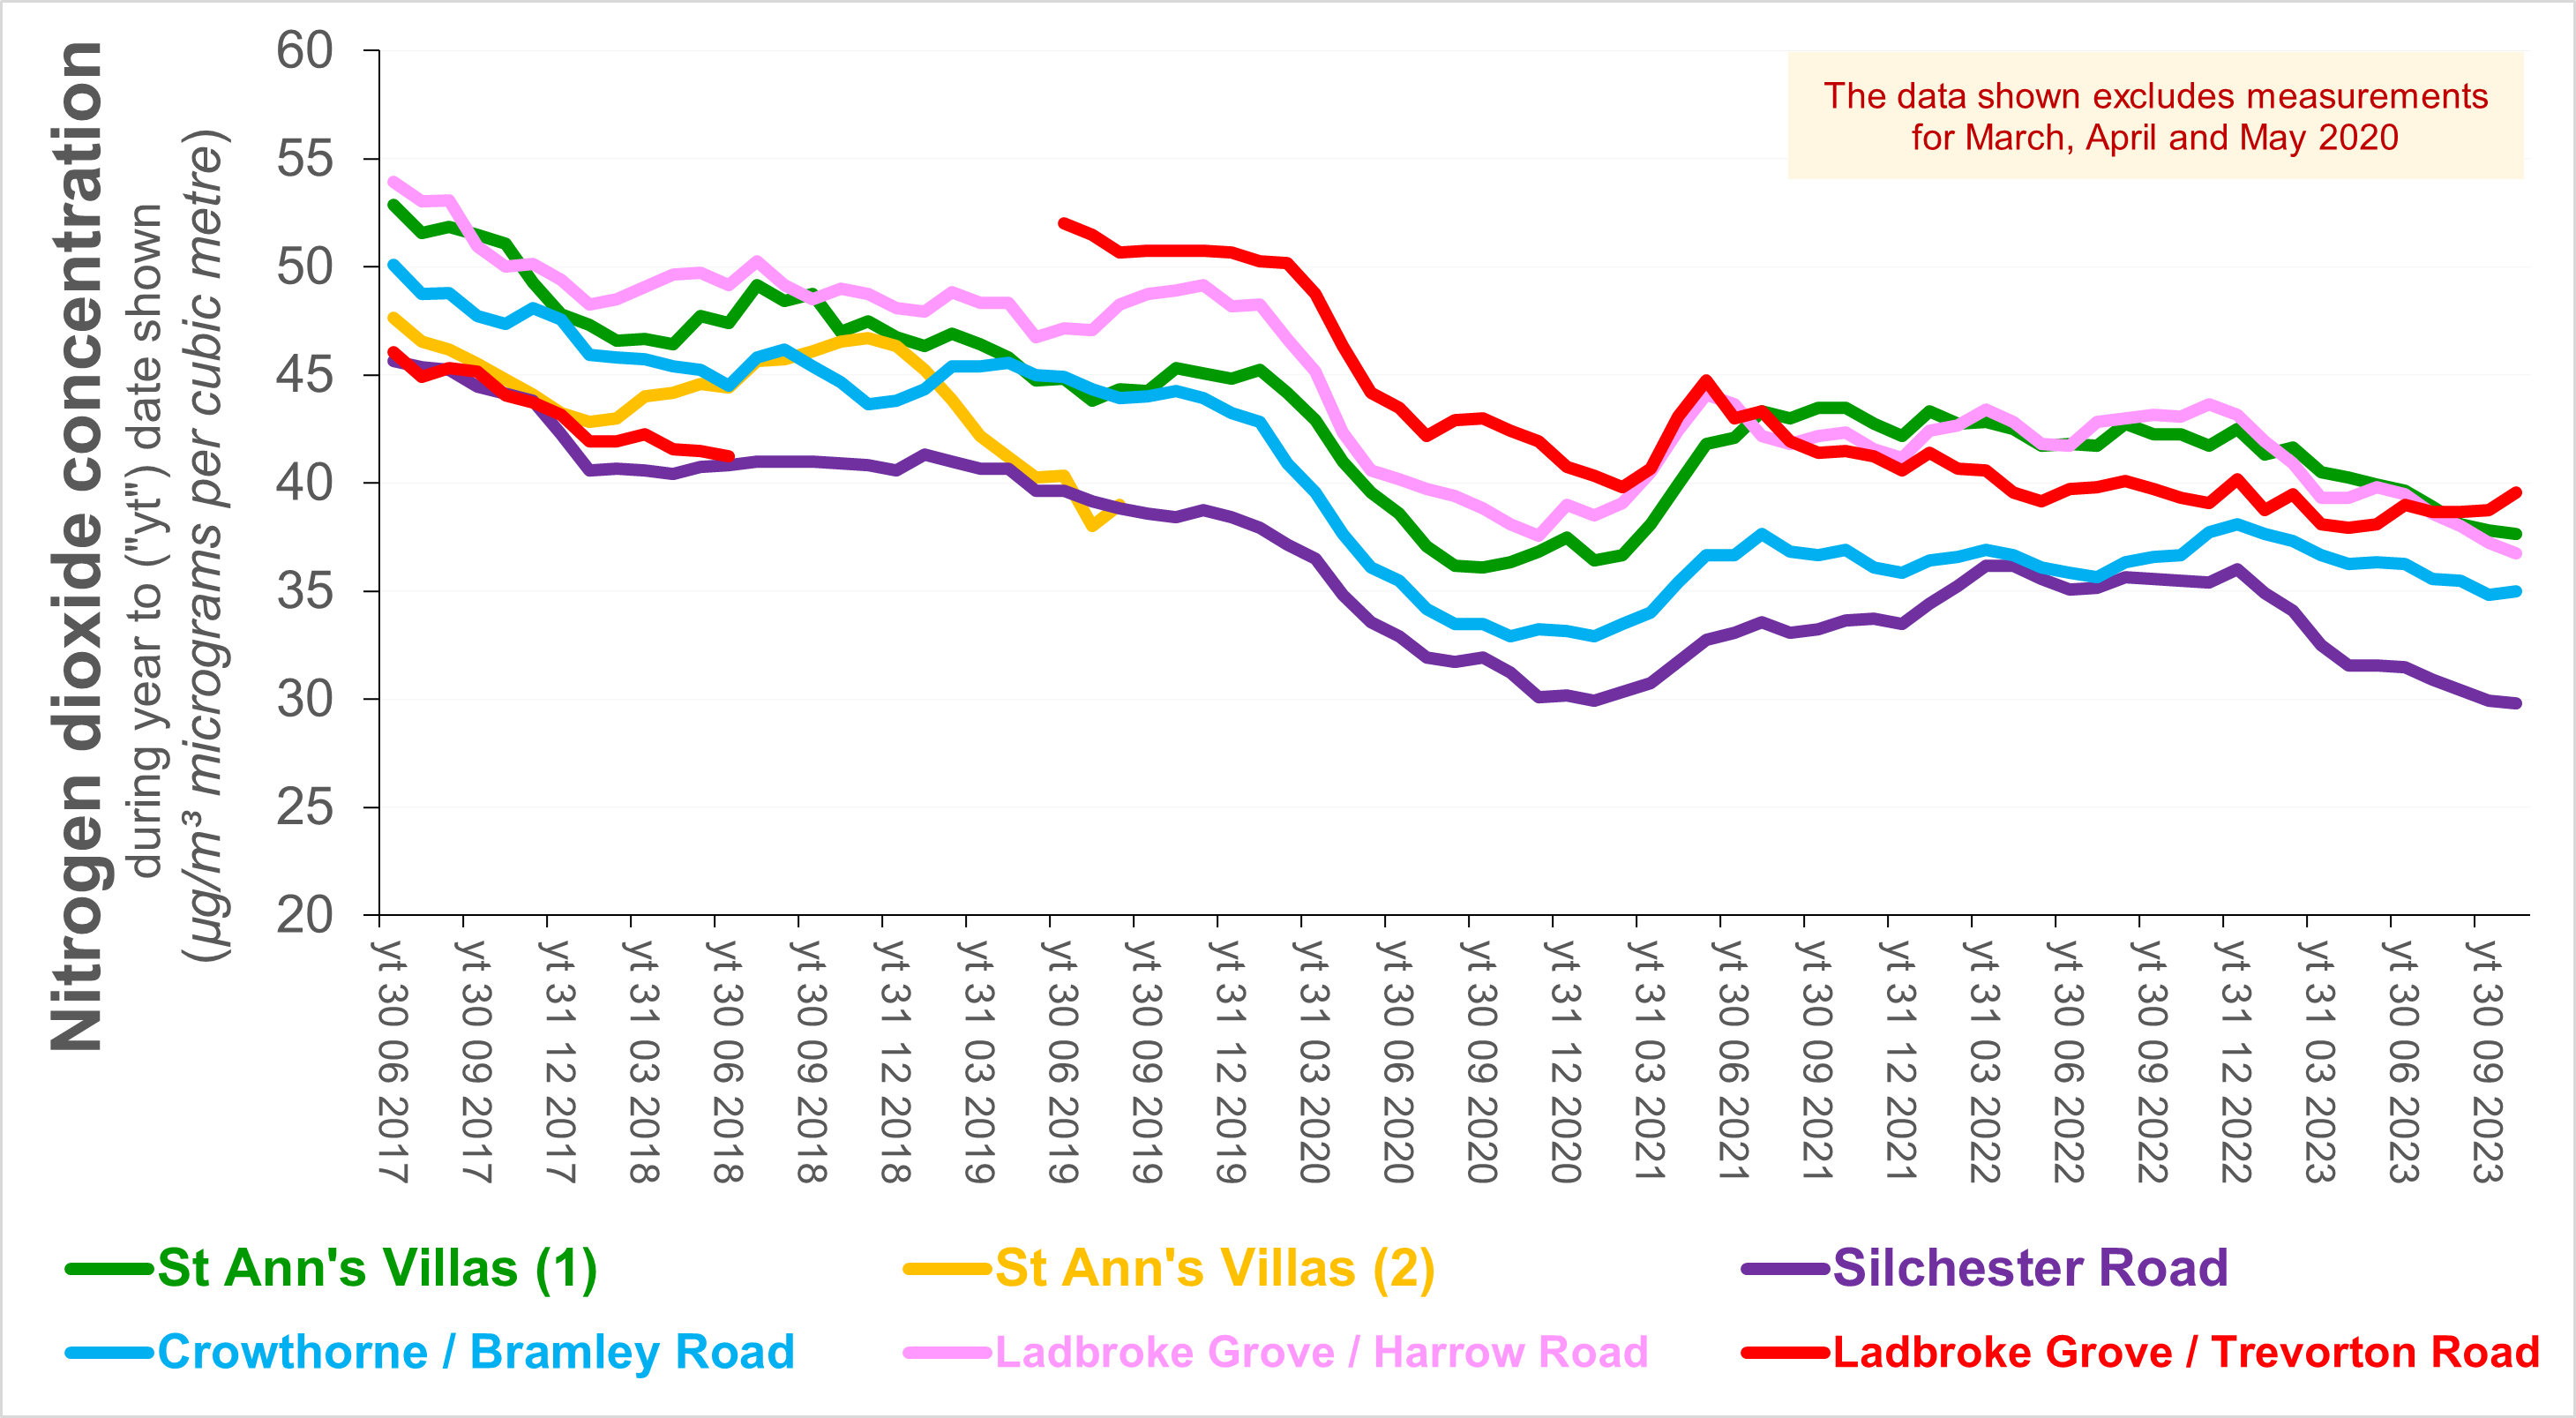
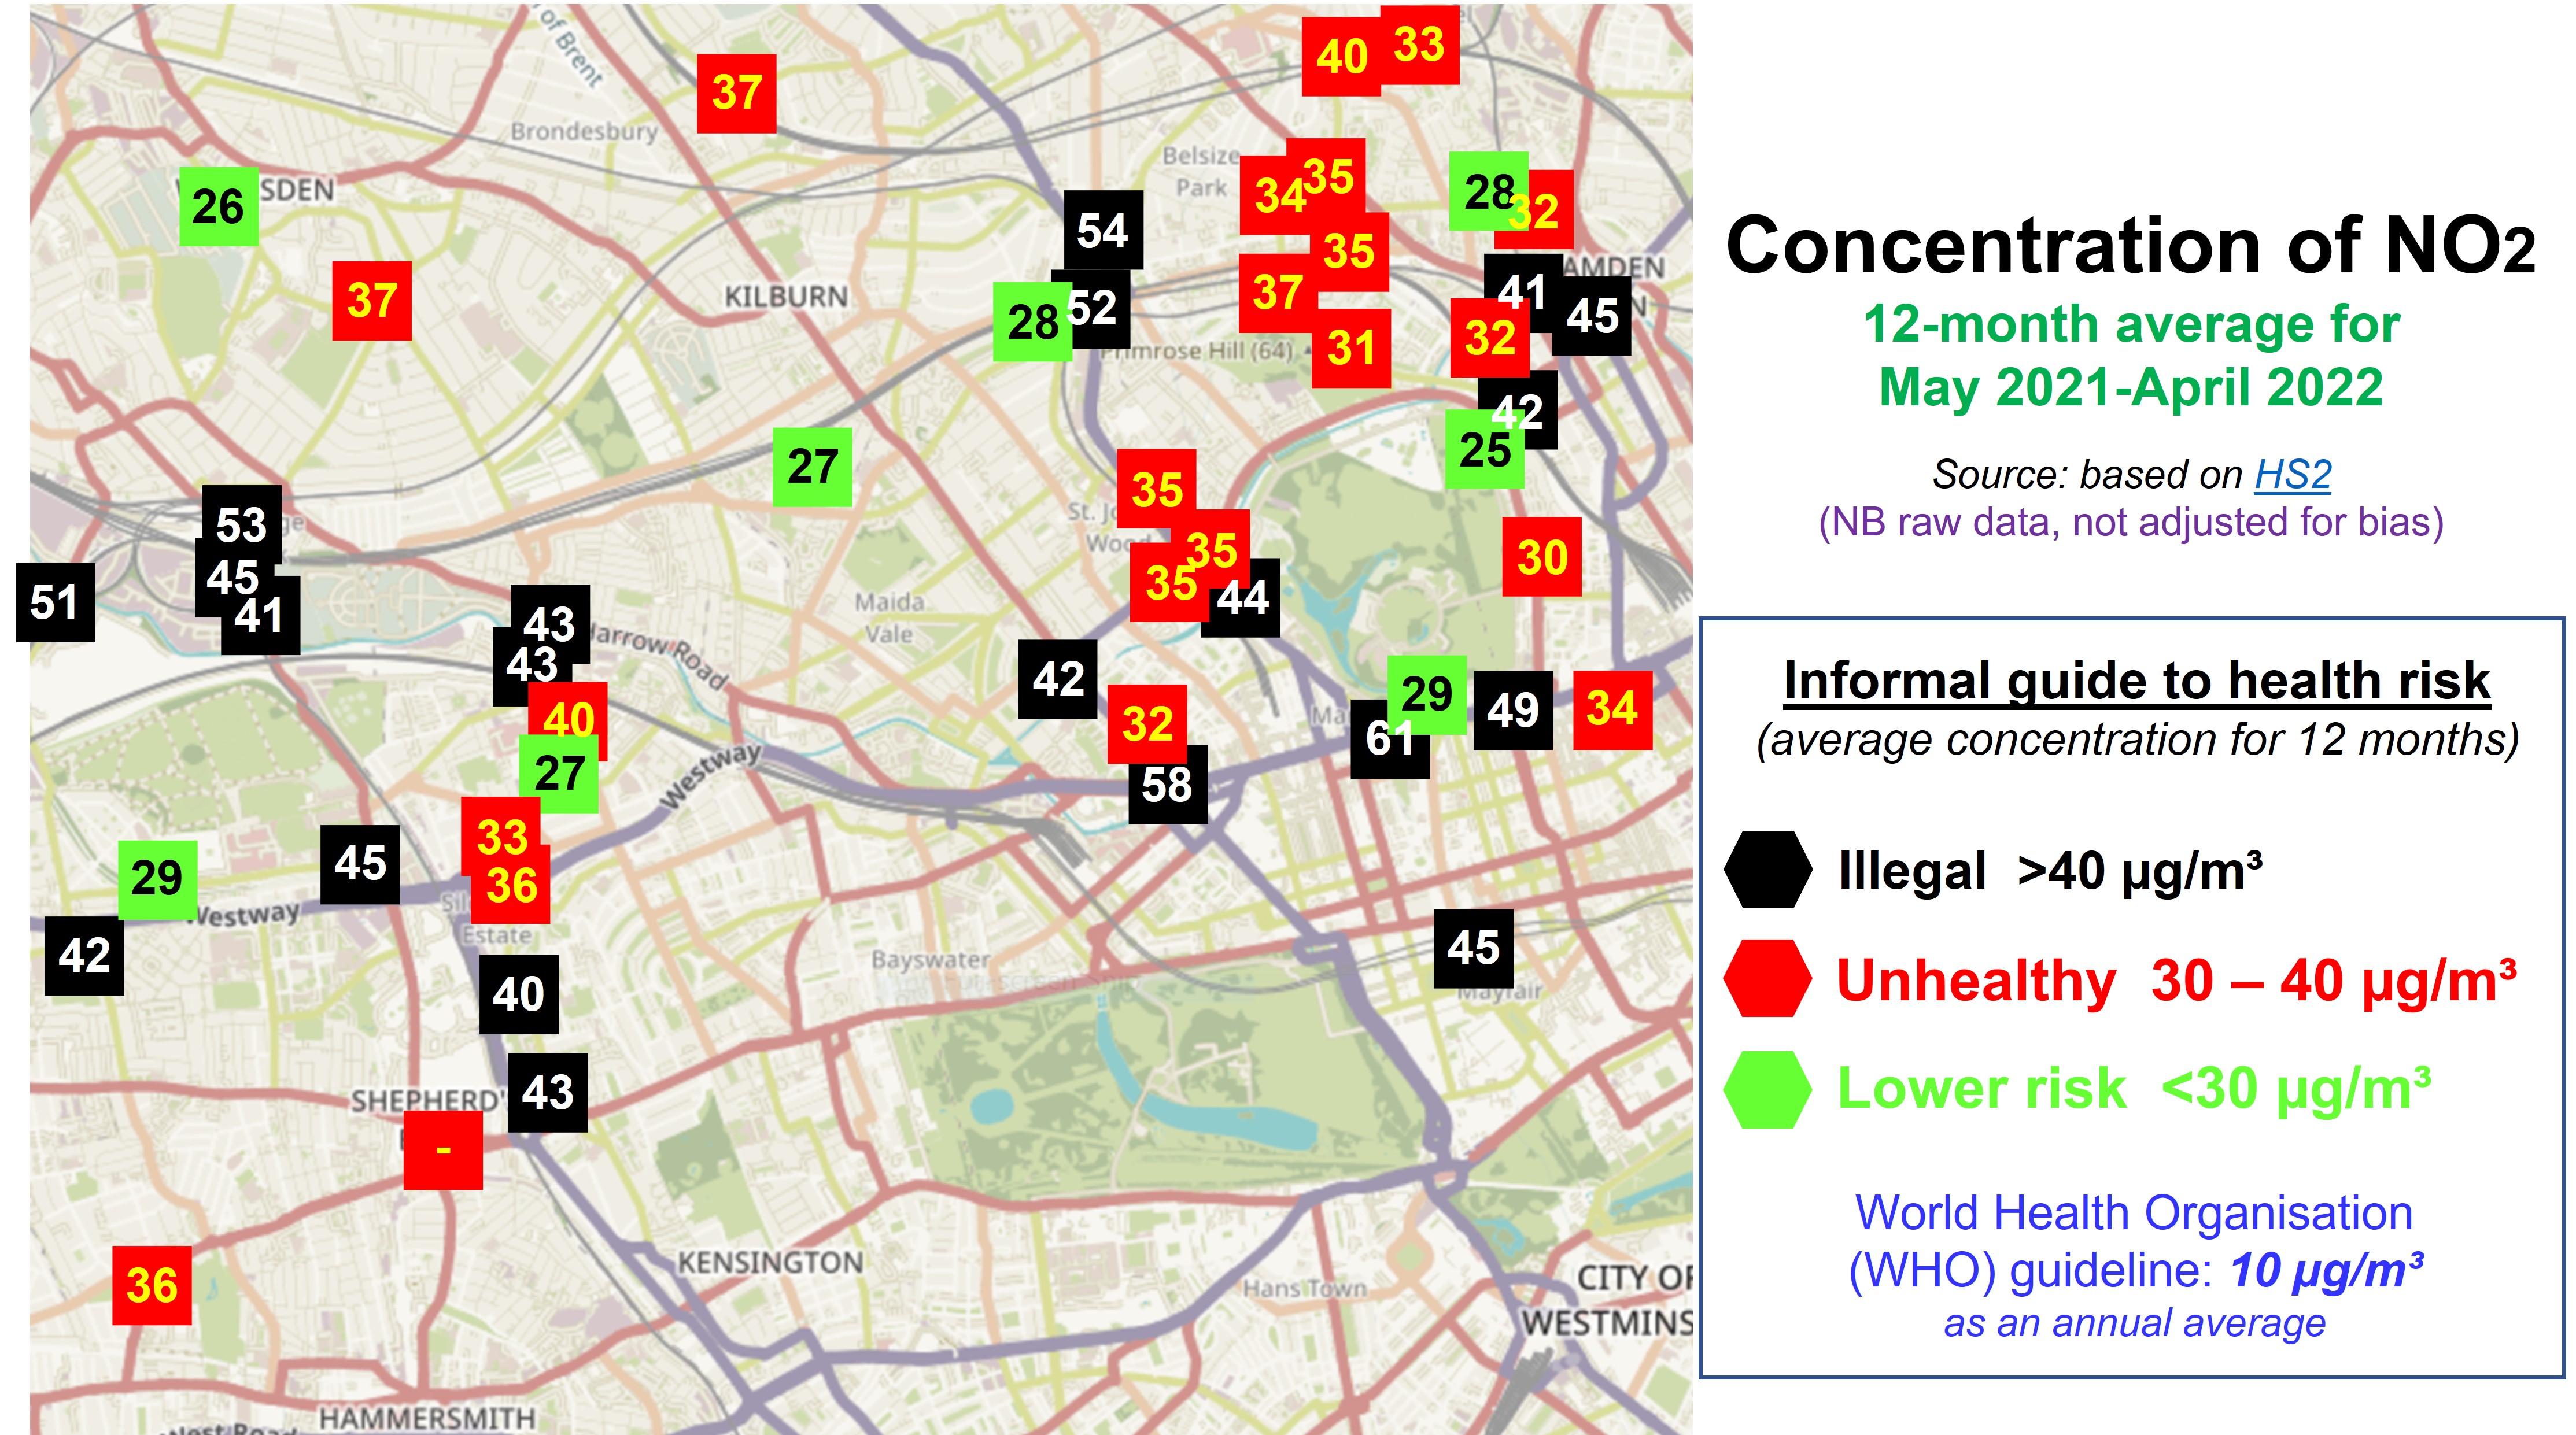
Click here for 12-month averages at locations in those local authority areas


Click here for information about the health impact of this air pollution


Click here
for charts which indicate 
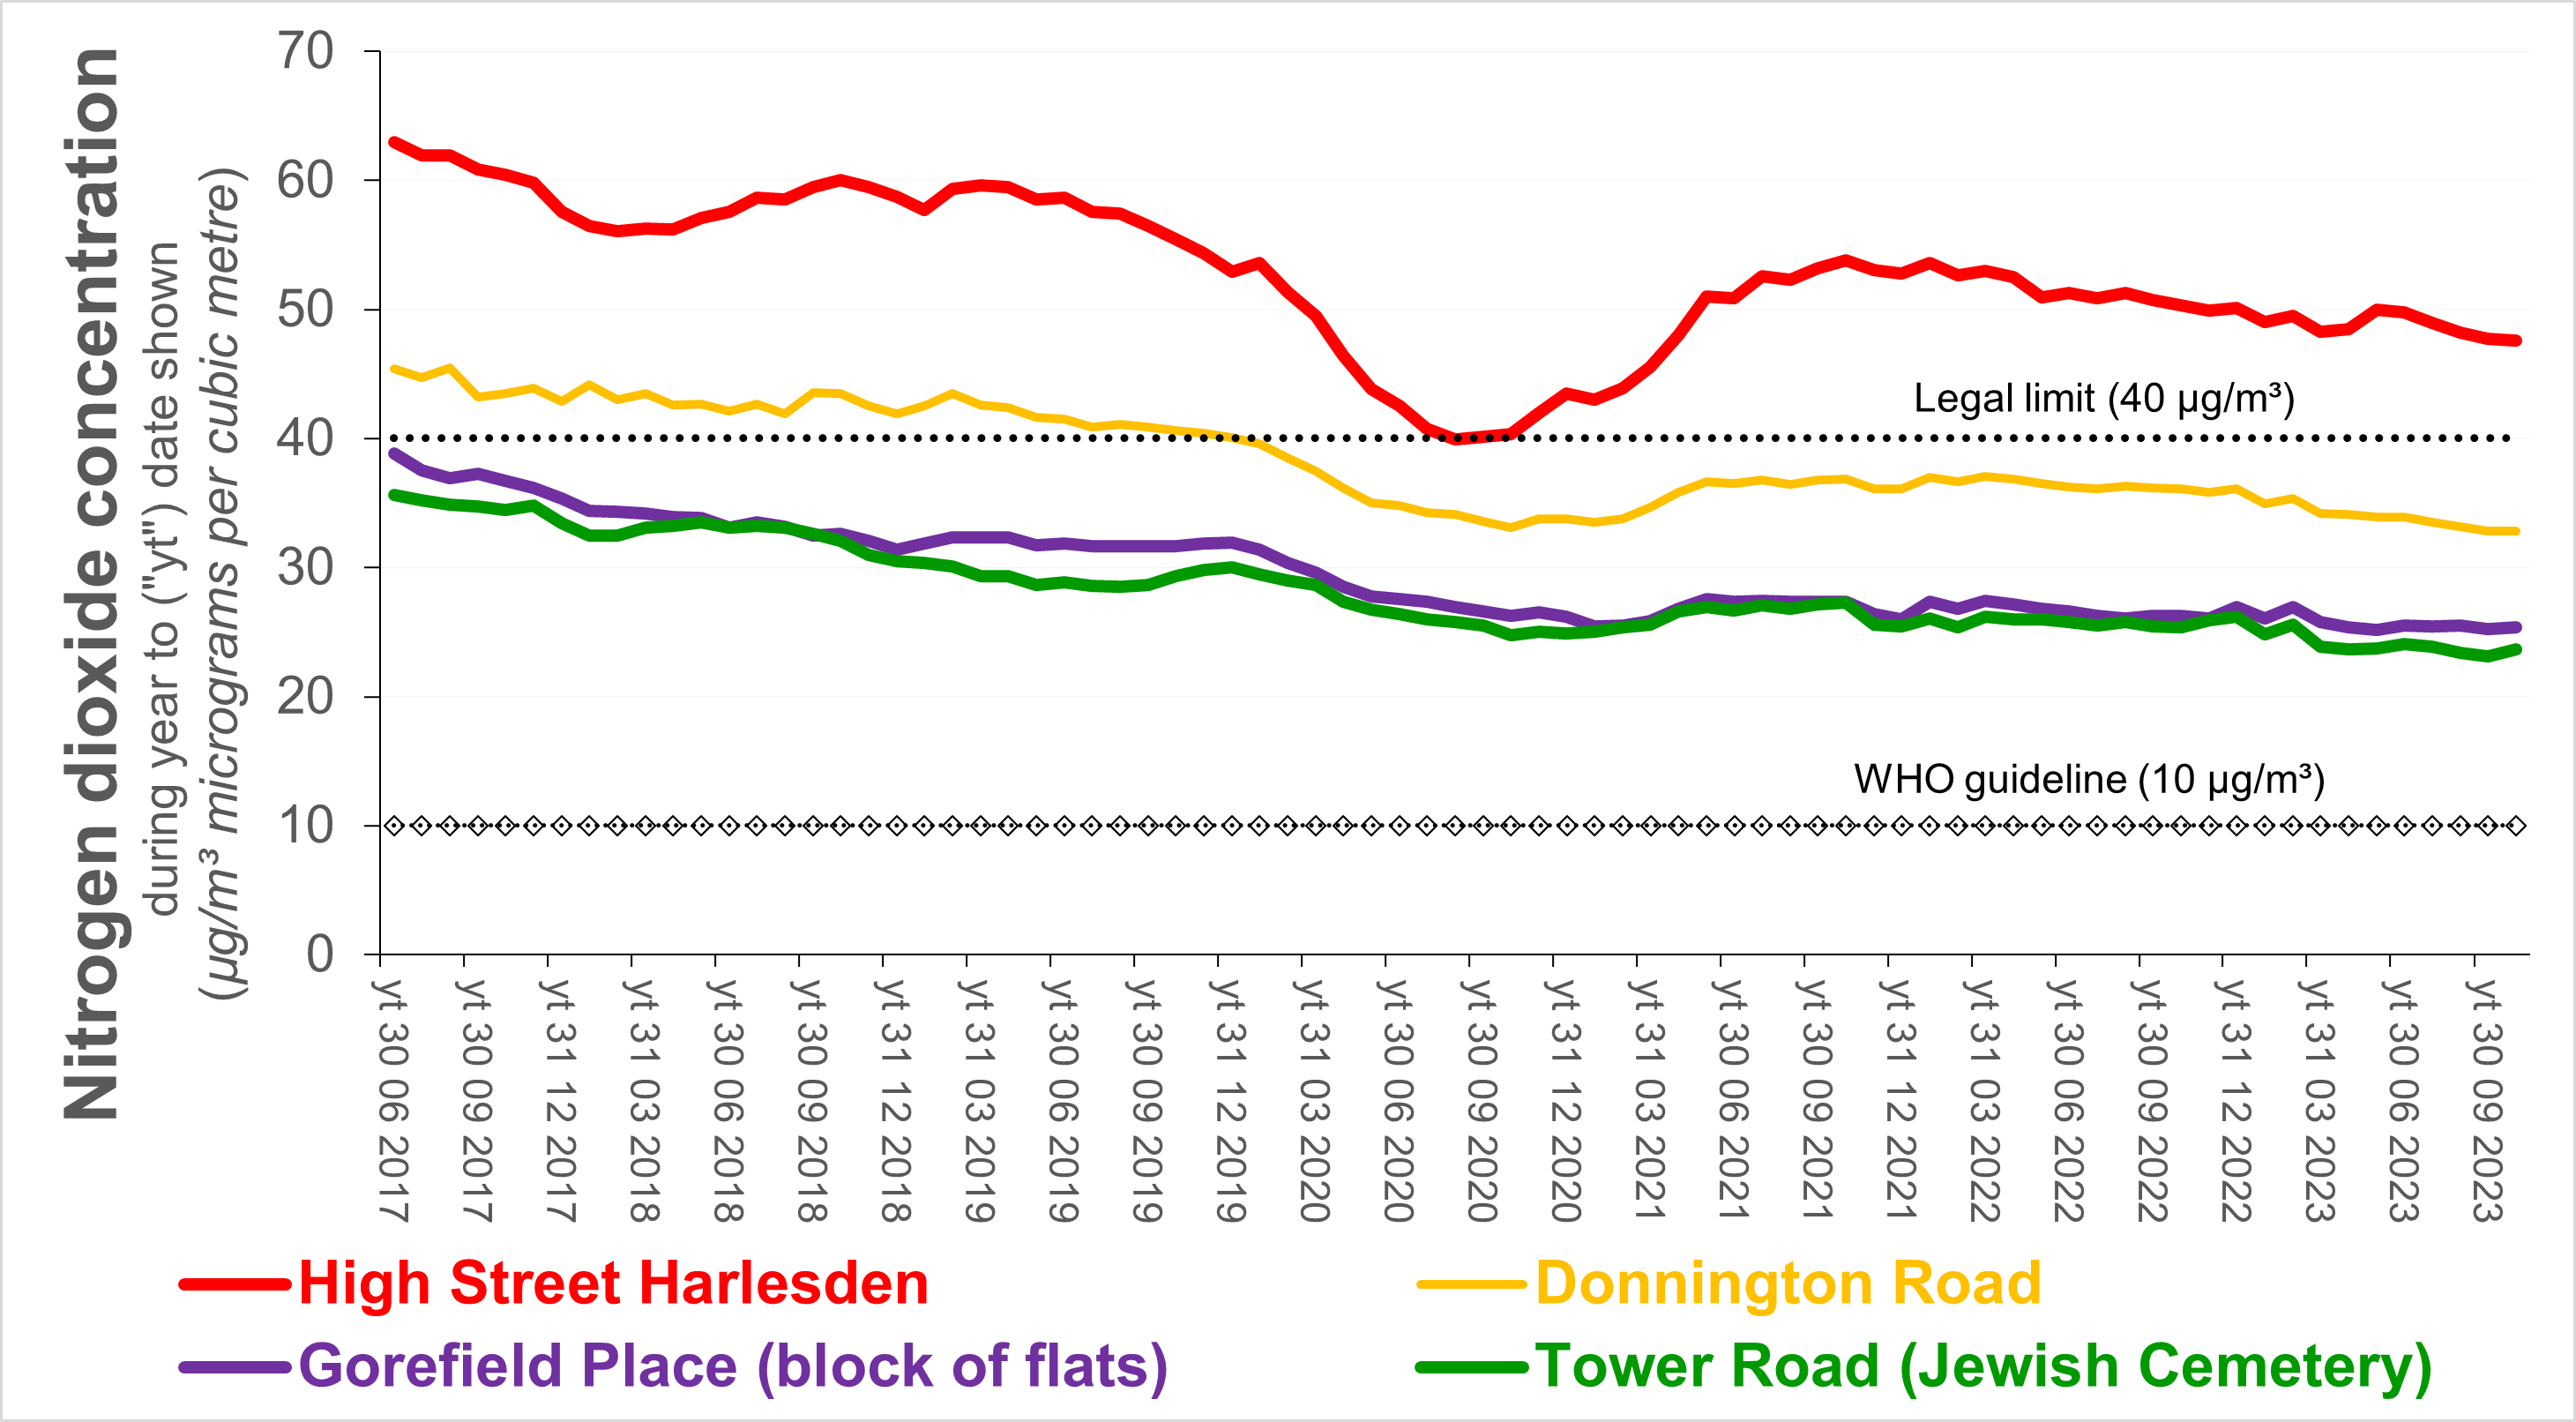
the impact in London of the lock-down announced by the UK Prime Minister on 18/03/2020 to ease the burden of coronavirus covid-19 on the NHS.  Note: the decline in NO2 concentration between 2019 and 2020 is attributable primarily to introduction of the first phase of the ULEZ [-] [-]; 
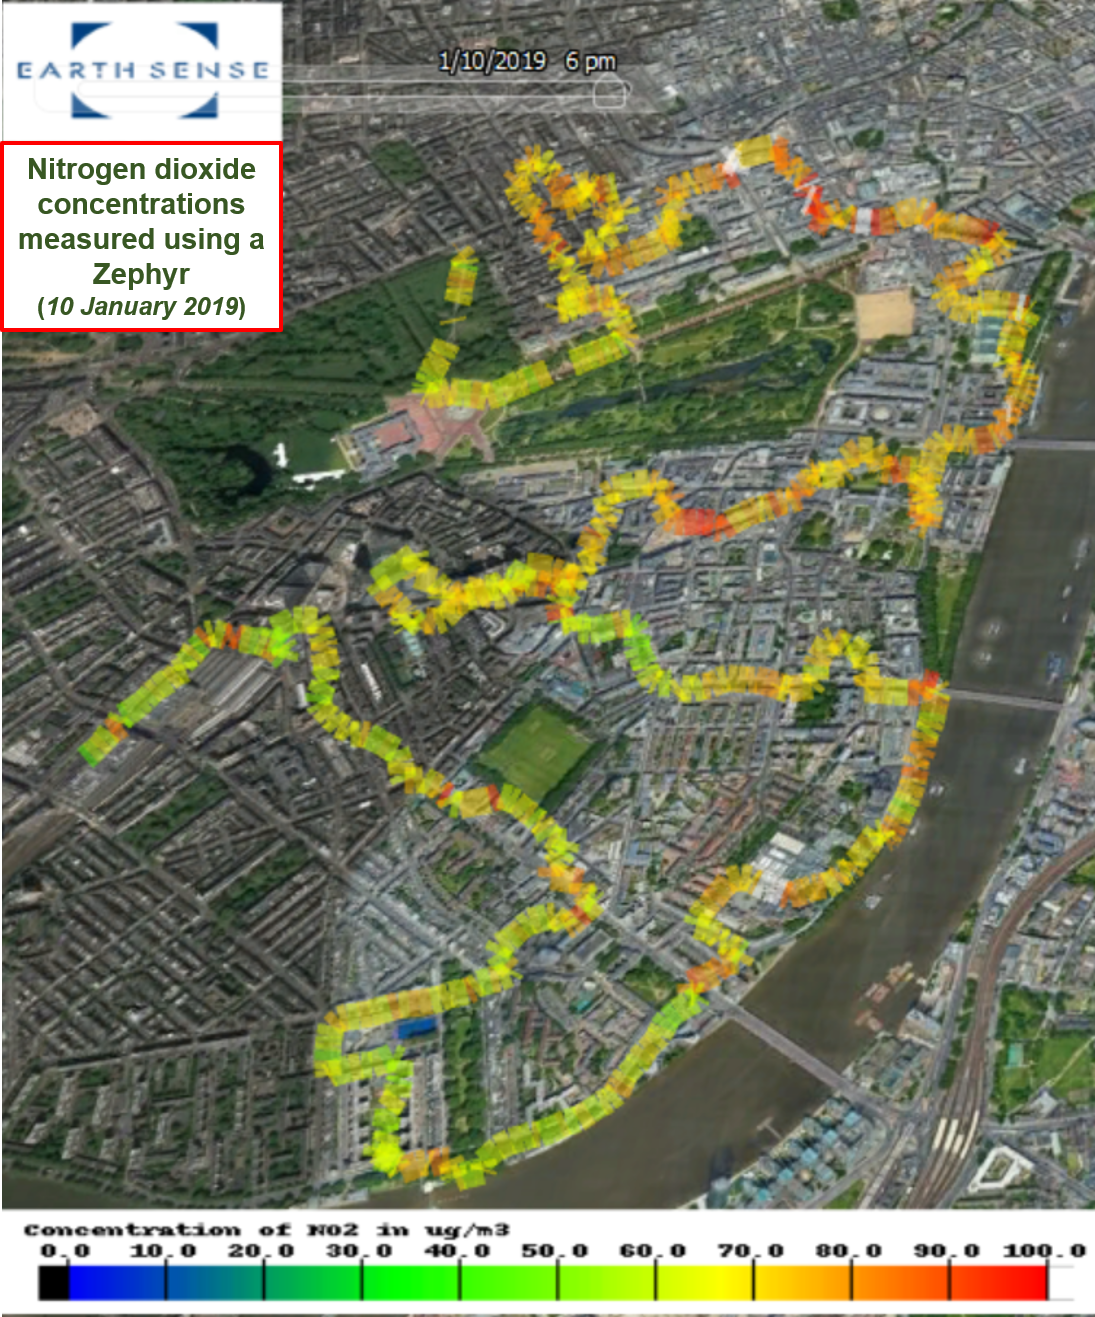
and measurements by satellite of NO2 in the atmosphere may differ from those made for public health and legal purposes at roughly three metres above ground level. The impact on particulate matter (PM10 andPM2.5) is unclear, while concentrations of ground level ozone (O3, linked to NO2) have increased.[-][-Click the following names for charts comparing air quality in London shortly before and since the covid-19 lockdown -
Oxford Street (Selfridges) and Horseferry Road
Covent Garden and Strand
Russell Square and Swiss Cottage.

NO2 pollution in some of the most prestigious parts of London greatly exceeds the legal limit - which should have been achieved by 2010.  The ULEZ is unlikely to sufficiently lower nitrogen dioxide concentrations to achieve legal compliance.  This will be economically damaging - it will deter tourism and business.
The following map plots NO2 concentrations in parts of Victoria and Westminster.


For further information, please contact:
 info@airqualitymatters.uk