|
AIR QUALITY MATTERS |
|
Borough of Tower Hamlets |
"Content with
greater congestion, caused by SIlvertown Tunnel?"
|
|
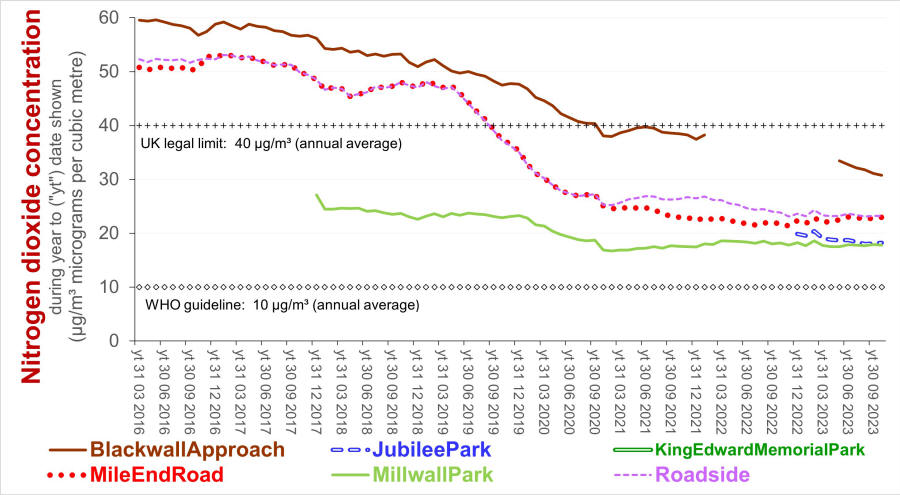
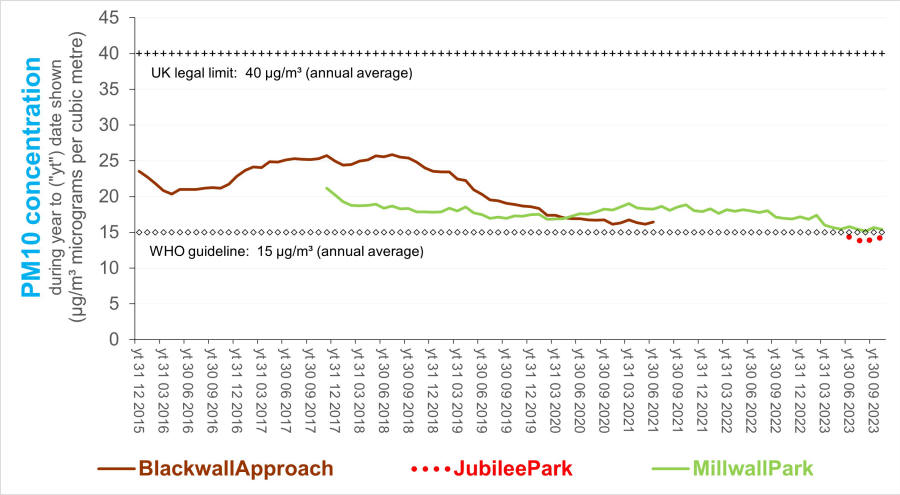
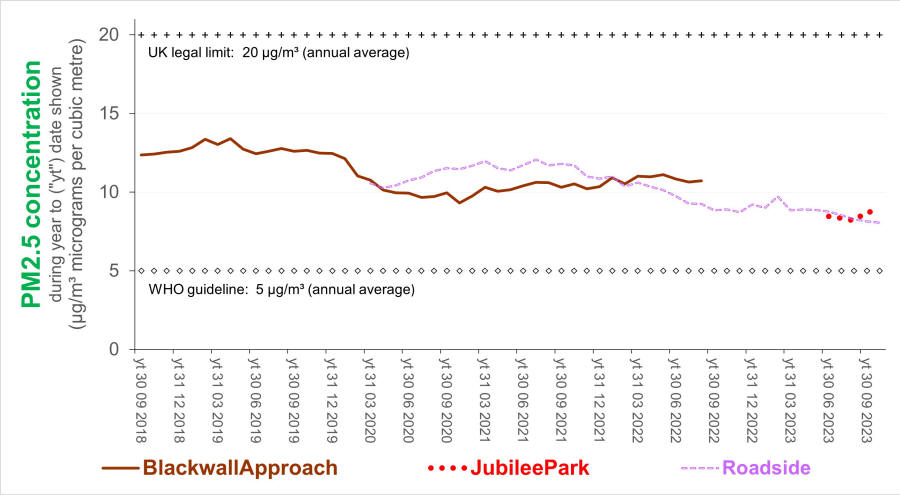
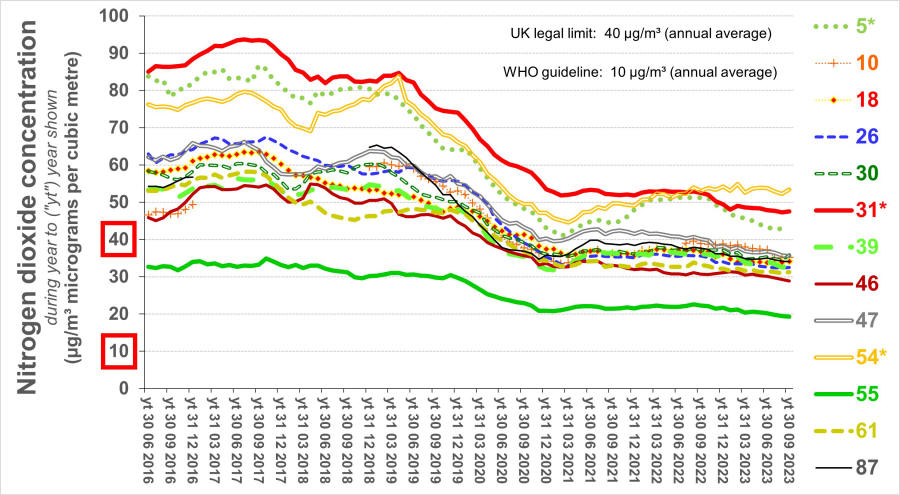
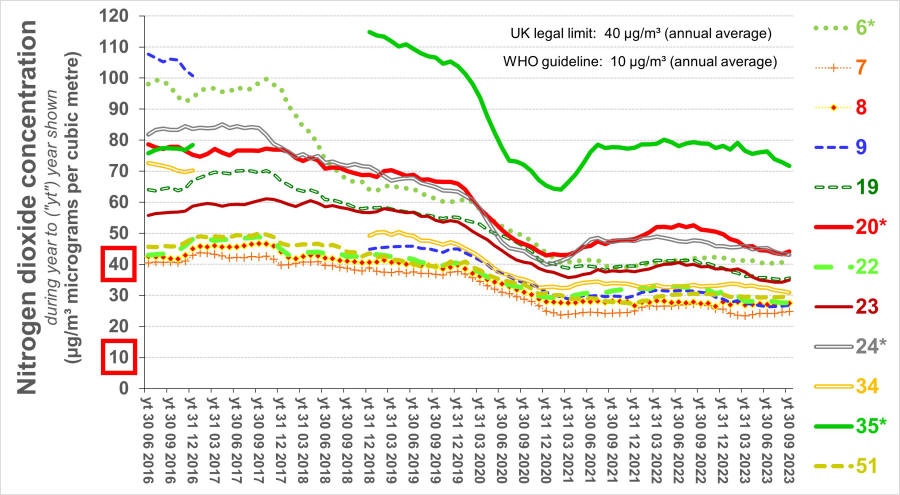
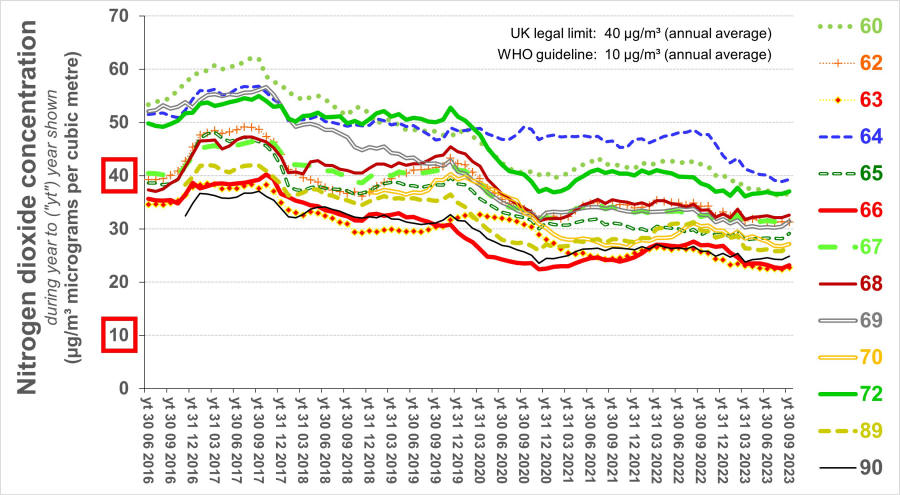
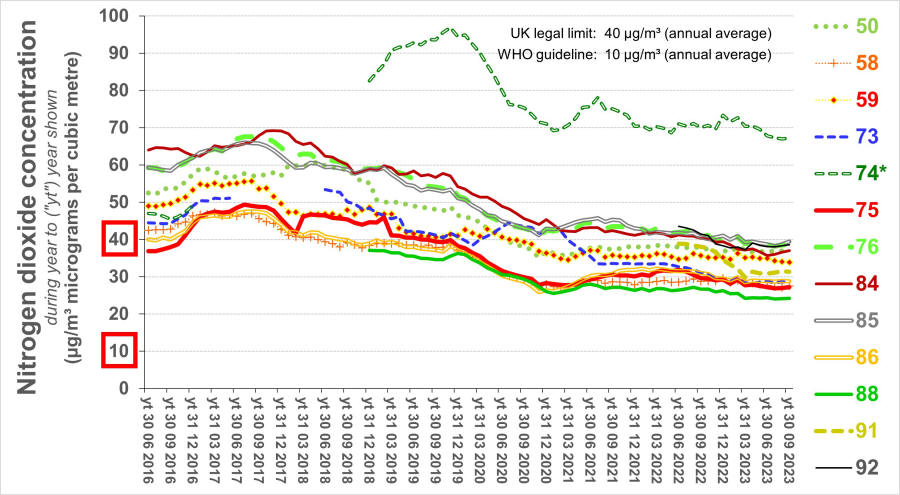
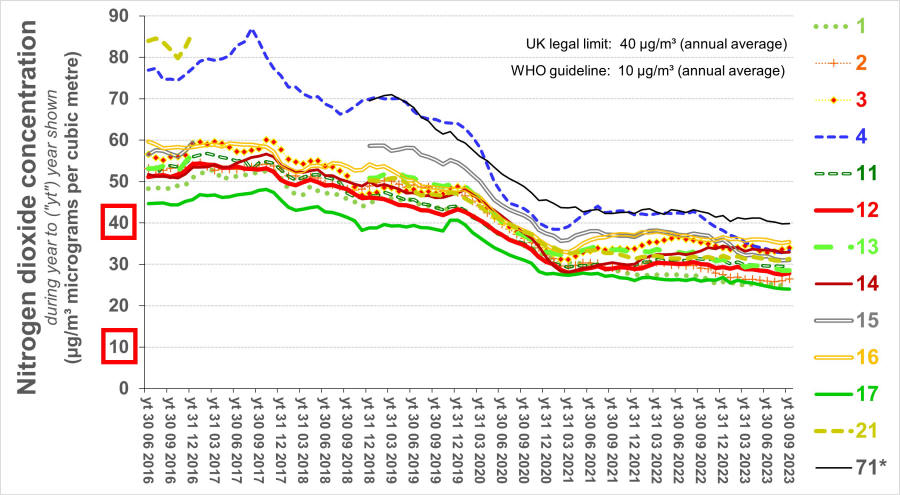
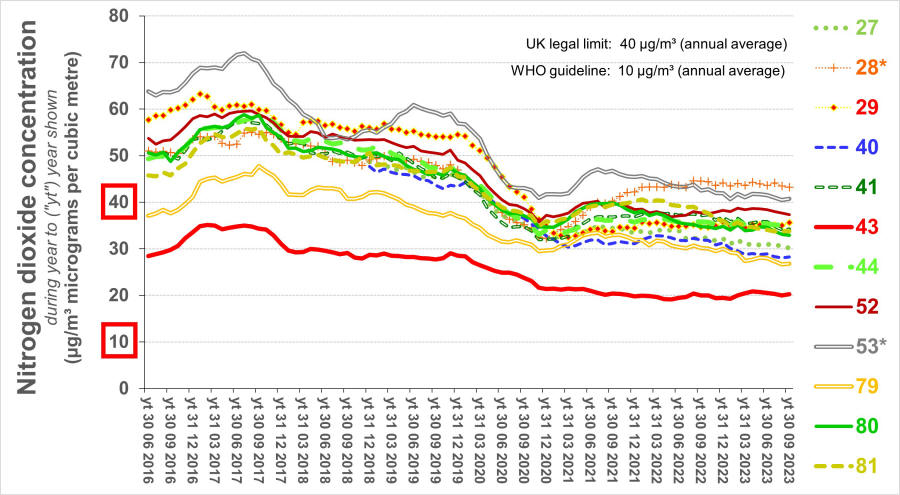
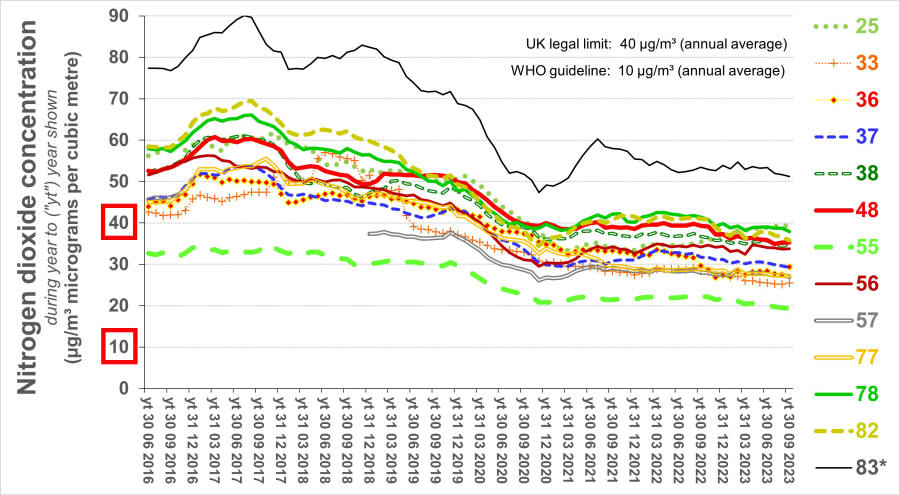
The following charts illustrate changes in the annual average concentration of three air pollutants which have occured since 2012. The measurements reflect conditions in the immediate vicinity of the monitoring site rather than in the named locality. The measurements for 2022 have yet to be fully ratified. They are based on London Air.
The following charts are based on the top notch
presentation of data measured by network of diffusion tubes
deployed by Tower Hamlets Council at 90 or so locations. The
amounts on which the charts are based include estimates where the
data presented by the Council is either missing or anomalous. In
general, concentrations of NO2 have substantiall decreased in
recent years but the rate of improvement has slowed now that
the ULEZ can't expand further.
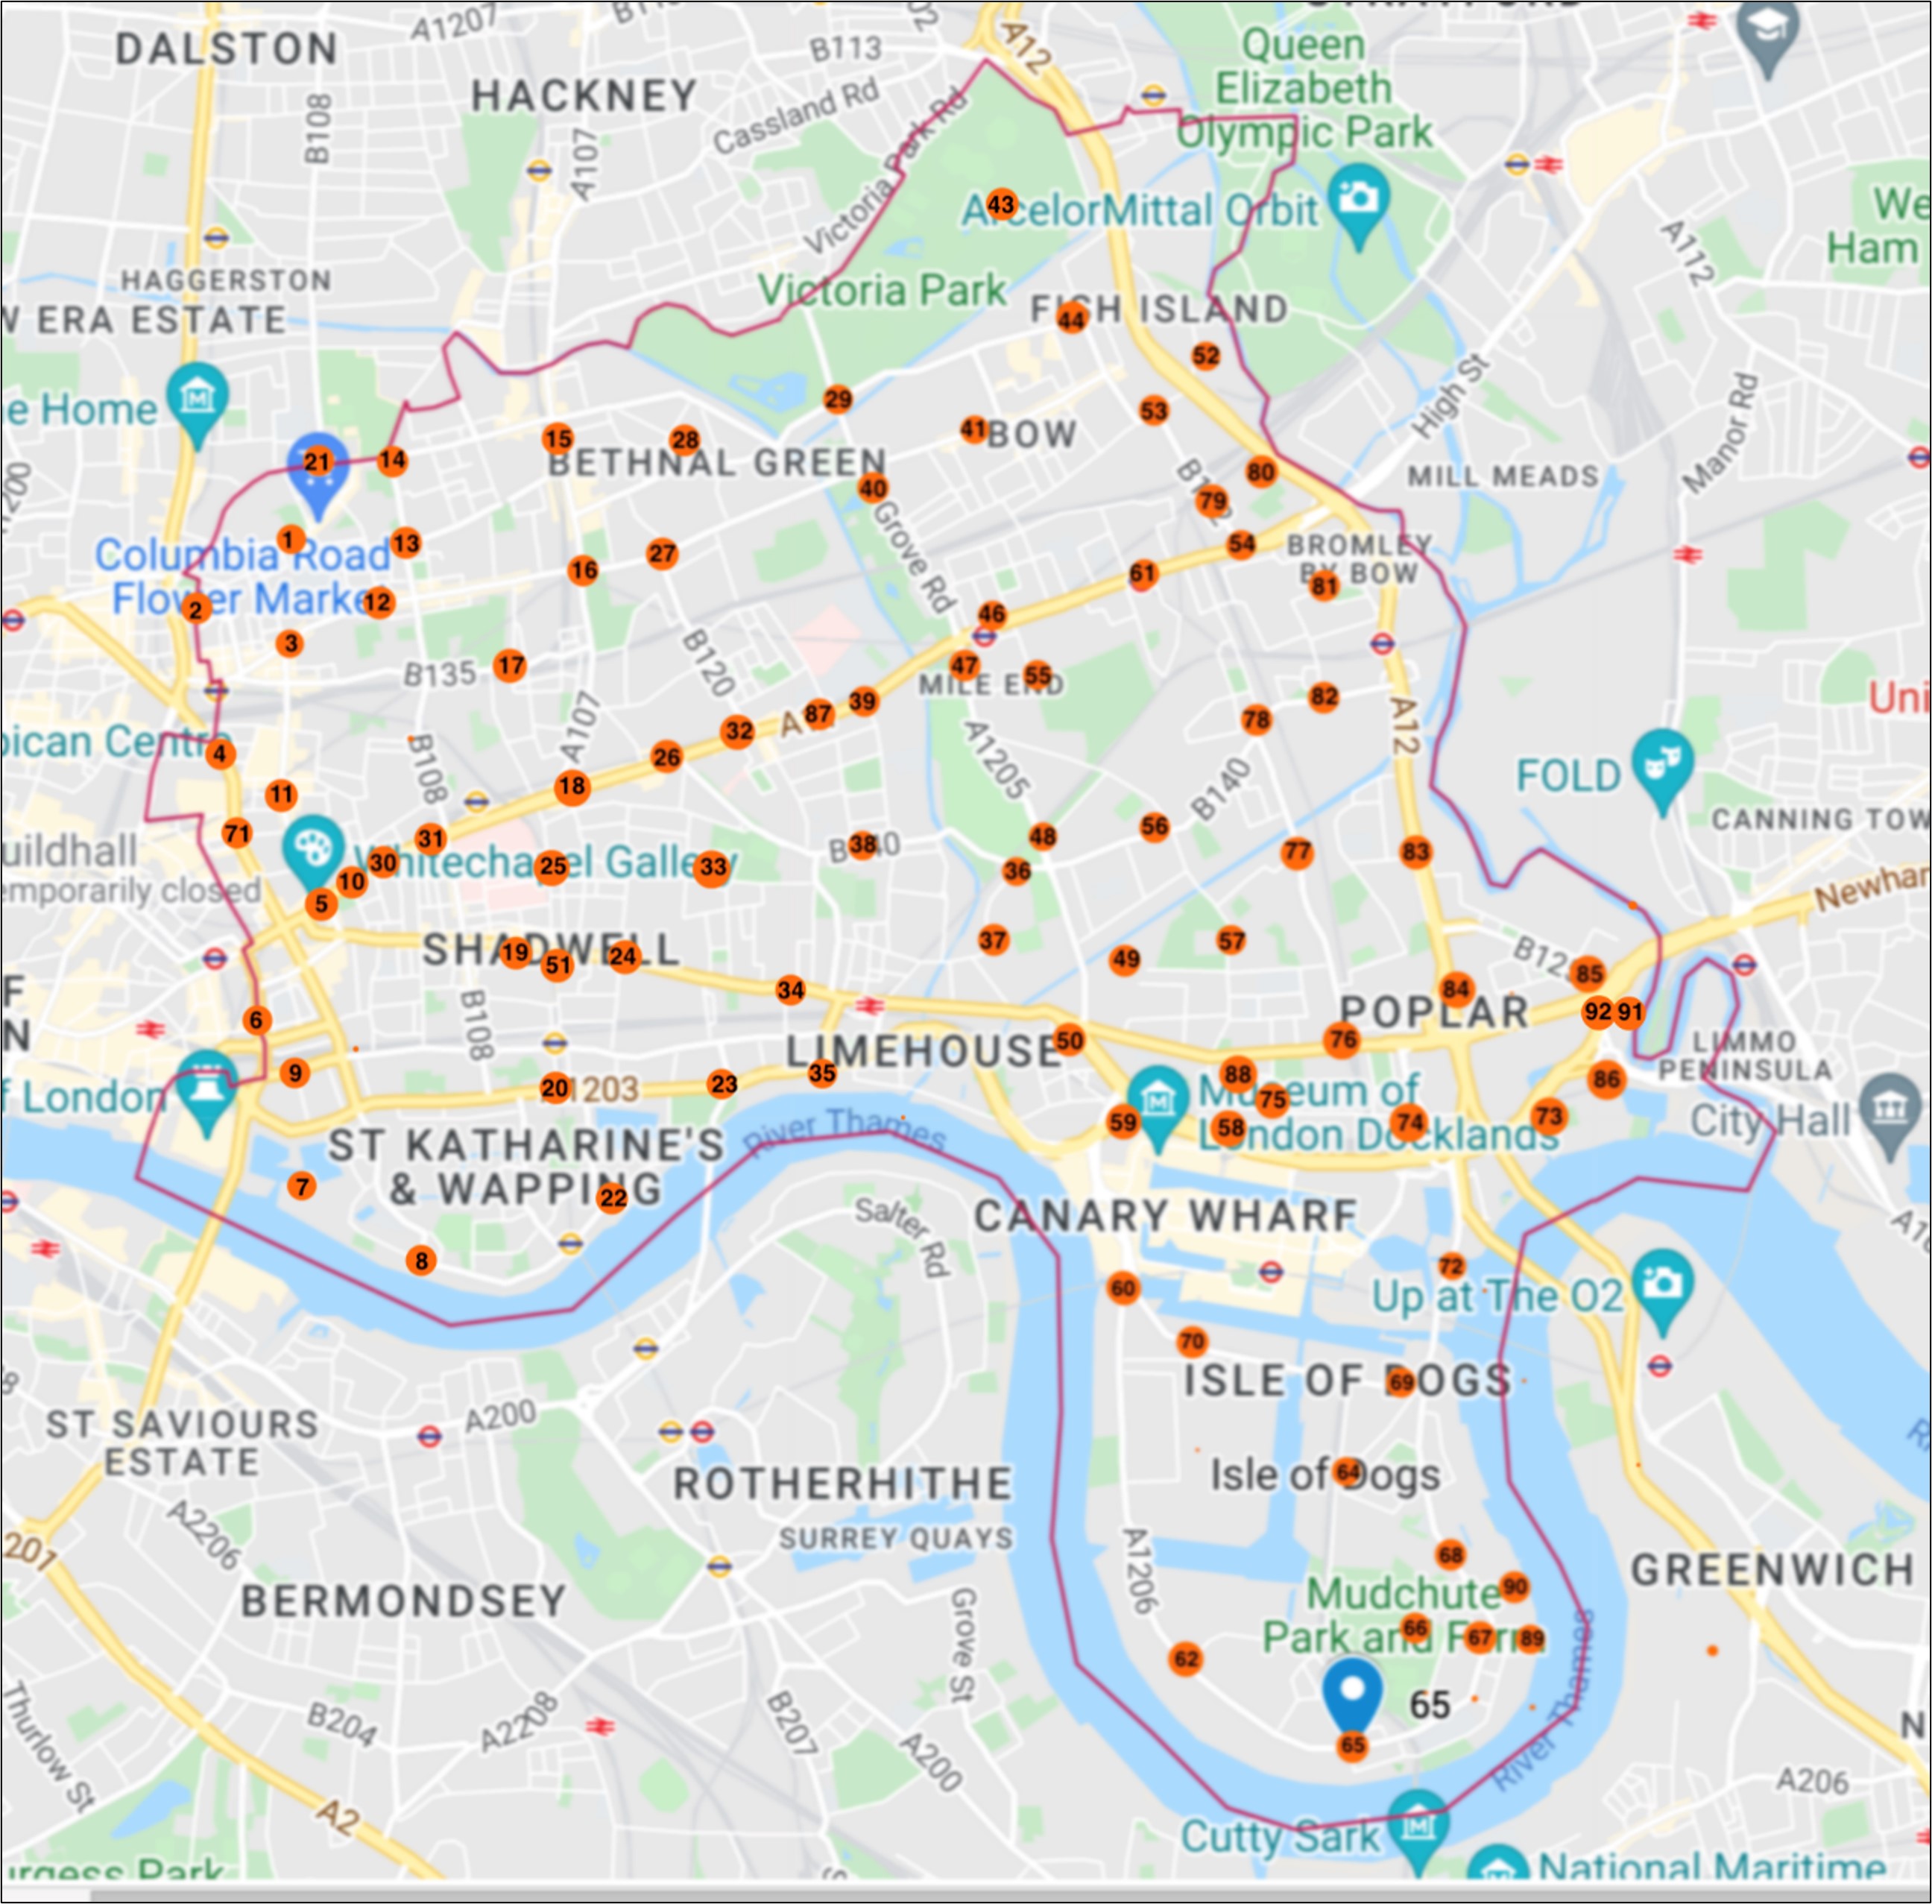
The map (from
here) identifies the location of each of the numbered
diffusion tubes.
Mile End Road -
greatest (and above the legal limit) at major junctions; the
remainder three to four times greater than World Health
Organisation guideline. Ten metres away,
concentrations would be only two to three times greater than the WHO
guideline (according to DEFRA's
calculator) assuming the background concentration is that
shown by tube 55 (at a site in Cemetry Park).
St Katharine's and Wapping
- worse than elsewhere in Tower Hamlets; well above the legal
limit) at the Narrow Street / Limehouse Link junctions; above that
limit also at Mansell Street, Dellow Street / The Highway, and
Jubilee Street / Commercial Road; the remainder all more than
double the WHO guideline.
Canary Wharf and Isle of Dogs - all within the
legal limit but more than double the WHO guideline; worst at
Limeharbour.
Poplar - much the worst at the Poplar High Street
/ Cotton Street junction, otherwise within the legal limit but
well above twice the WHO guideline.
Bethnal Green (west and central) - roughly triple
the WHO guideline except at the Toynby Street / Commercial Road
junction (at the legal limit).
Bethnal Green (east) and Bow - just over the
legal limit at Bonner Road and the junction between Fairfield Road
and Tredegar Road; otherwise mainly between three and four time
greater than the WHO guideline; but much the best (as one might
expect) in Victoria Park (double the WHO guideline).
Since 2018, the average of the
concentrations measured by the two diffusion tubes at Victoria
Park have tended to vary between 80% and 90% of the ratified
monthly concentrations reported for the reference monitor with
which they have been co-located. That range is similar to
the range for diffusion tubes co-located with reference monitors
elsewhere in London.
Central Tower Hamlets - generally three to four
times greater than the WHO guideline; well above the legal limit
at the junction between Zetland Street and the A12; only double
the WHO guideline in Tower Hamlets Cemetry Park.
|
|
For further information, please contact: info@airqualitymatters.uk |
| Back |