|
AIR QUALITY MATTERS |
|
Silvertown Tunnel neighbourhood |
|
|
|
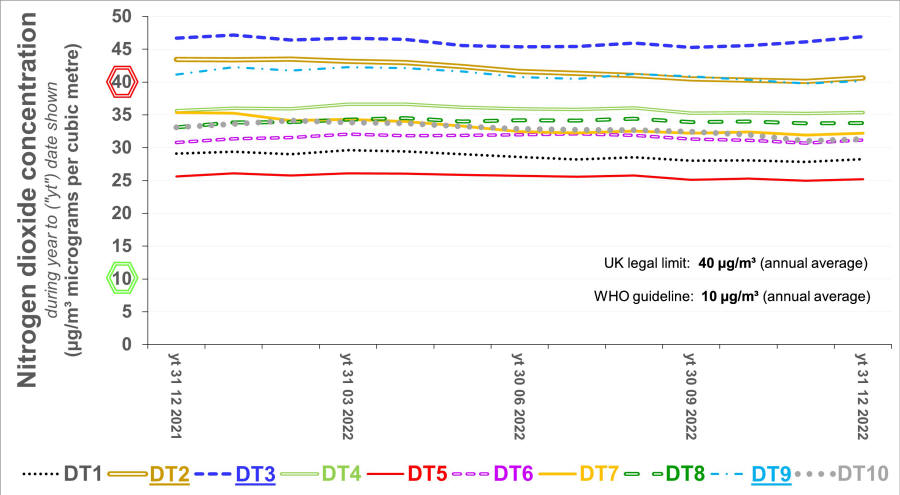
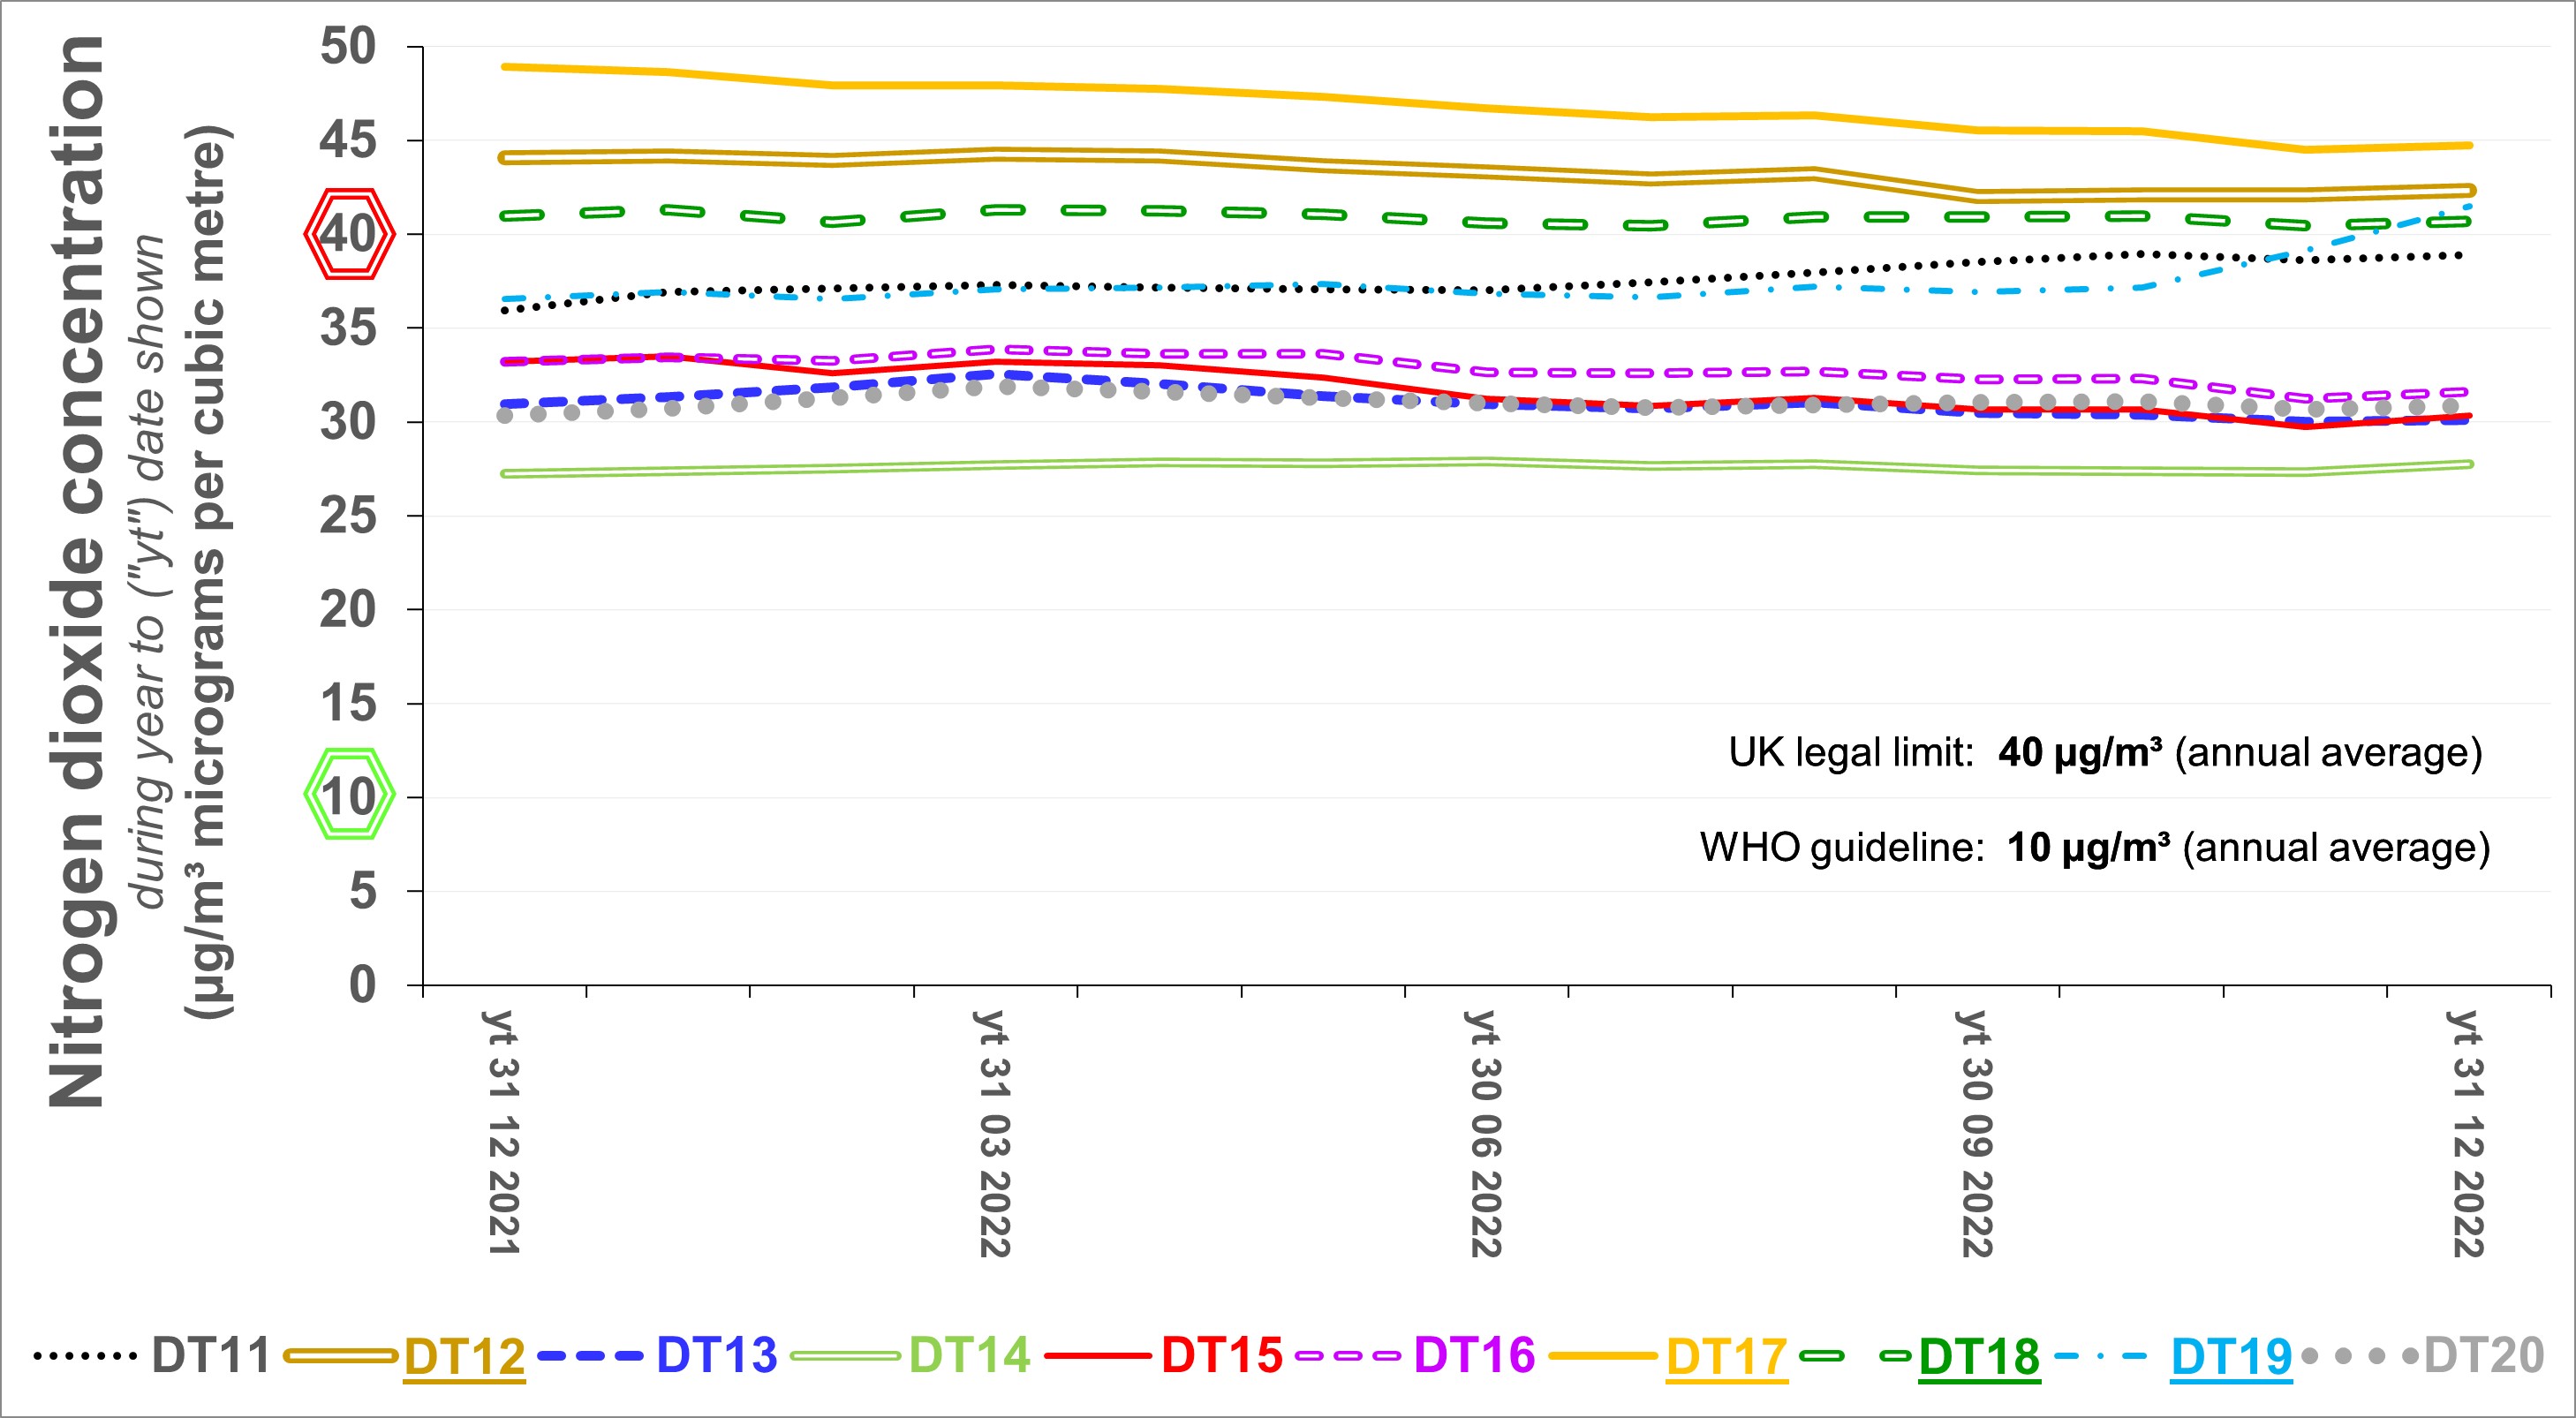
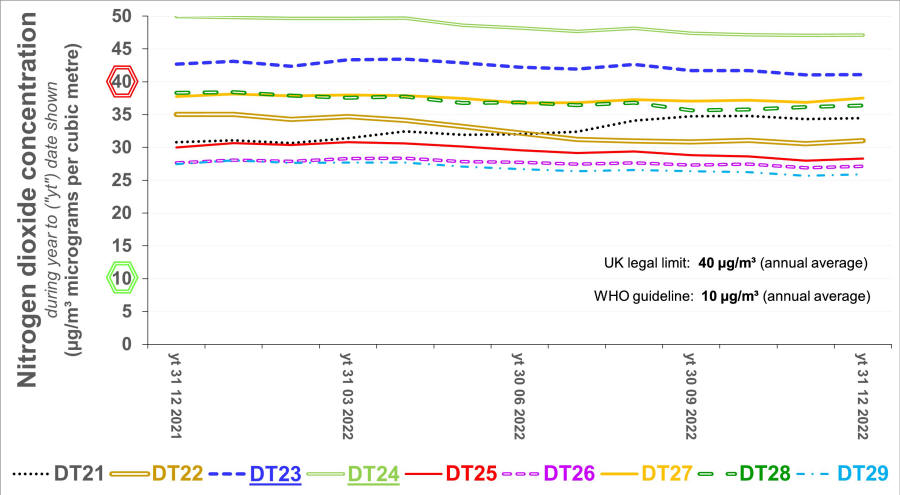
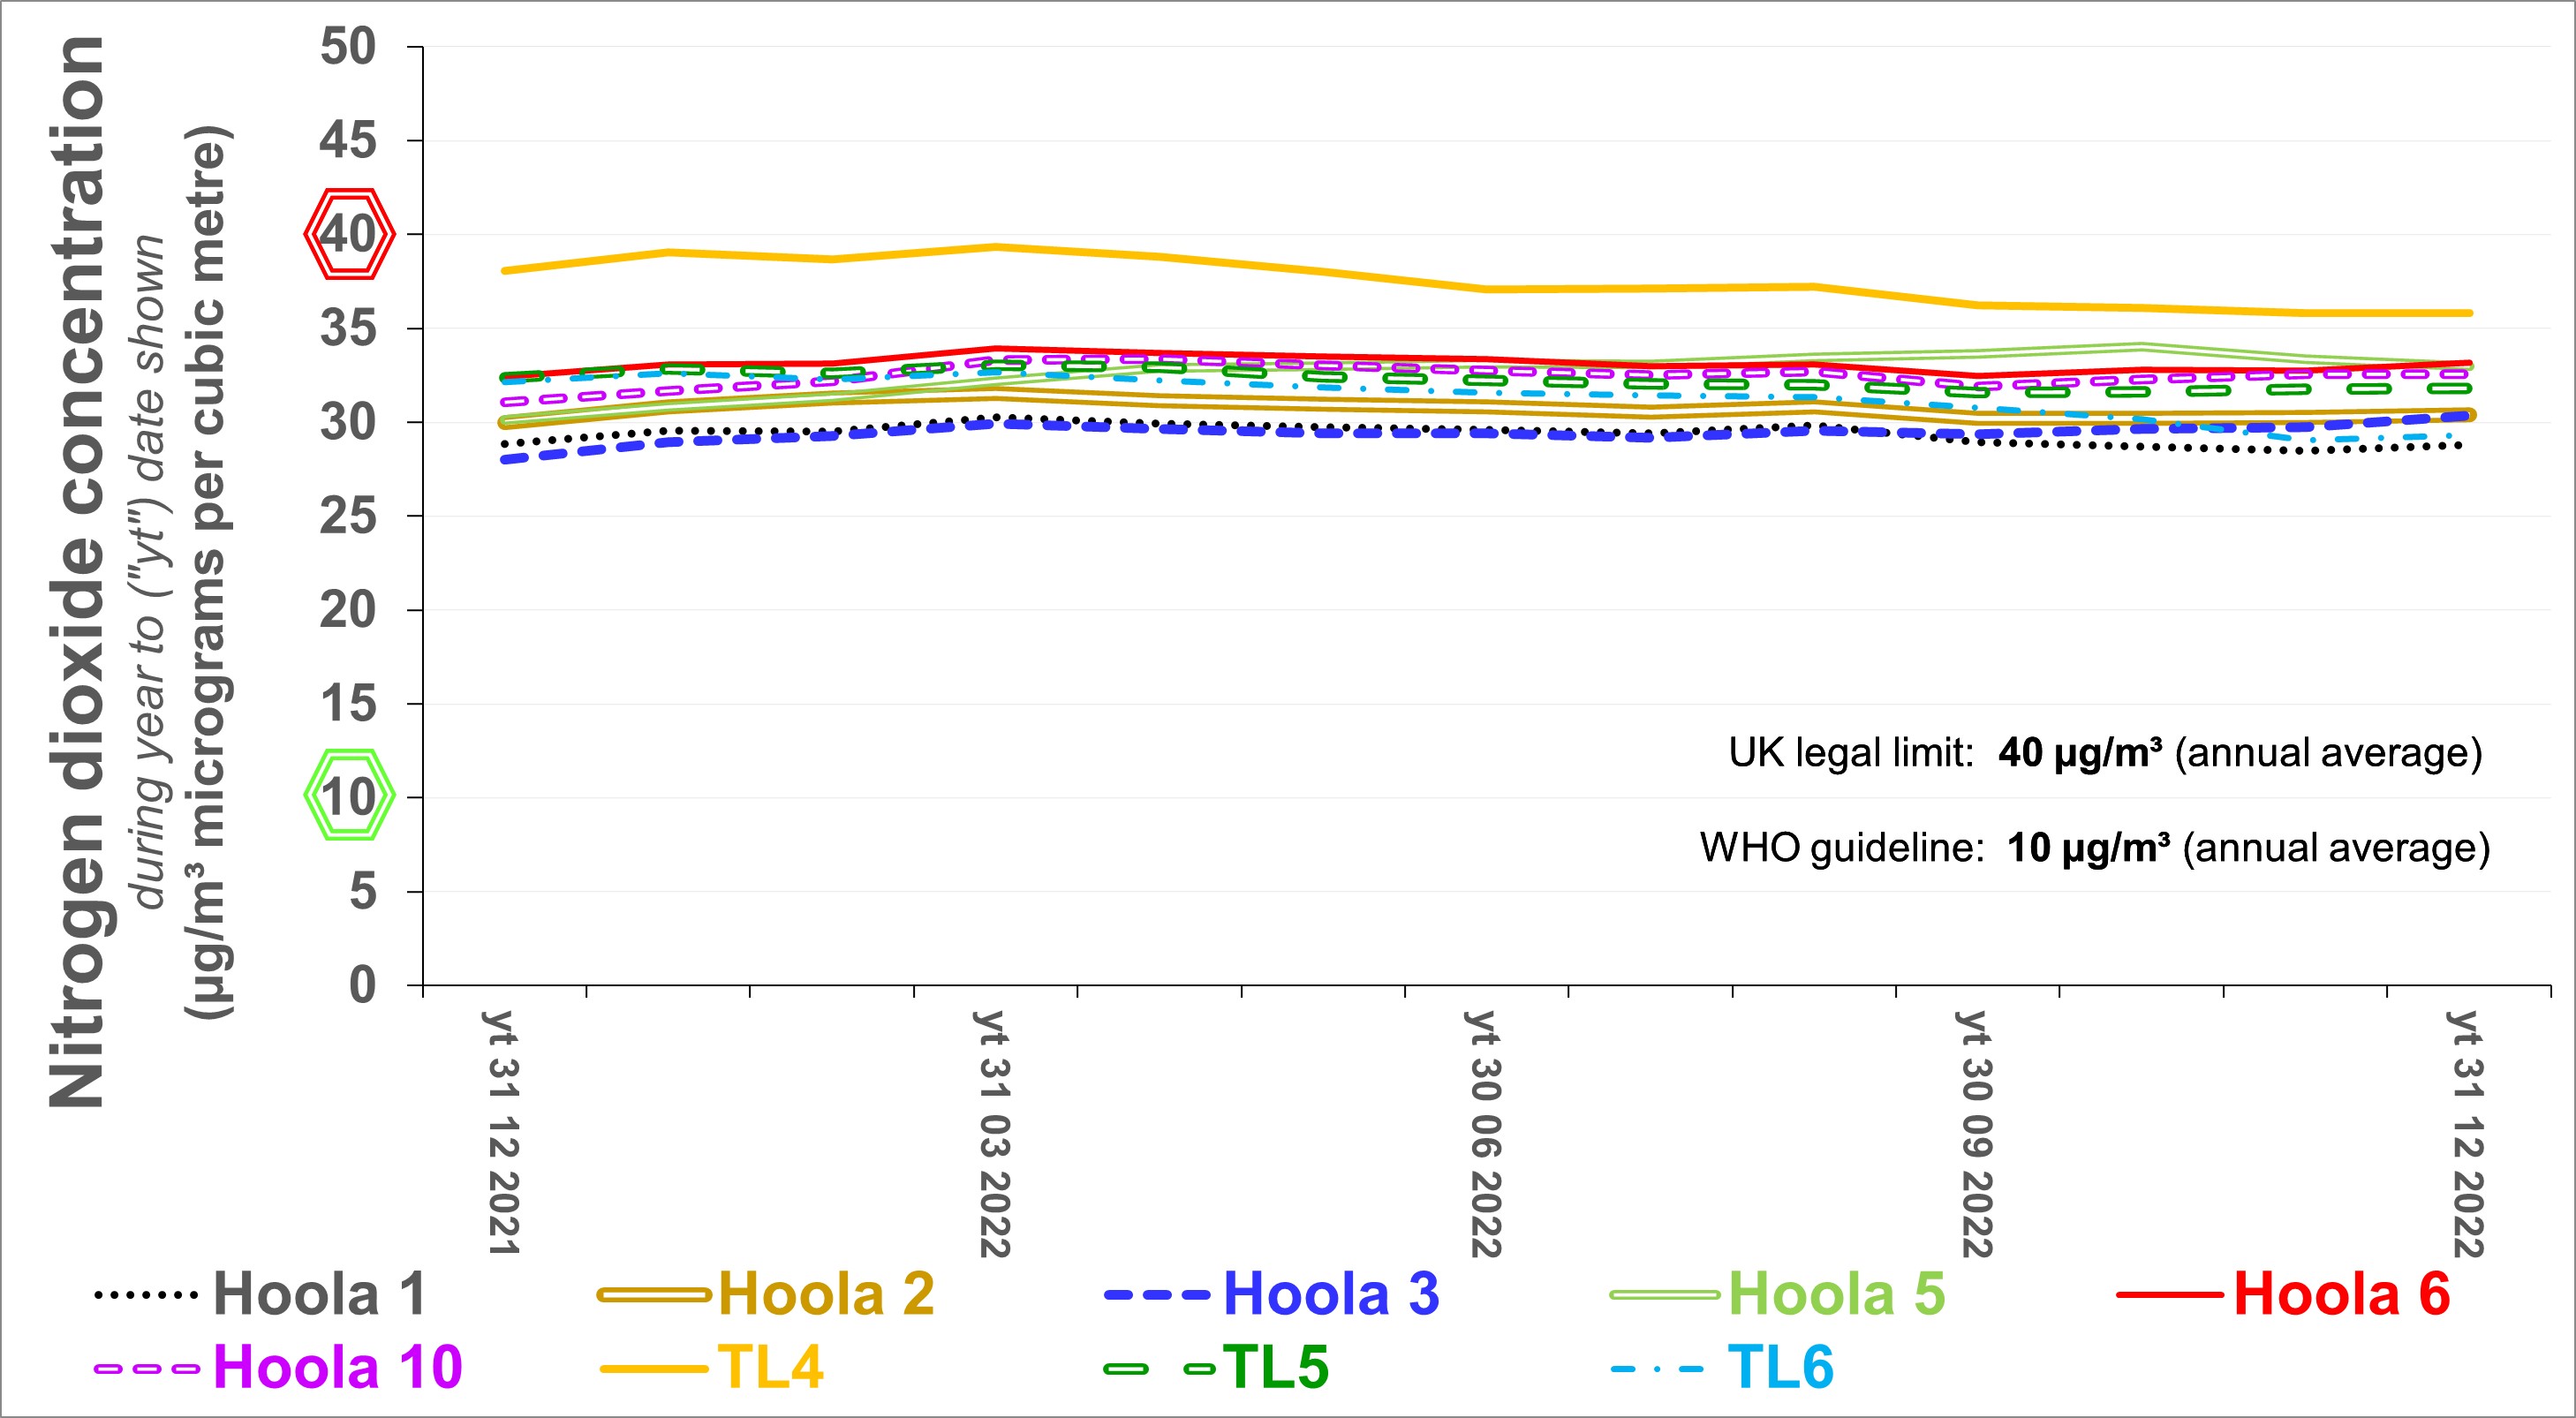
The Silvertown Tunnel Implementation Group "STIG" is to monitor air quality in locations likely to be effected by traffic flows attributable to the (costly, congestion creating? / climate and air quality worsening? / casuality increasing?) Silvertown Tunnel. STIG is to do so for threee years prior to the opening of the tunnel and for three years thereafter. Despite the level of controversy surrounding the Silvertown Tunnel, STIG's first two annual reports are unlikely to be useful for a major stakeholder group - the general public - and perhaps another significant group - local councillors. One might wonder whether this either is intentional or reflects disinterested management management and poor terms of reference. For example, presenting charts of hourly data - tightly squiggling lines - might be either cynical (to obfuscate) or lazy. The charts presented on pages of this website referring to air quality (not only nitrogen dioxide) in the boroughs neighbouring the Silvertown Tunnel may - at no cost - be more helpful to those key stakeholders, as might those below. [See either the index, or Greenwich, Lewisham, Newham, Tower Hamlets.] The following charts are based on raw monthly data for nitrogen dioxide presented as an Appendix in the air quality annual reports for 2021 and 2022. Concentrations have been estimated for months in which no data is available. Details of the locations referred to in the legend (beneath the x-axis) is provided in Table 4-2 (page 13) of the 2022 annual report.
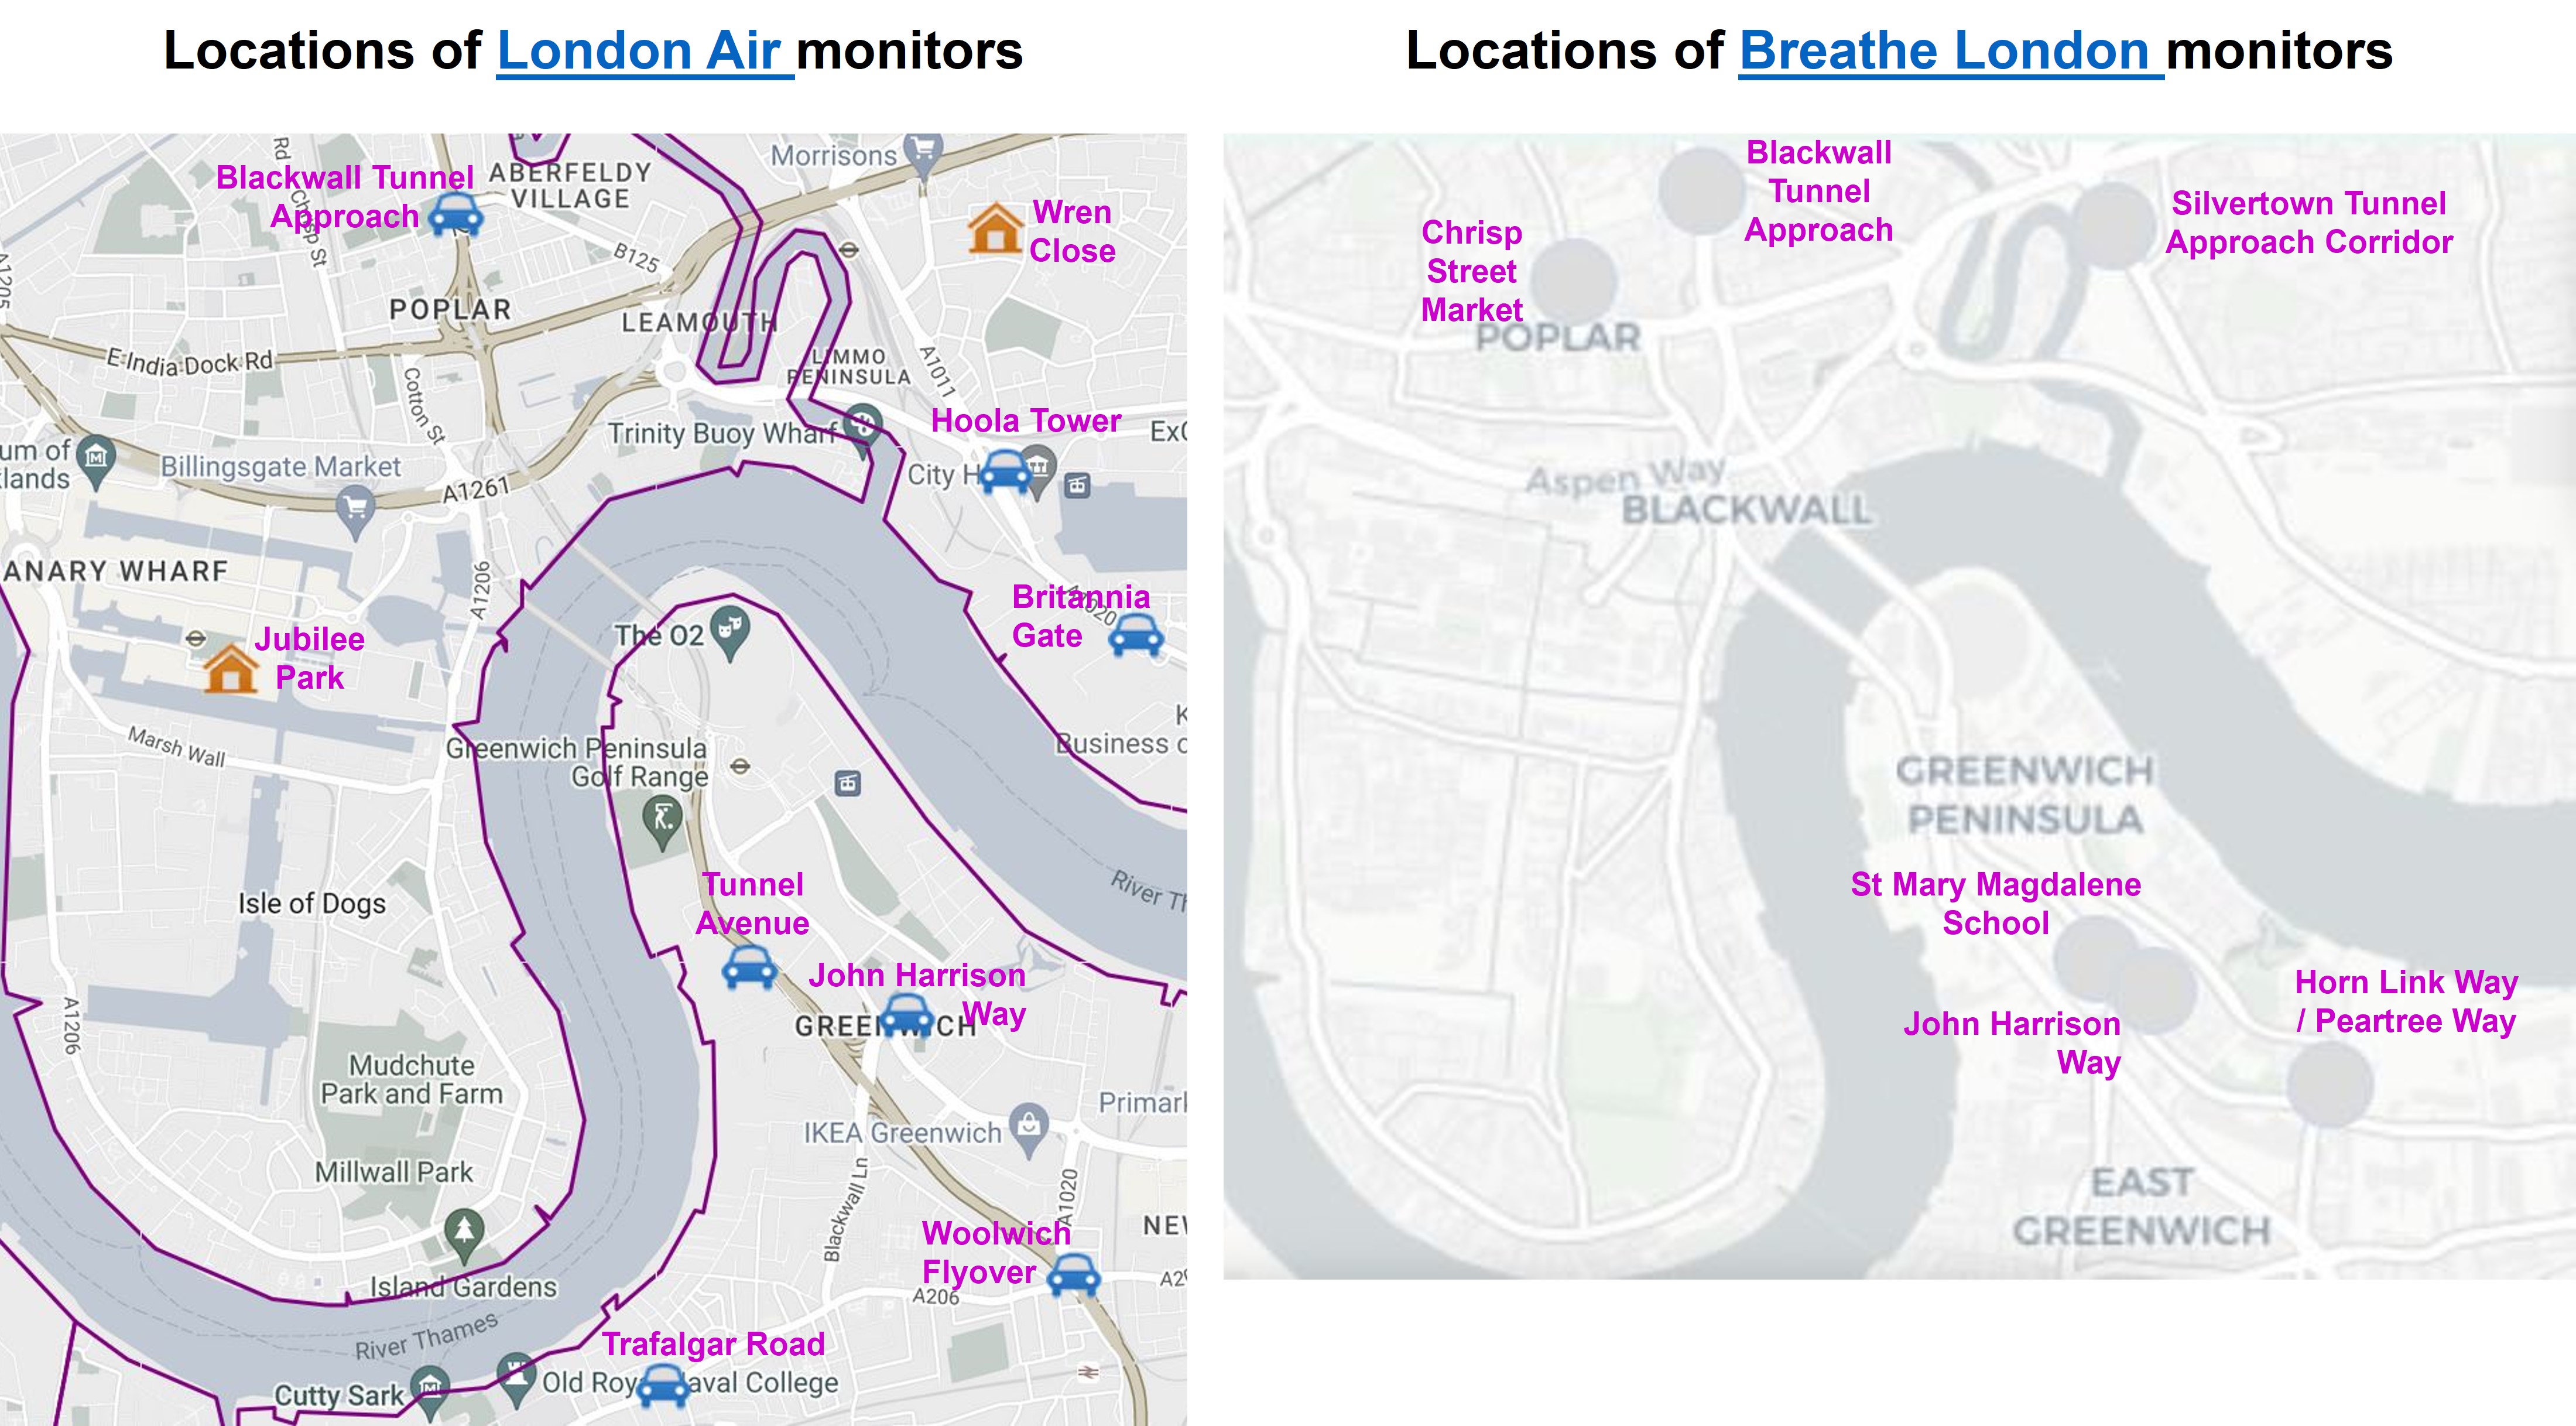
Click the following map to view charts presenting data reported by
the monitors shown for nitrogen dioxide, PM2.5, and PM10 - if
available.
|
|
For further information, please contact:pan> info@airqualitymatters.uk |
| Back |