|
AIR QUALITY MATTERS |
|
Royal Borough of Kensington and Chelsea |
|
|
|
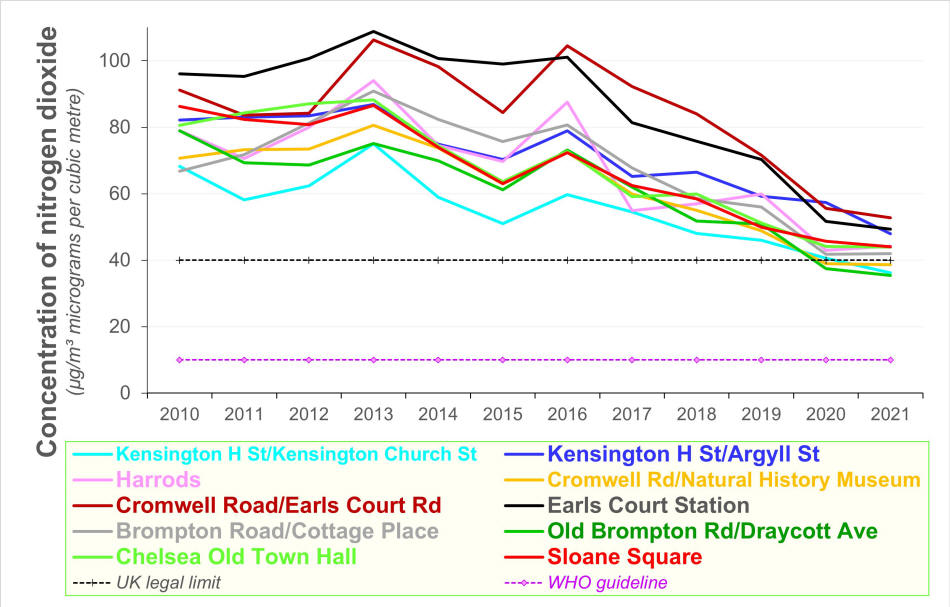
The following chart shows how the annual average concentration of NO2 changed between 2010 and 2021 at prominent sites in the Royal Borough of Kensington and Chelsea (- the data derive from monthly measurements by diffusion tubes):
The data above indicate that NO2 concentrations continue to exceed the legal limit at almost all the sites shown. The legal limit (40 micrograms per cubic metre) should have been achieved by 2010. The legal limit is four times greater than the World Health Orgnisation guideline. The improvement since 2019 is attributable to the ULEZ (and the LEZ and their extensions). Court rulings subsequent to cases brought by ClientEarth oblige government to ensure NO2 concentrations decline to beneath the legal limit in the shortest possible time.
Research by Imperial College
[see
/ listen from minute 15:10]
indicates that NO2 concentrations are unlikely to meet that
requirement, particularly along those busy streets (and in their
neighbourhood), even when the proposed Ultra Low Emission Zone is
fully implemented across London.
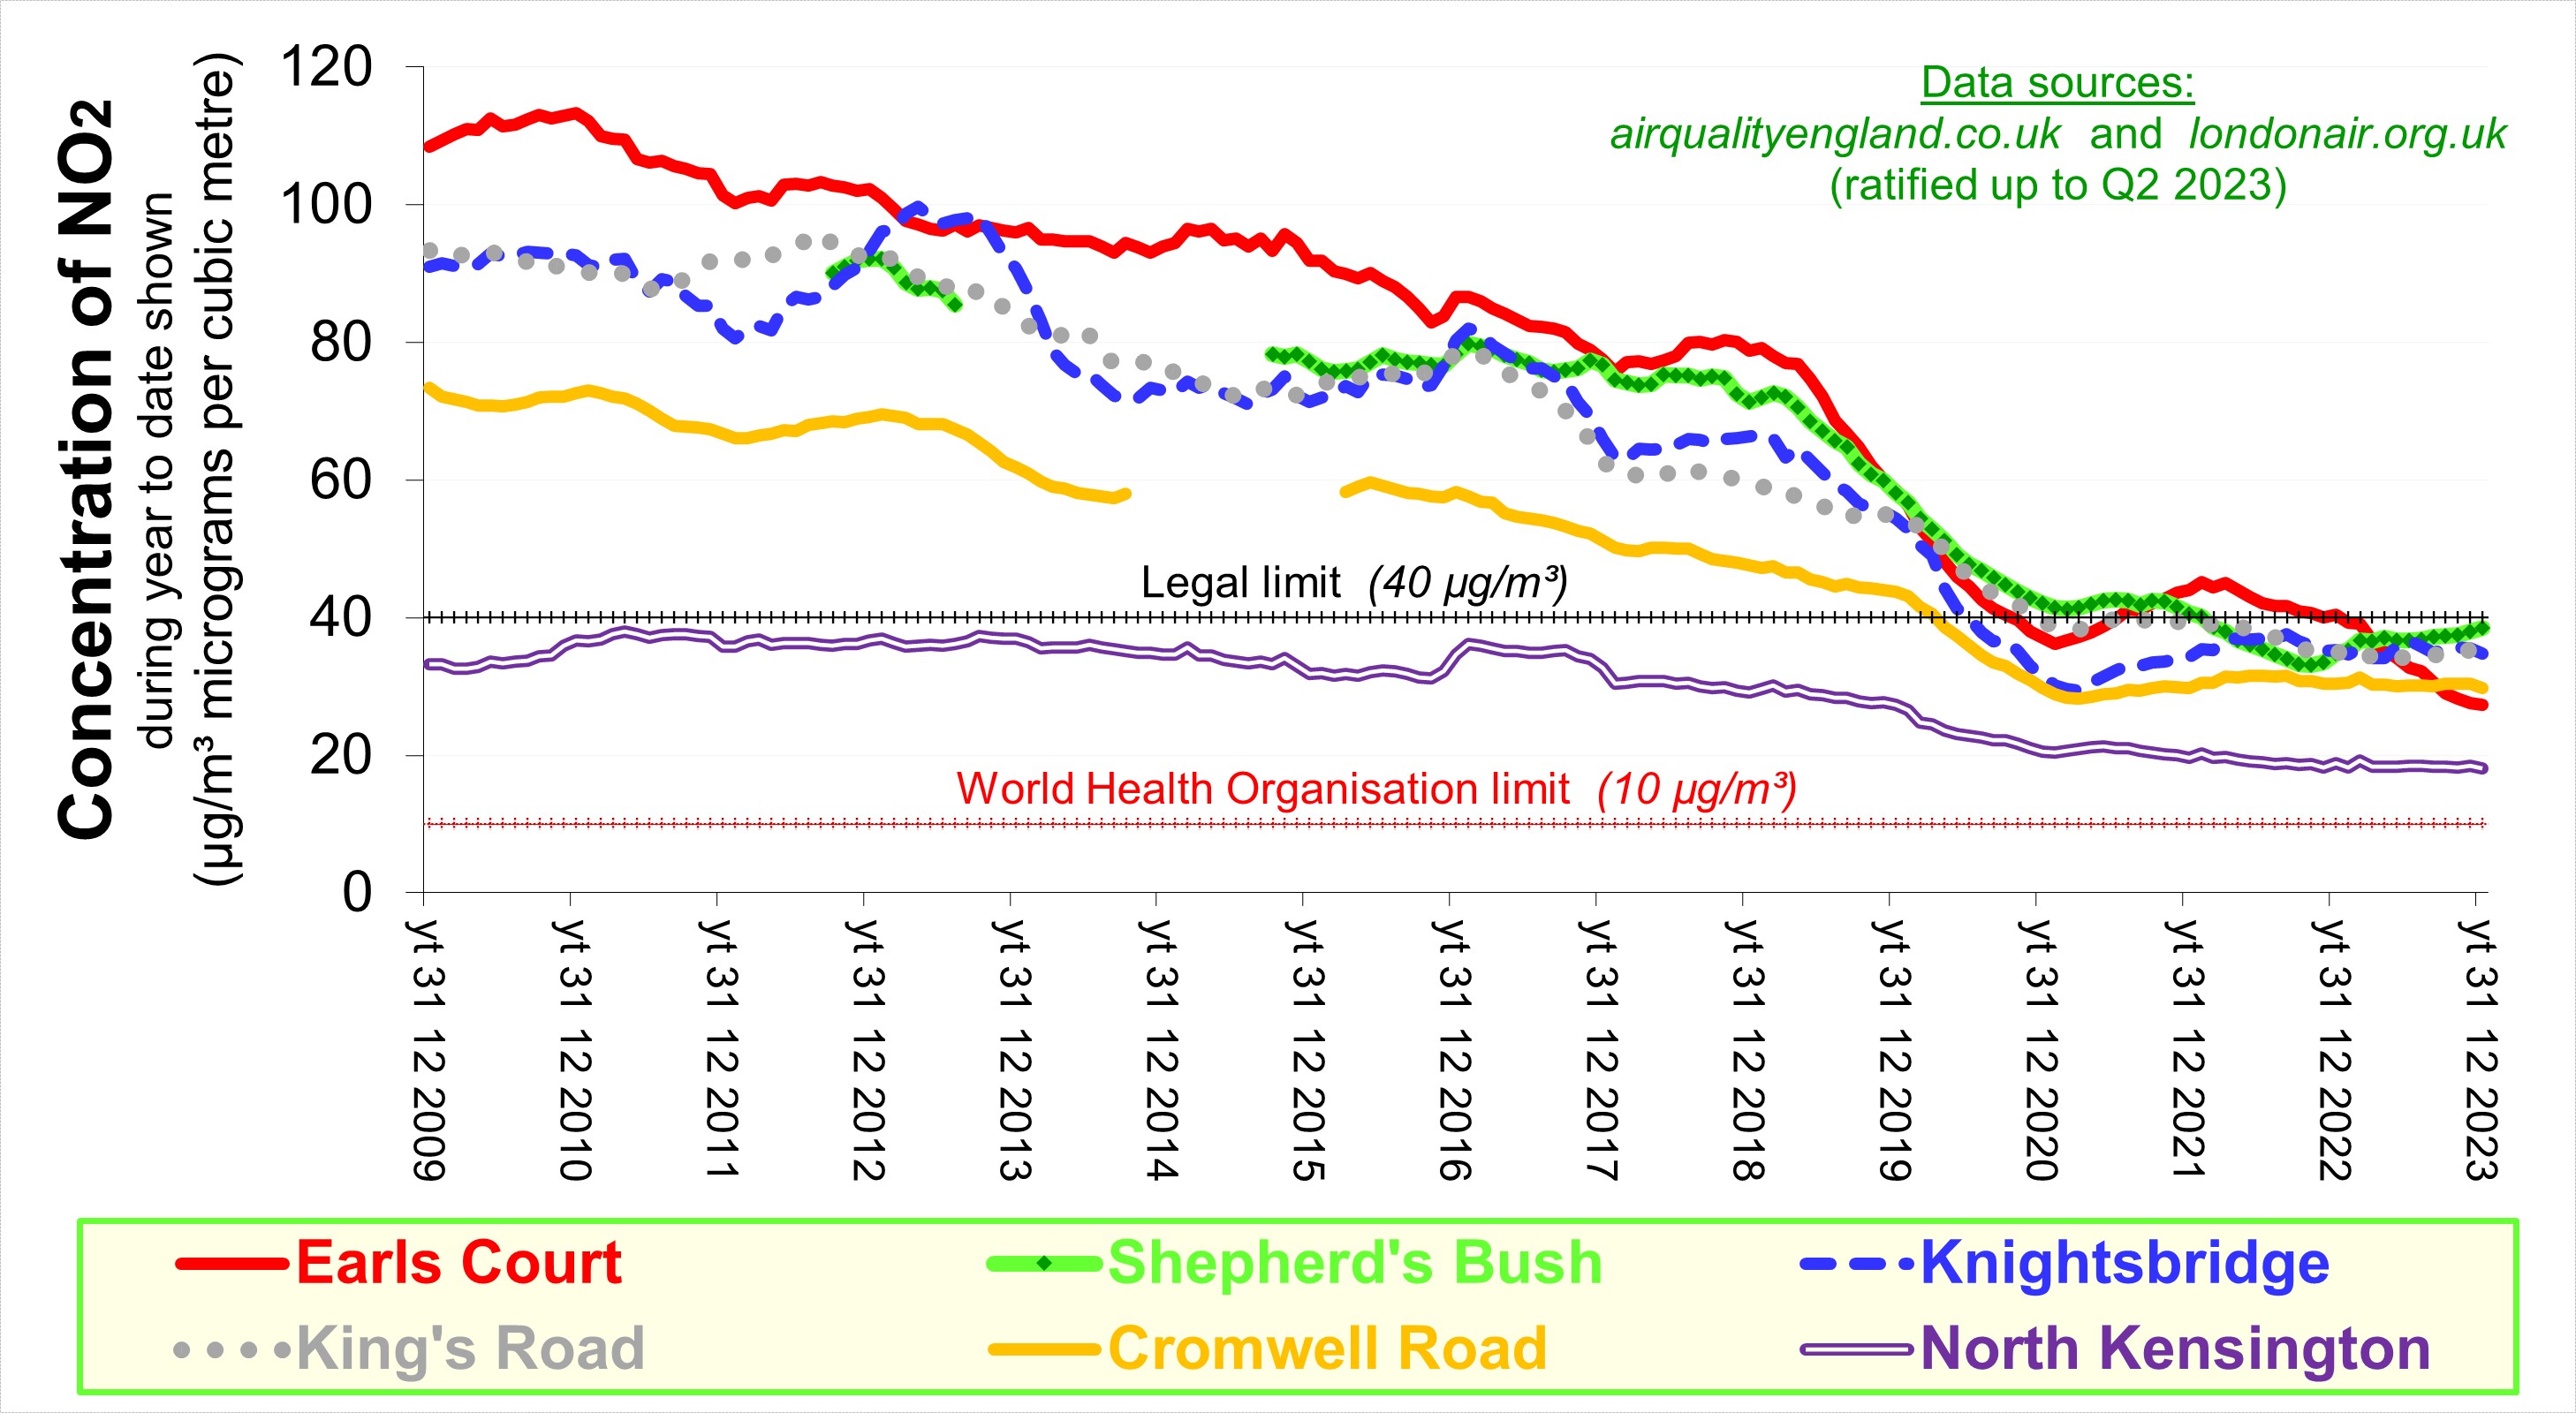
The following chart presents the data measured contiuously at five
reference sites, doing so as annual
averages for the average of each consecutive month:
Measurements at the four most propminent have now ceased.
The fifth location "North Kensington" is classified as an "urban
background", where there is little traffic and industry.
The chart illustrates the improvement since introducing the ULEZ.
The improvement attributabe to expanding both the LEZ and the ULEZ
is masked by the impact of covid-related lockdowns.
Click the following names for information concerning NO2
concentrations in those wards:
Norland
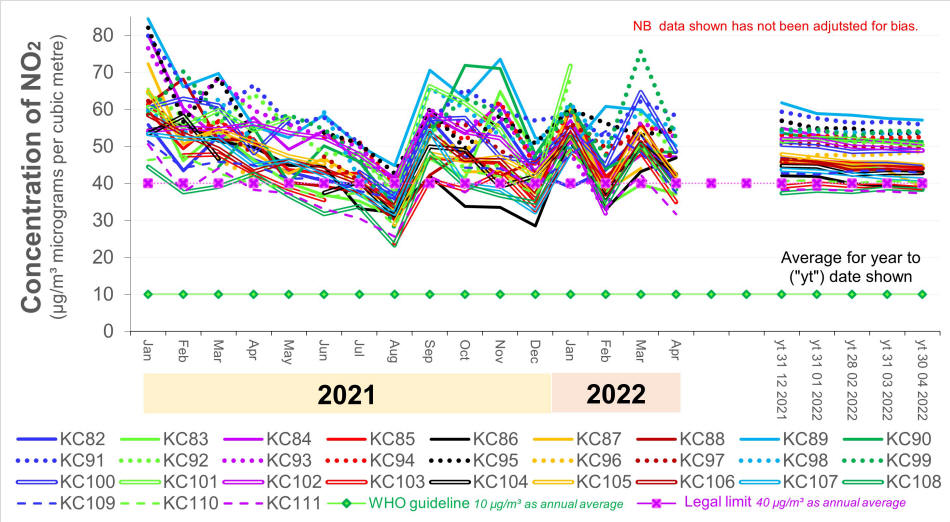
Nitrogen dioxide concentrations along
Kensington High Street (based on
Air Quality Annual Status Report for 2021 and a Freedom of
Information request; raw data not adjusted for bias)
Multiplying the 2021 data shown above by 0.83 (the bias adjustment
factor adopted by RBKC council) the right hand of the chart suggests that,
in 2021, air quality along Kensington High
Street was illegal for much of its length, 12 years after the
deadline for compliance. As a proxy for progress towards net
zero, this ominously reflects disregard for public interest. (NO2
in urban areas derives primarily from combustion of diesel and,
for central heating & hot water, methane.)
Concentration of NO2 at eastern end of Kensington High Street
The chart above tends to confirm that the devices deployed at
sites KCM01 and KCM02 generate spurious data for NO2, whether or
not the data is adjusted for presentation in RBKCs Air Quality
Annual Status Report. The data for PM2.5 is unusable.
It is unclear why this data is published (including by
airqualityengland.co.uk)
|
|
For further information, please contact: info@airqualitymatters.uk |
| Back |
|
|