|
AIR QUALITY MATTERS |
|
NO2 diffusion tube data in Westminster "Data more up-to-date and accessible than other London boroughs - but ignored?" |
|
|
|
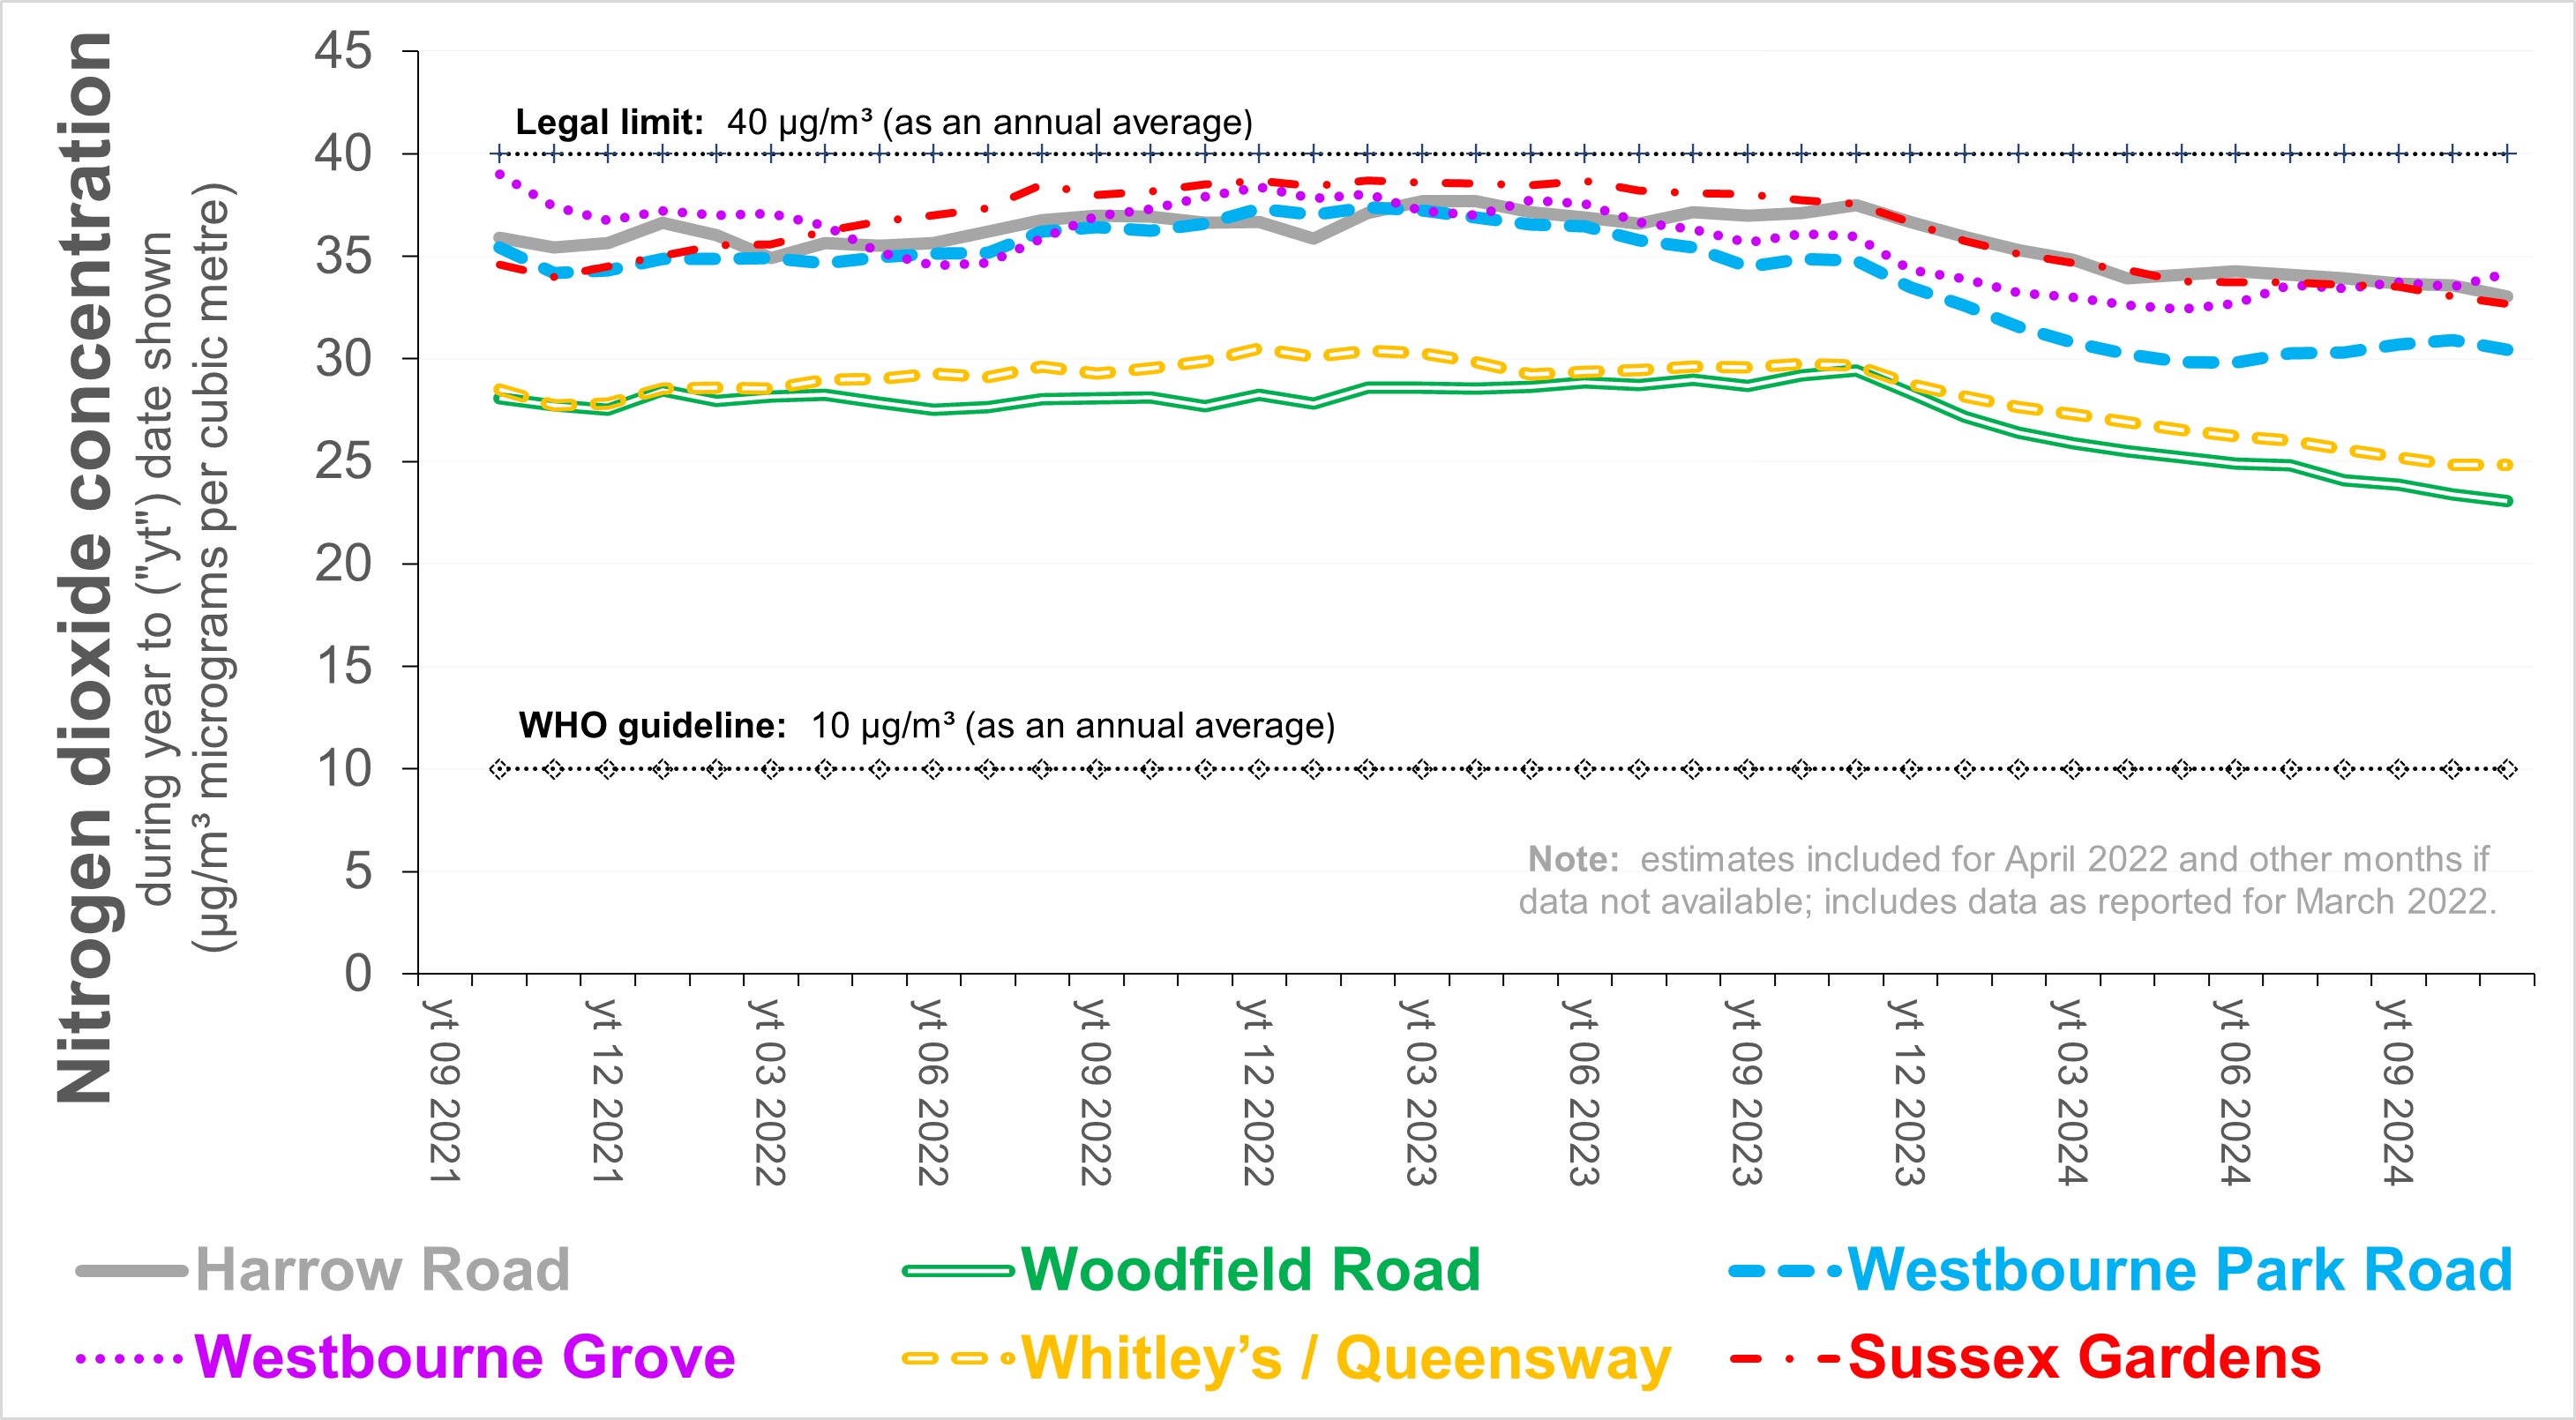
Westminster City Council stopped measuring nitrogen dioxide ("NO2") concentrations using diffusion tubes immediately the UK government required that those concentrations should be less than 40 micrograms per cubic metre by 2010. The City Council contiued doing so only after "feedback"[p27] from both DEFRA and the GLA. The data in the following charts presents the concentrations which have been or will be published in the Council's (at times kong overdue) Air Quality Annual Status Reports ("AQASR") and its recently launched air quality data platform. The latter data is currently accissible by hovering over the icon of each site and transcribing the concentrations one by one... Because NO2 pollution derives primarily from combustion, currently mainly of carbon-based fuel (which must cease) all local authorities should publish their diffusion tube data with a lag of less than two months - together with a caveat noting both that the data is as measured and not yet adjusted for bias and that the data is provisional, pending publication of the corresponding AQASR.
The
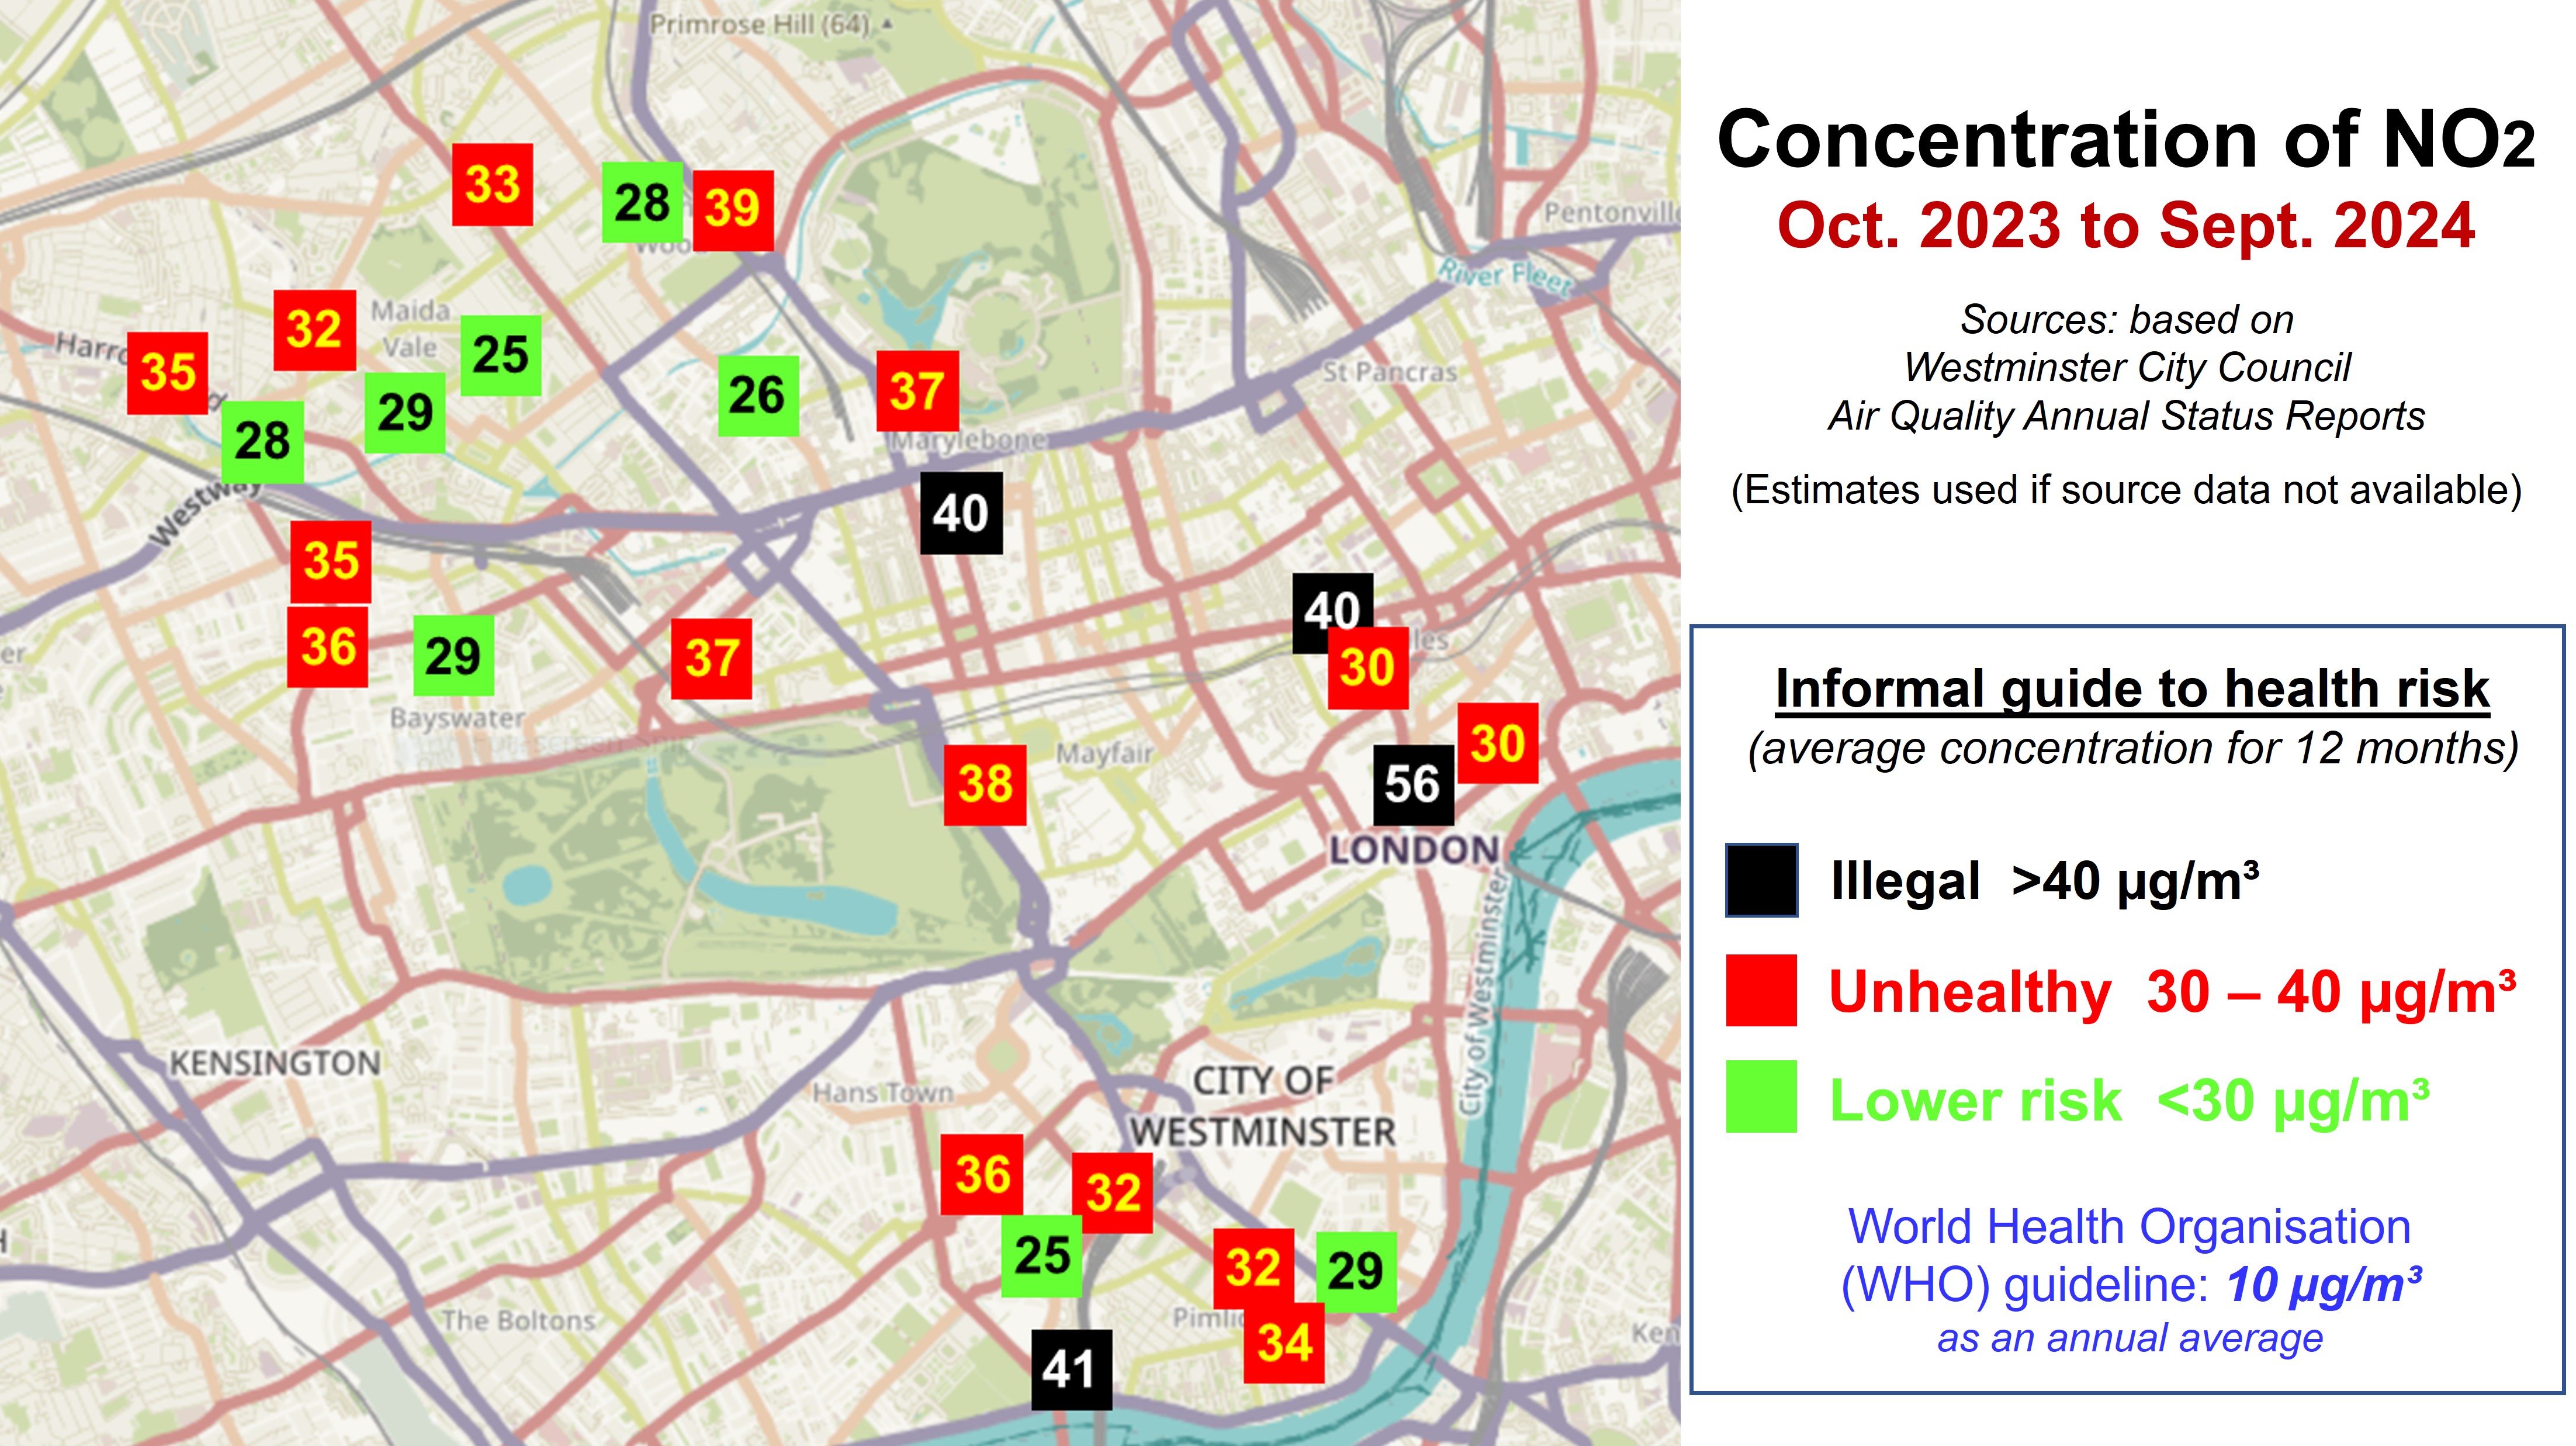
chart below refers to average concentrations of NO2
for the 12-month period October 2023 to November 2024. Click
the chart for a pdf file showing similar charts
for successive 12-month periods starting with November
2020-October 2021.
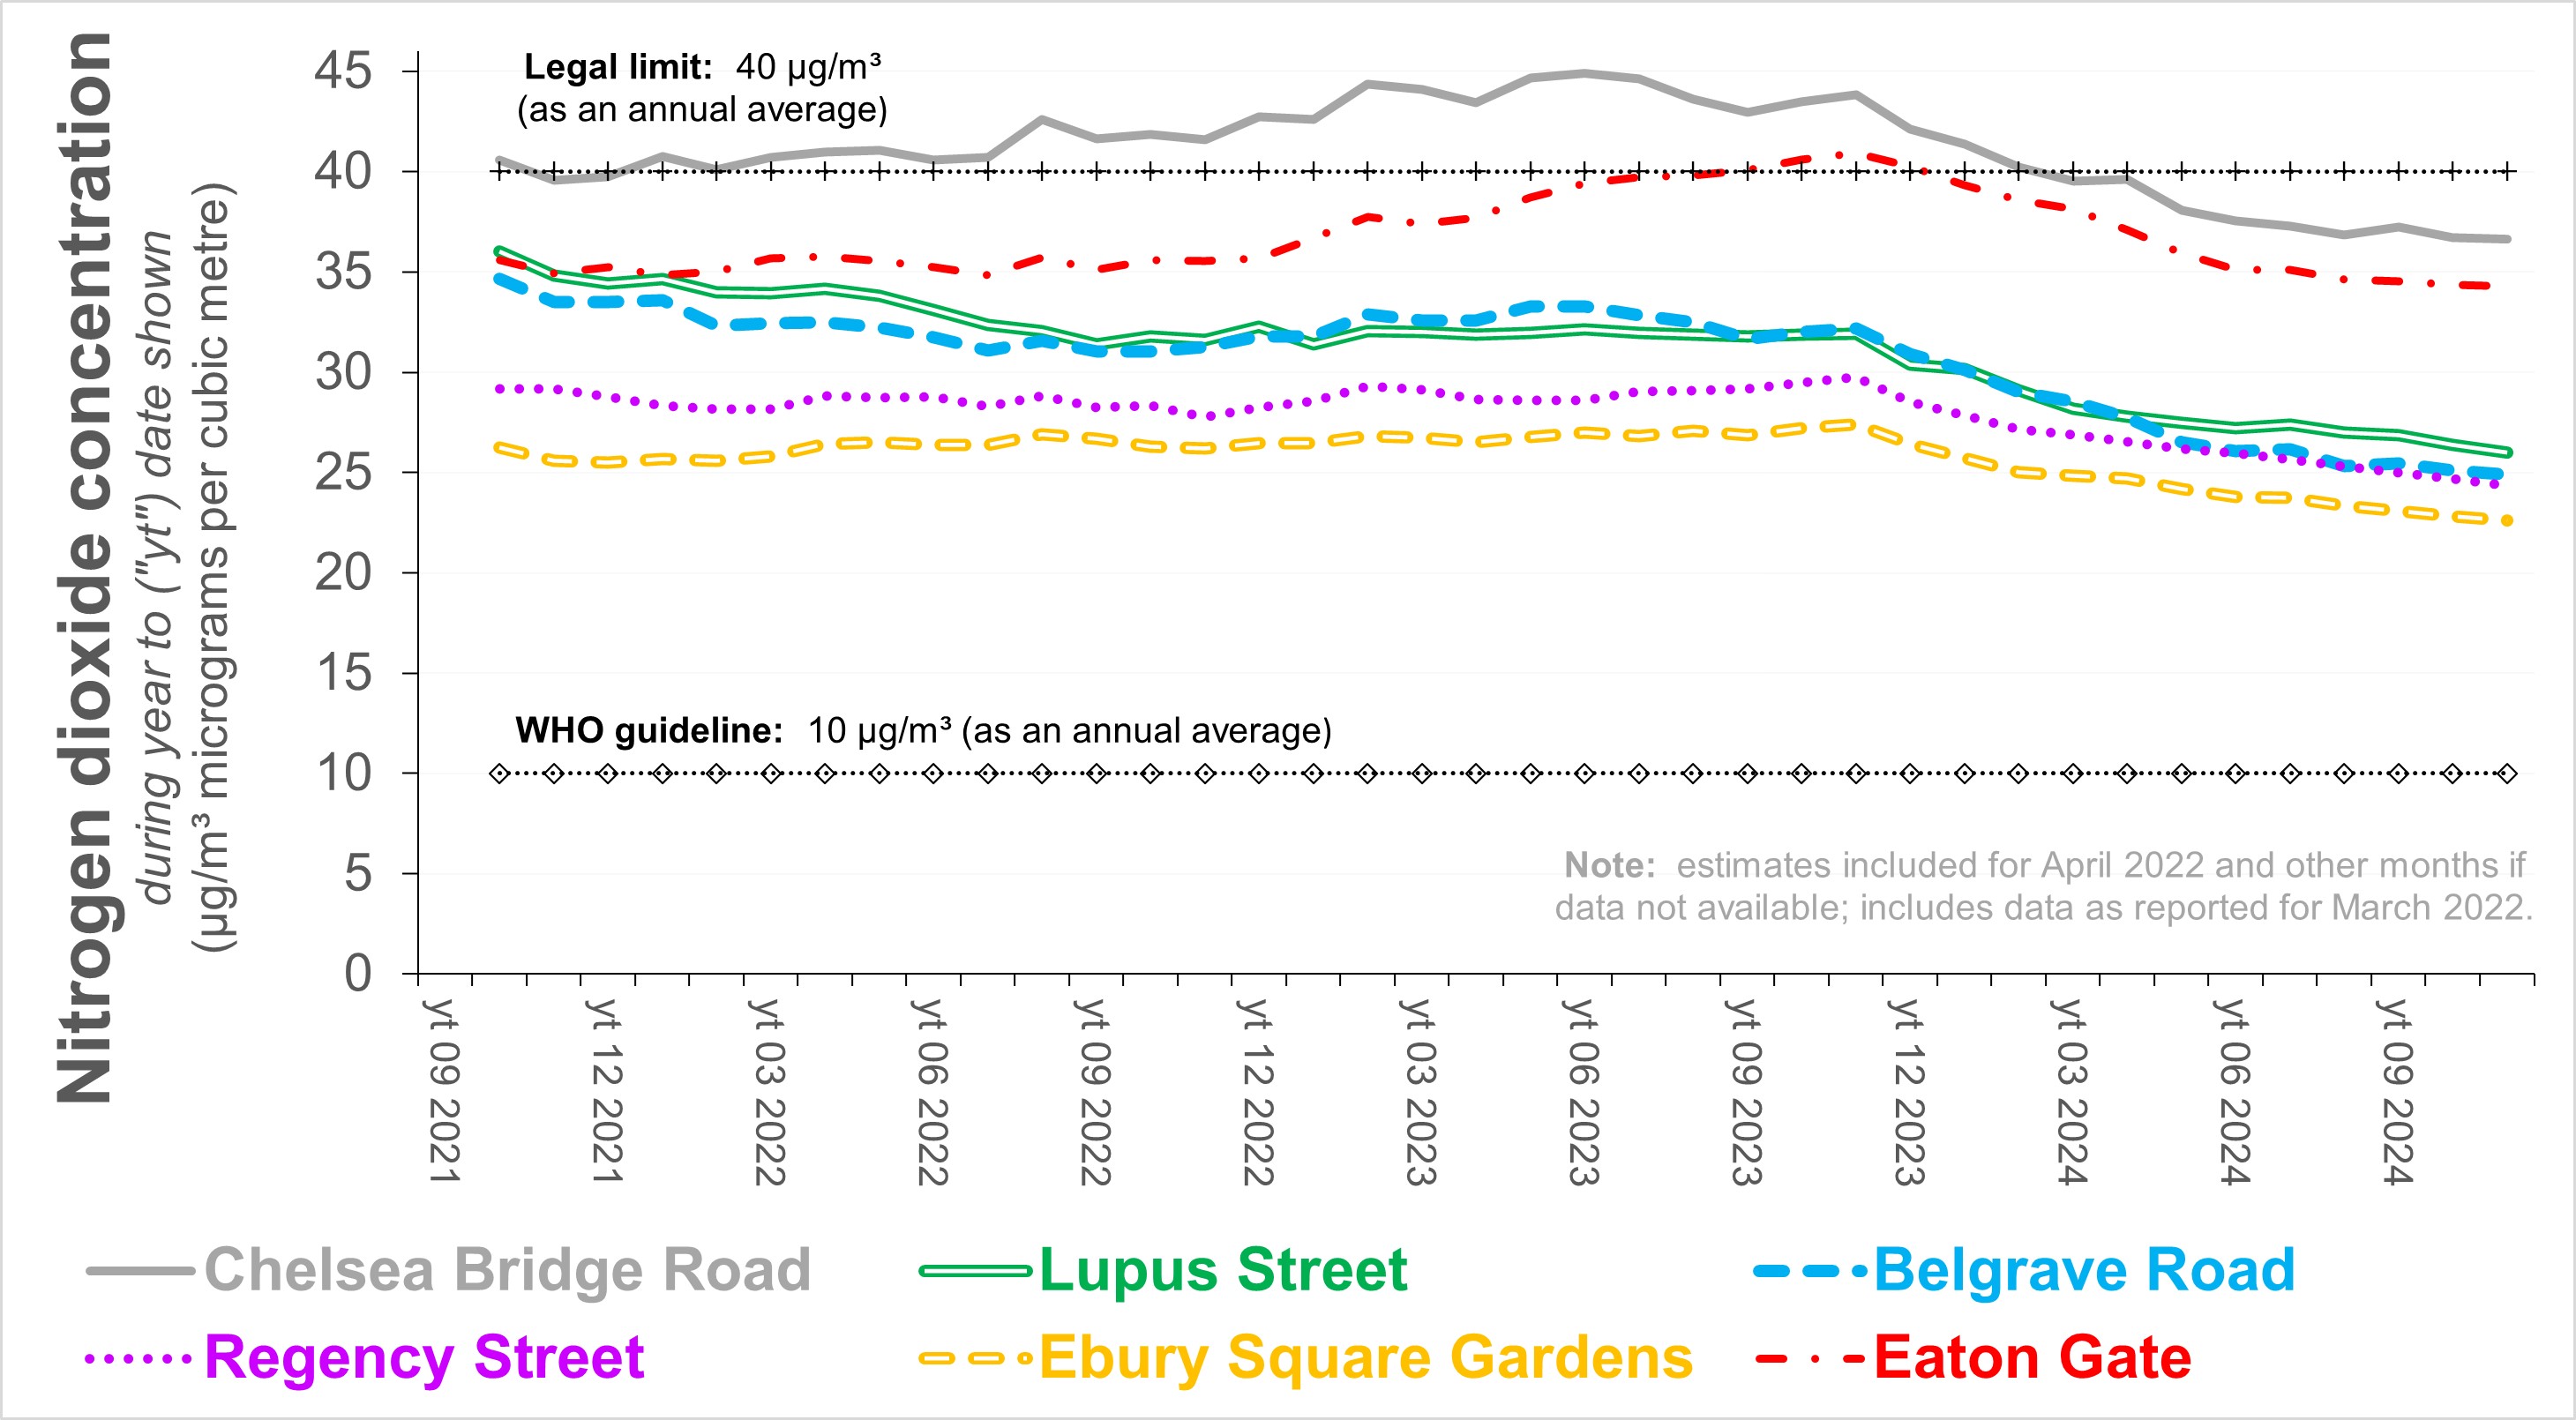
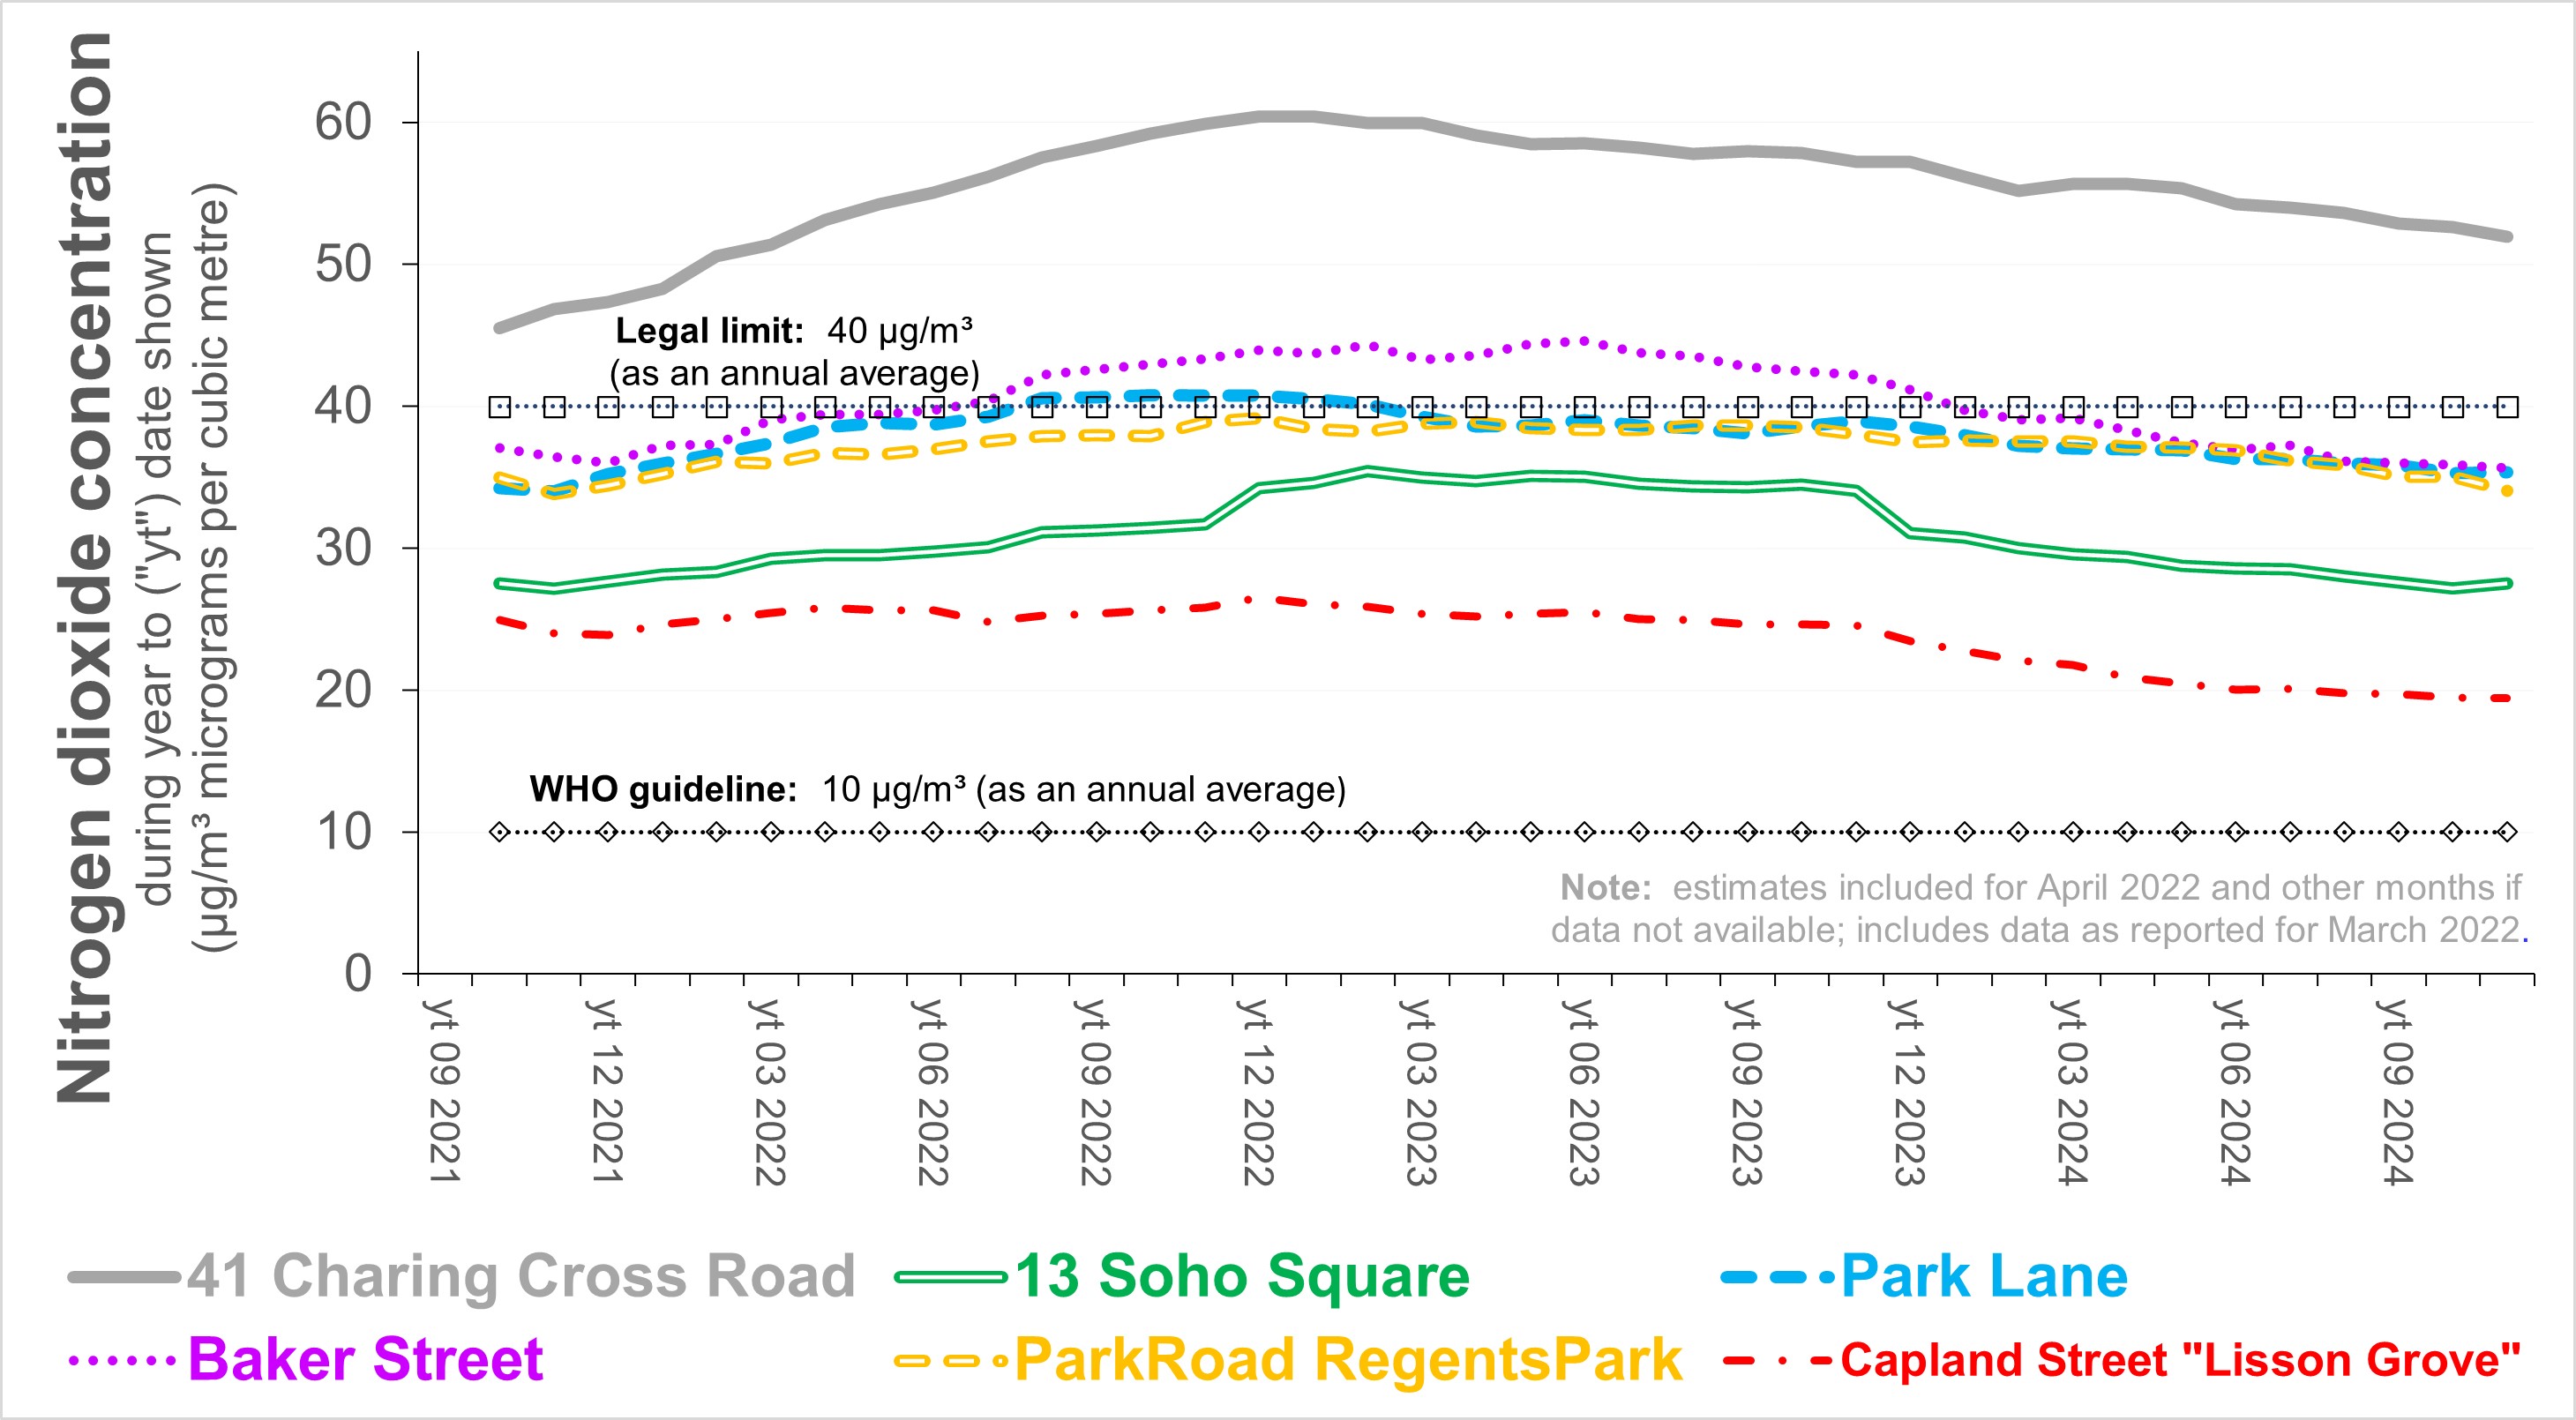
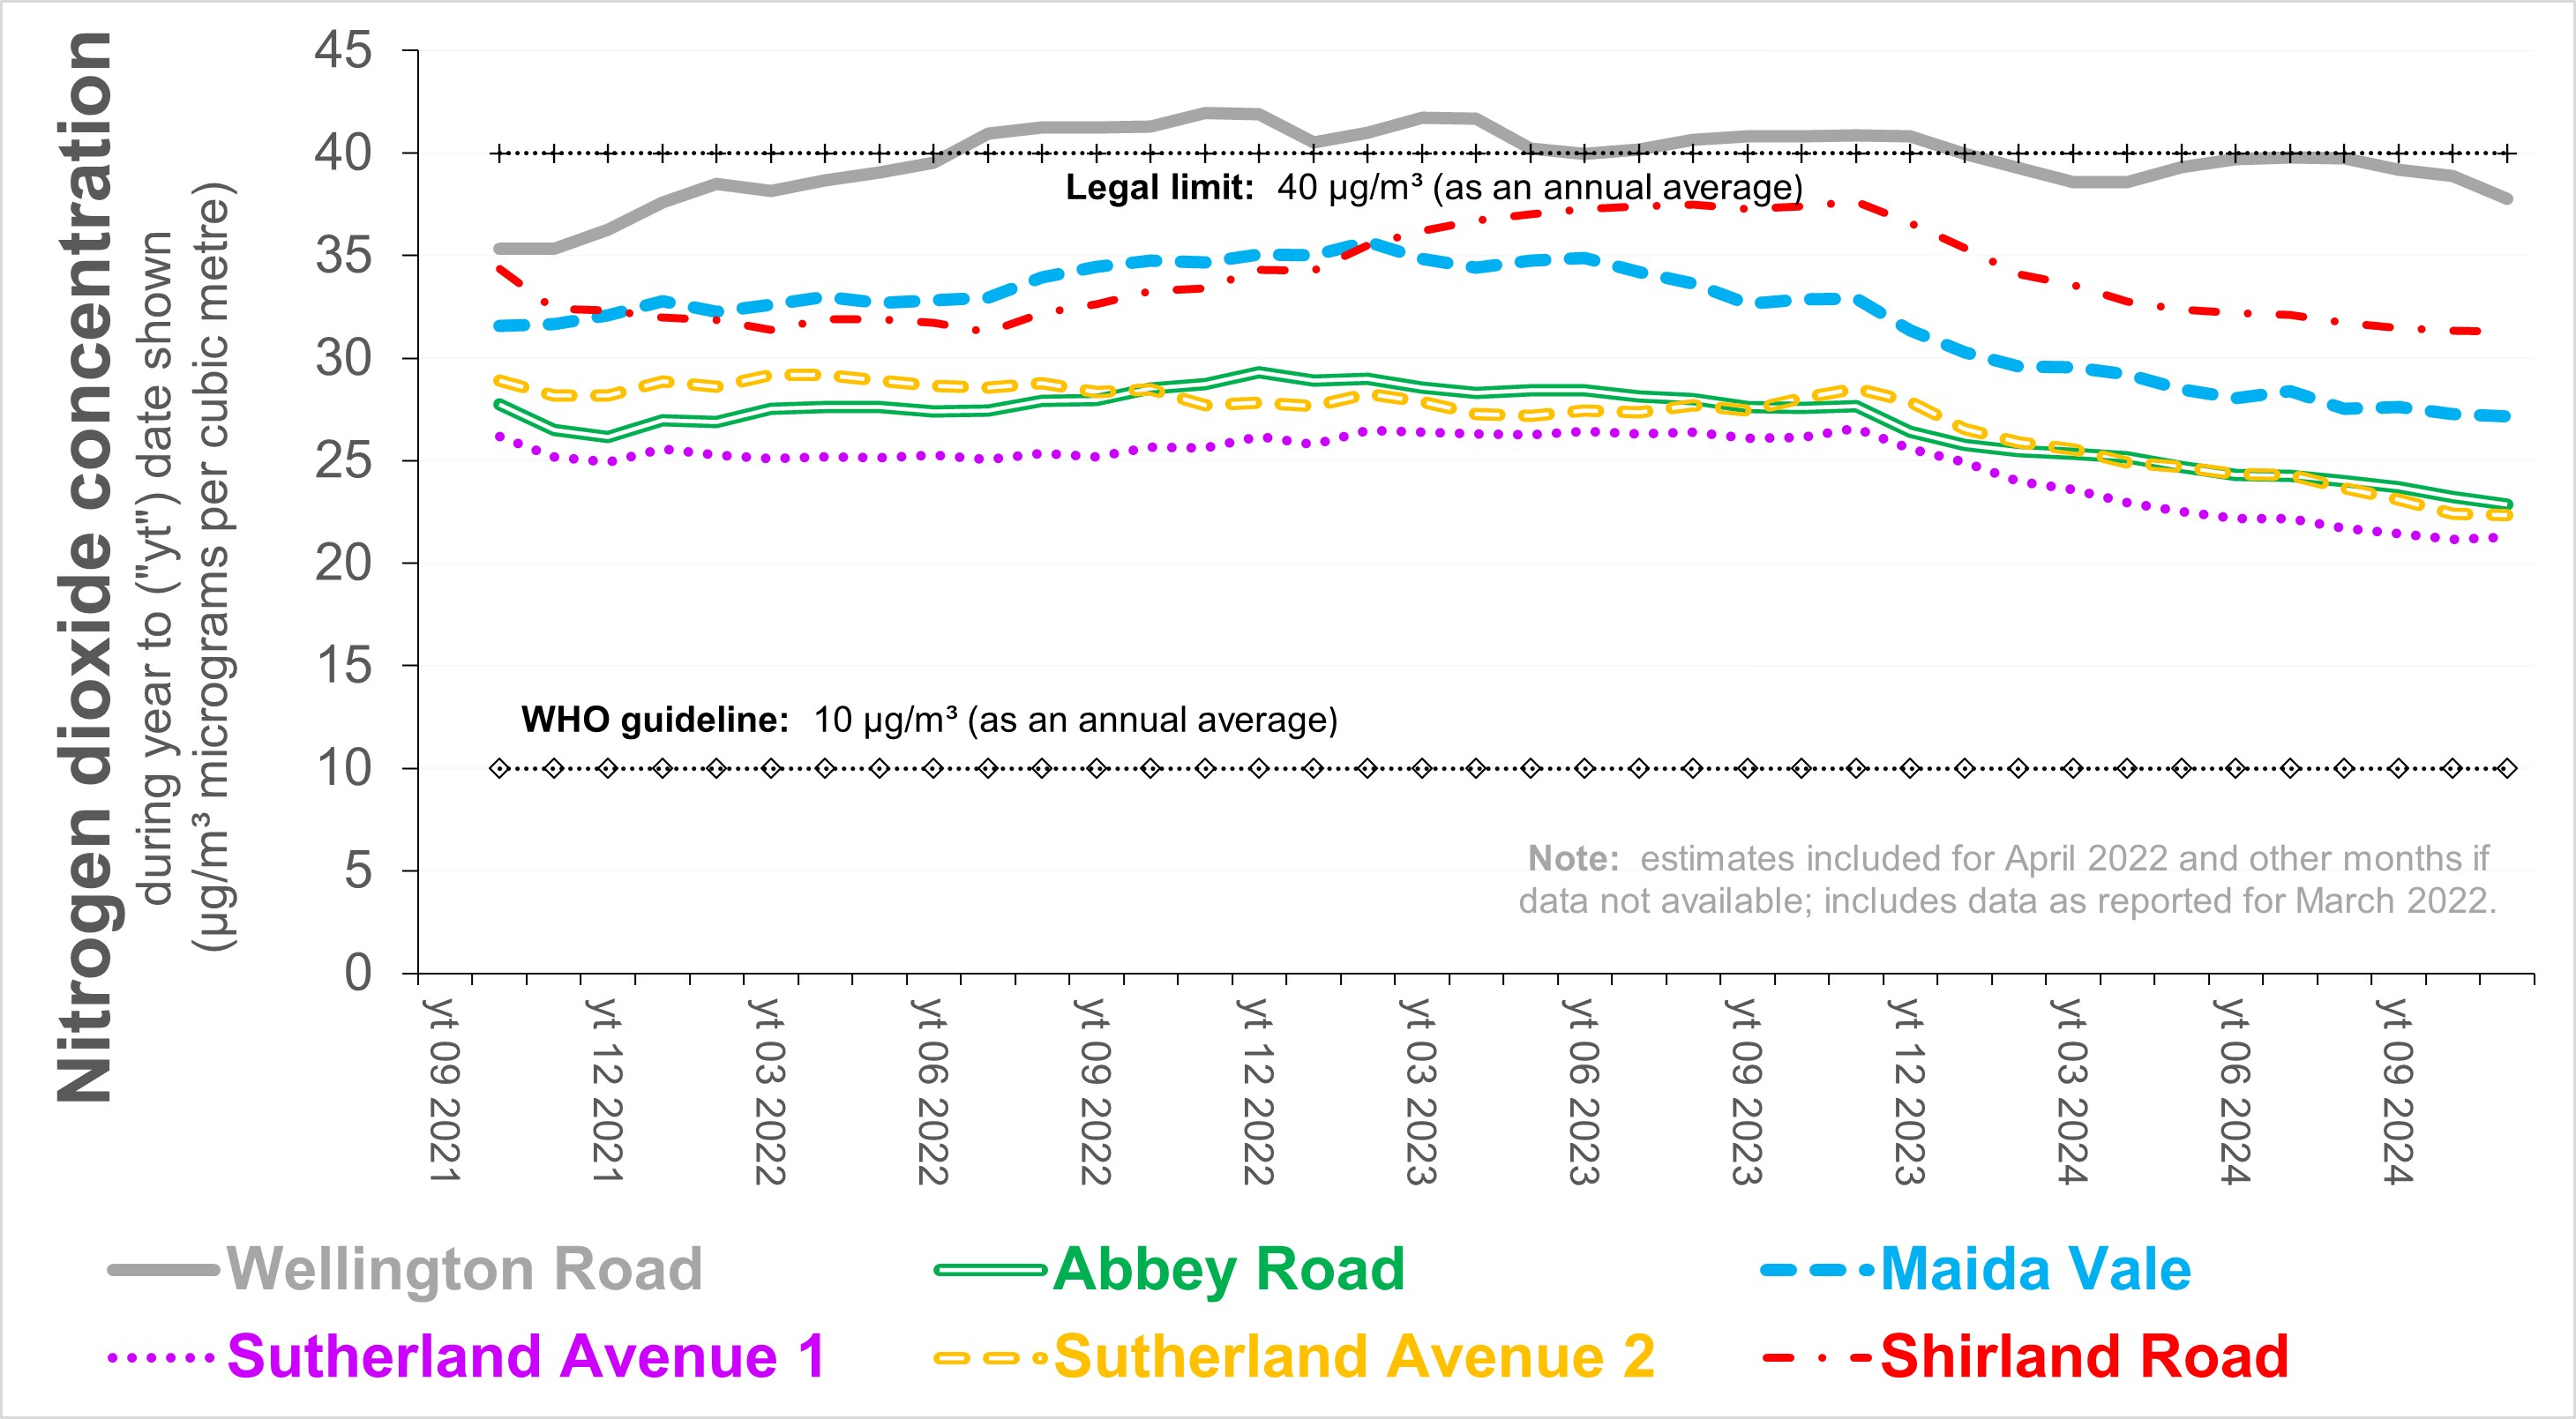
The following charts indicate trends in the monthly concentrations of NO2 at these sites
The two charts below refer to monthly concentrations of NO2 measured using diffusion tubes on behalf of Westminster City Council at sites in or neighbouring Soho between March 2024 and March 2025. The lower one also presents the monthly average concentration of NO2 as measured by the reference monitor at one of the Oxford Street sites. The average concentration reported for the refernce monitor divided by that for the diffusion tube (roughly 80%) is the amount by which the concentrations at the sites of the other diffusion tubes should be multiplied in order to correct their data for inherent bias.
|
|
For further information, please contact: info@airqualitymatters.uk |
| Back |
| Click here for index on Home Page |
