|
AIR QUALITY MATTERS |
|
Borough of Wandsworth |
"Progress in
Putney but Borough-wide Polution Persists"
|
|
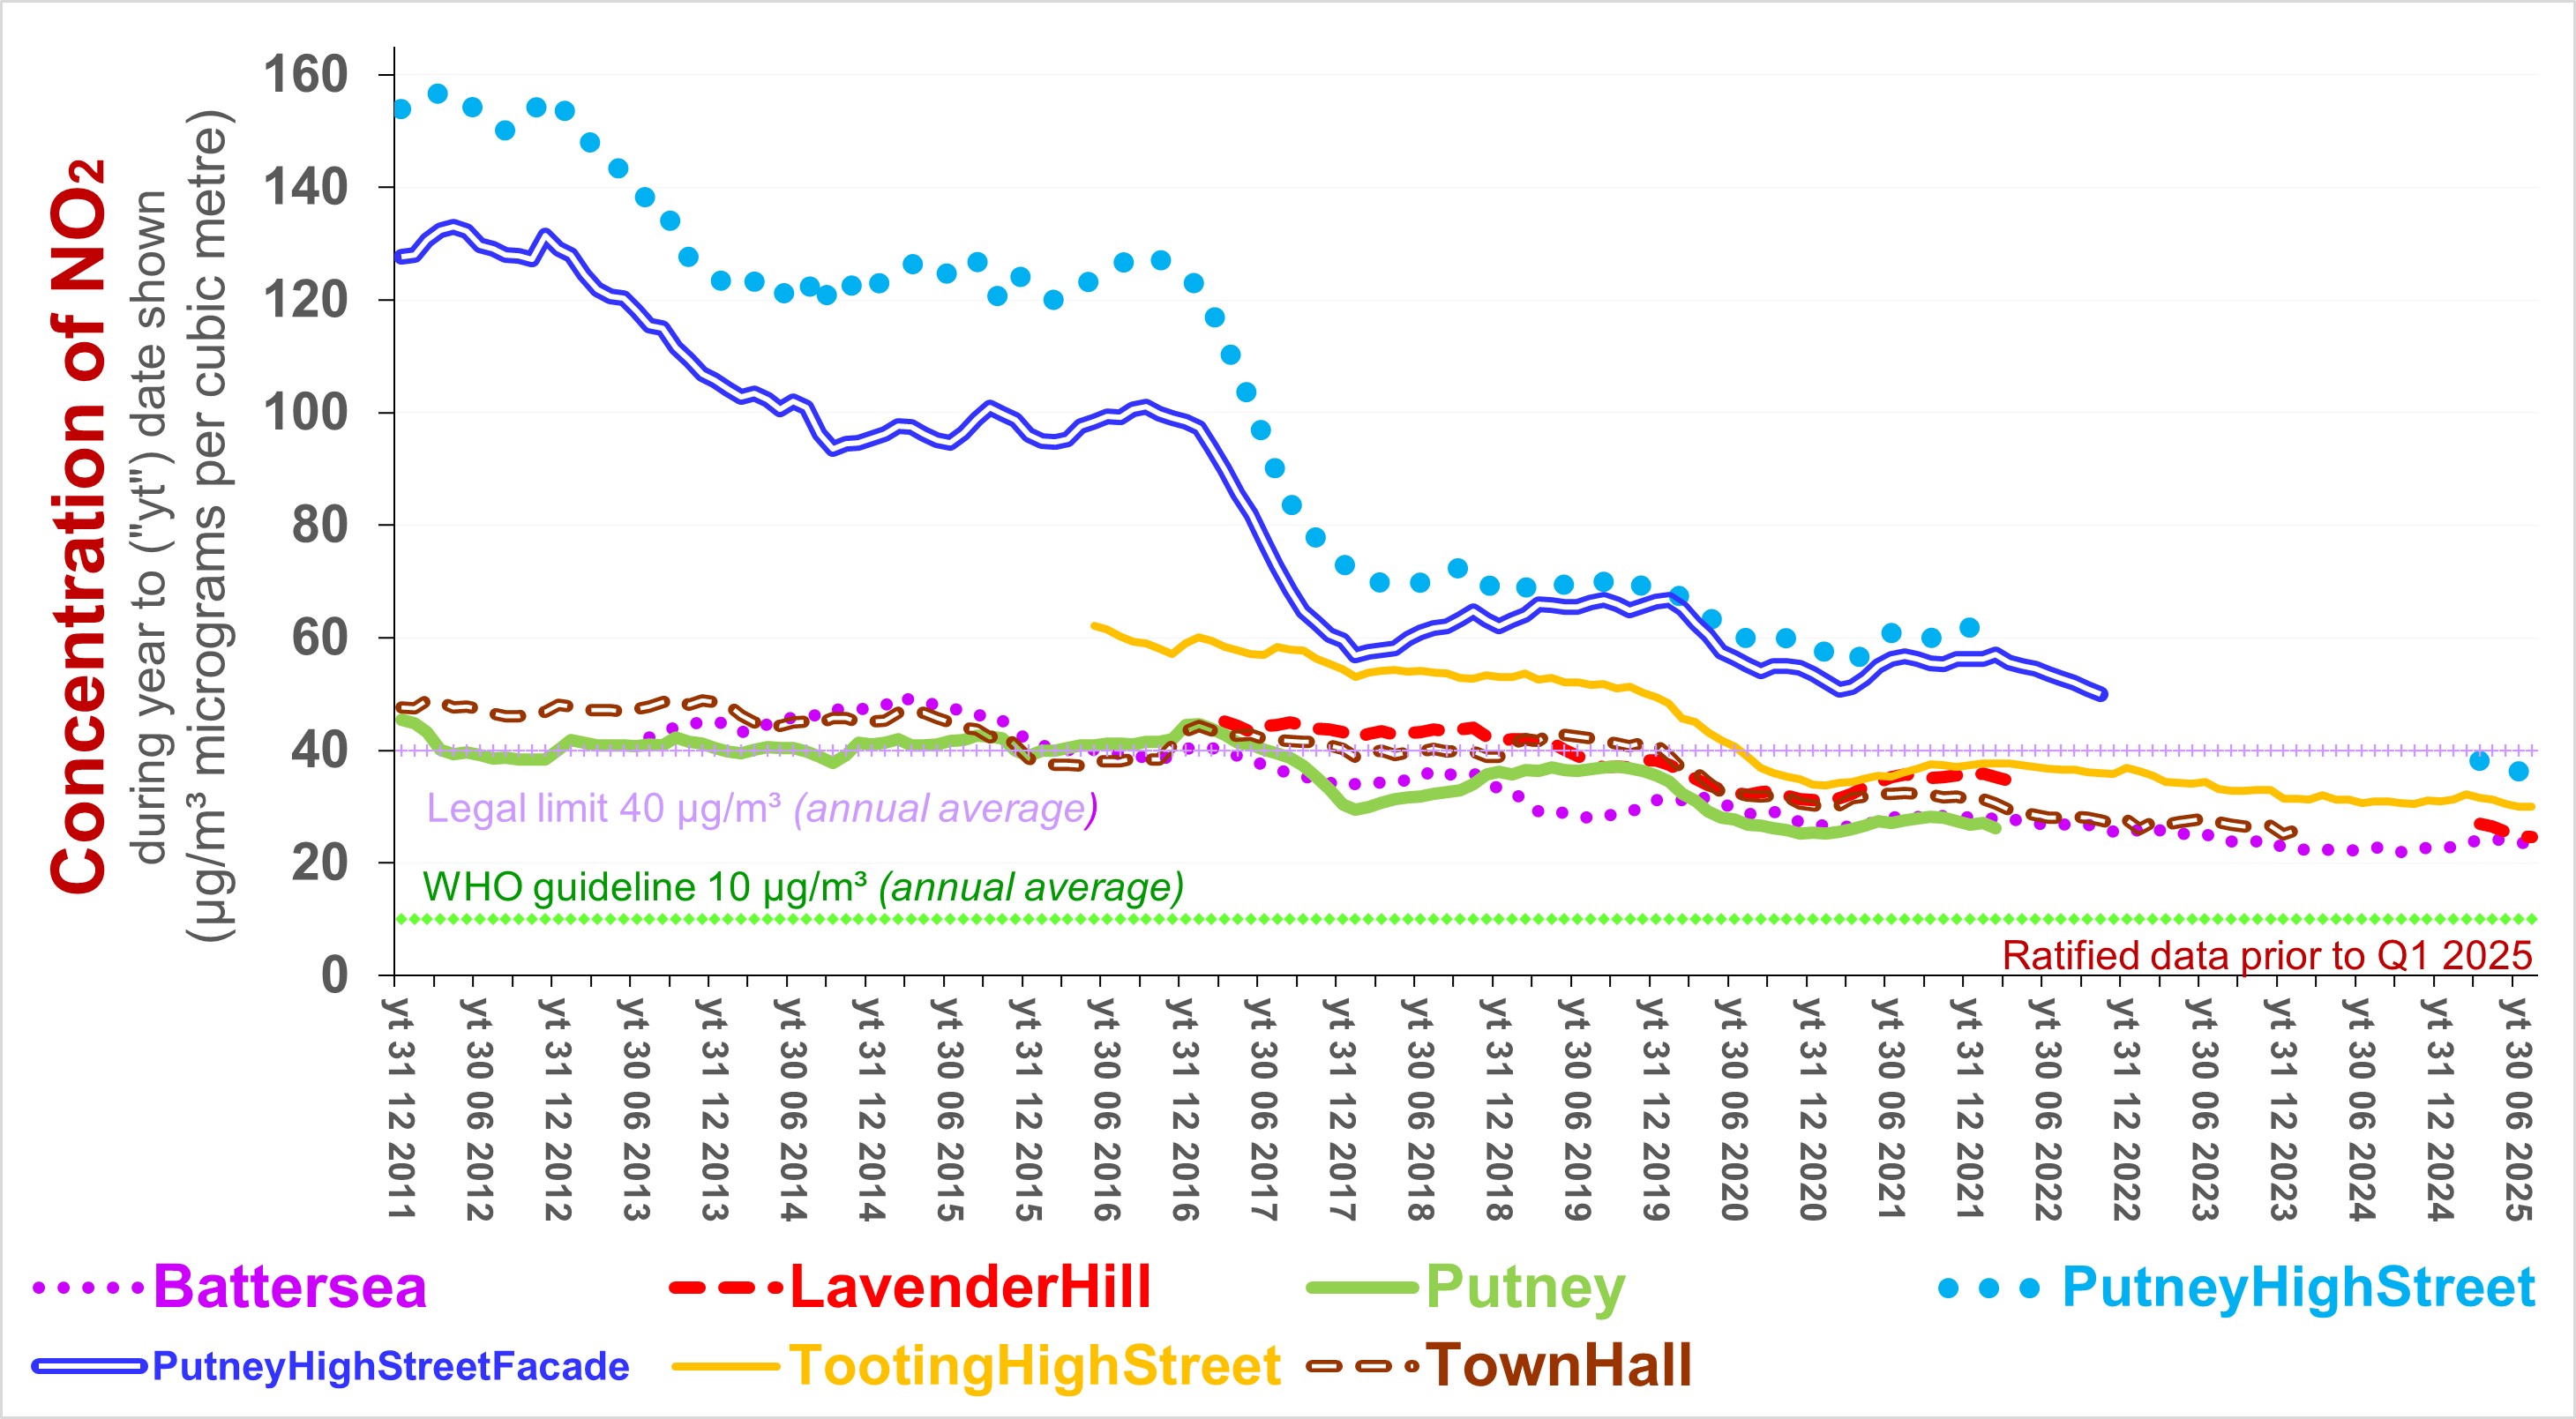
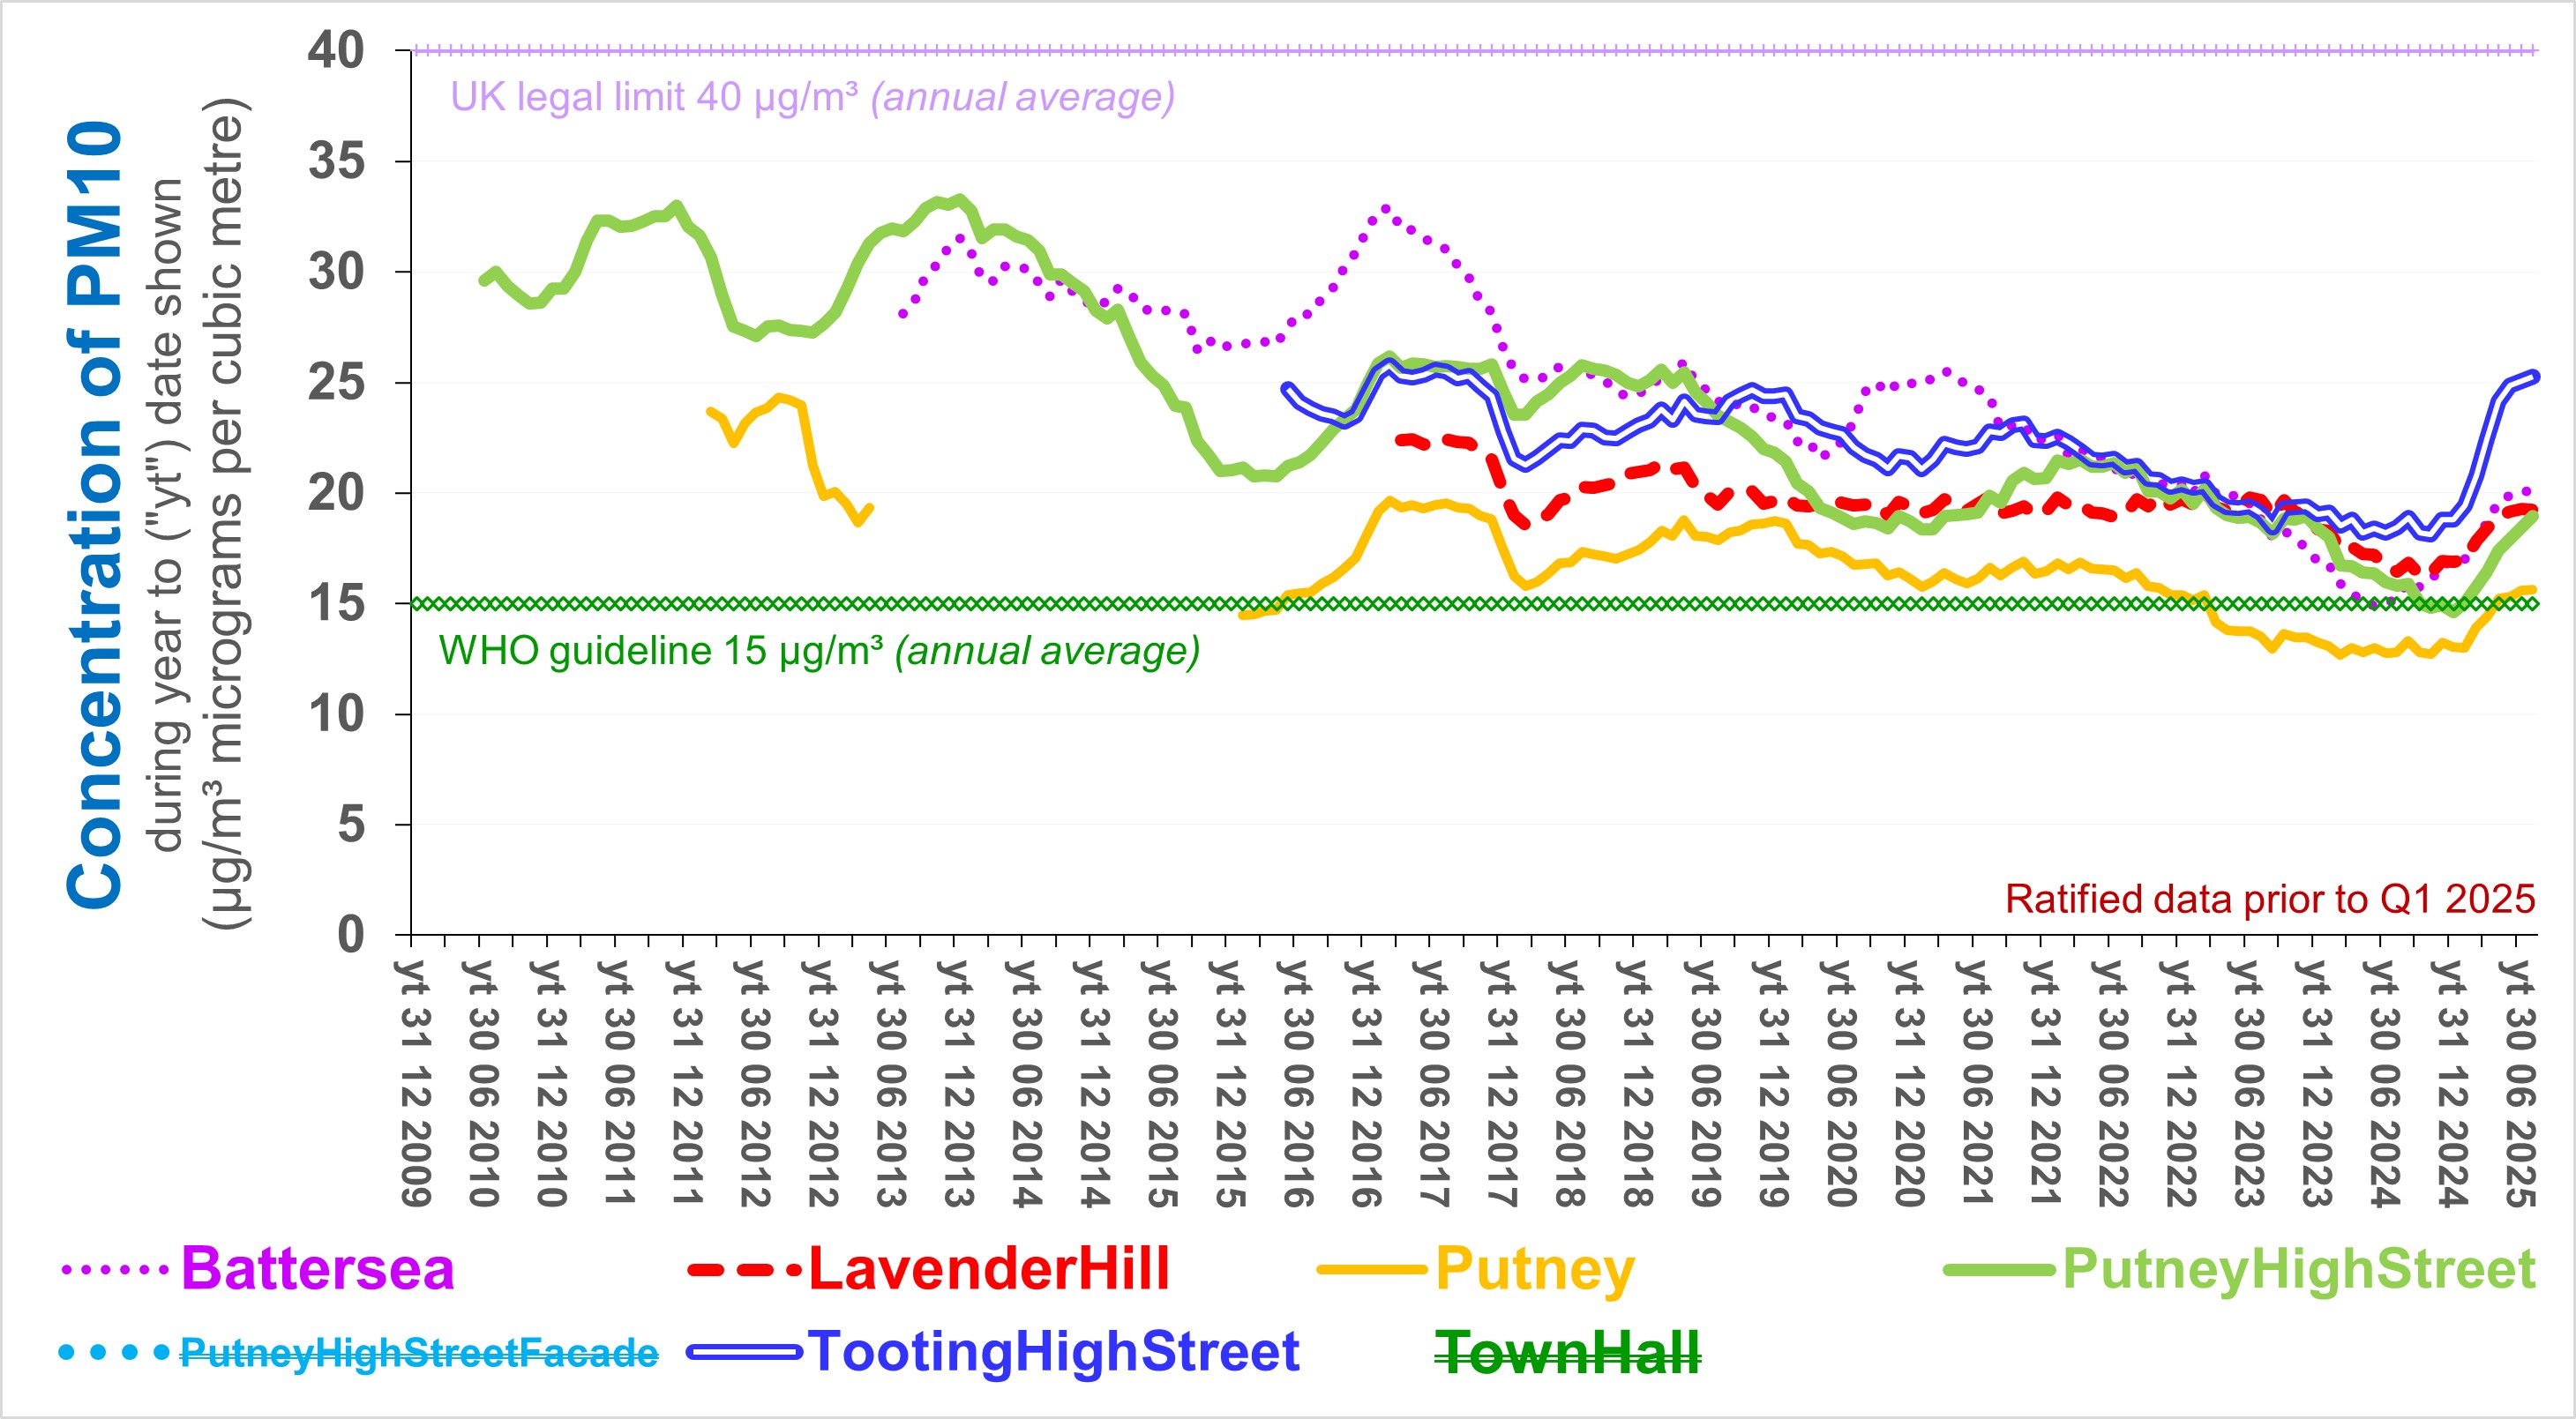
Air pollution measured by reference monitors (Necessarily, some of that data - from February 2025 - is provisional, subject to ratification. The difference between ratified and provisional data is unlikely to as much as 1% for particulate matter but might exceed 10% for NO2. Provisional NO2 data should therefore be considered with caution. The charts display the average of consecutive periods of 12 months - in order to smooth out seasonal fluctations (see chart below); and because government may regard such data as more significant that the extent to which data covering shorter time intervals. for example hourly or daily, exceed targets.)
The primary source of the NO2 has tended to be the exhaust from diesel engines but also heating and cooking (by combustion, not only of fossil fuel). The improvement at the Putney High Street site during 2017 is attributable to tighter regulation, notably in relation to emissions from buses). The main local sources of particulate matter tend to be road traffic (tyres interacting with the road surface, breaks, and the resuspension of that dust cause by the motion of vehicles), construction (especially demolition), wood fires, and some cooking. Sources blown into the borough by the wind tend to contribute more to the concentration of particulate matter than NO2. Those sources include agriculture, industry, dust, and fire. Trends are likely to be influenced by the increasing frequency and severity of meteorological conditions (/the weather) attributable to the collapsing global climate. Concentrations of NO2 are currently within the UK target but more than double World Health Organisation ("WHO") guideline. For PM10, concentrations currently exceed the WHO guideline. Unlike WHO guidelines (revised in 2021), UK targets do not reflect the last couple of decades of peer reviewed research.
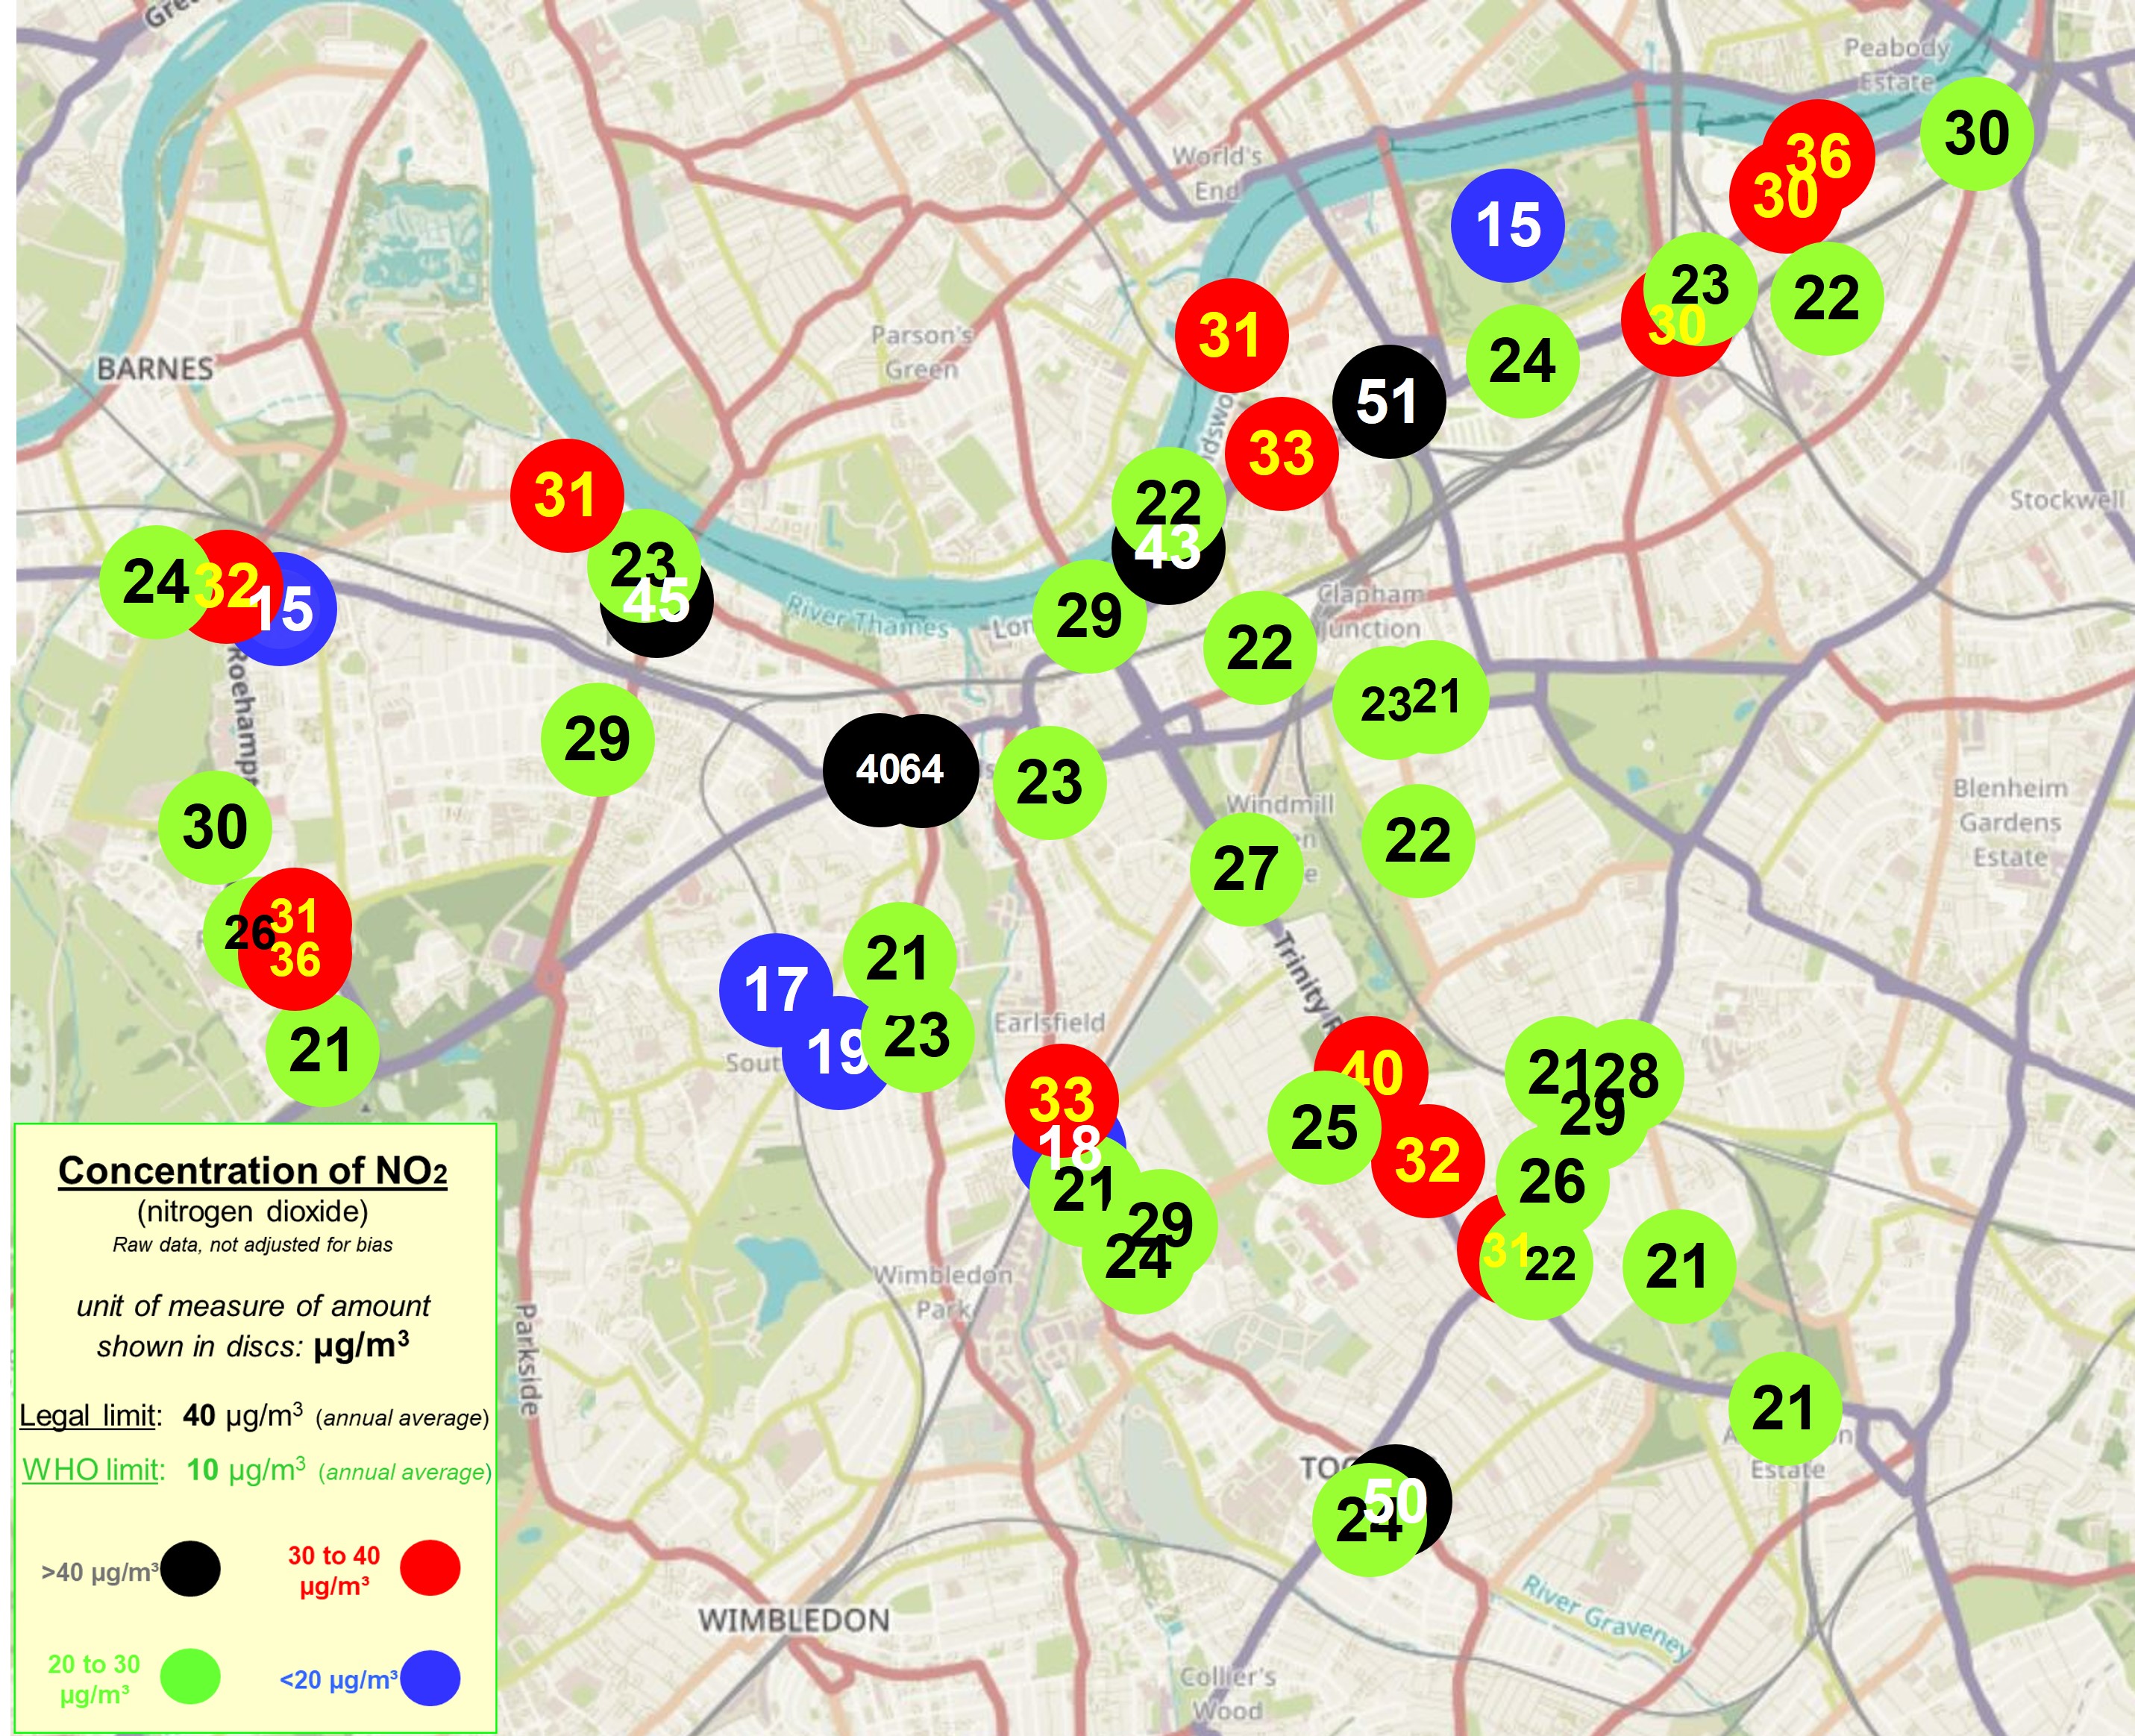
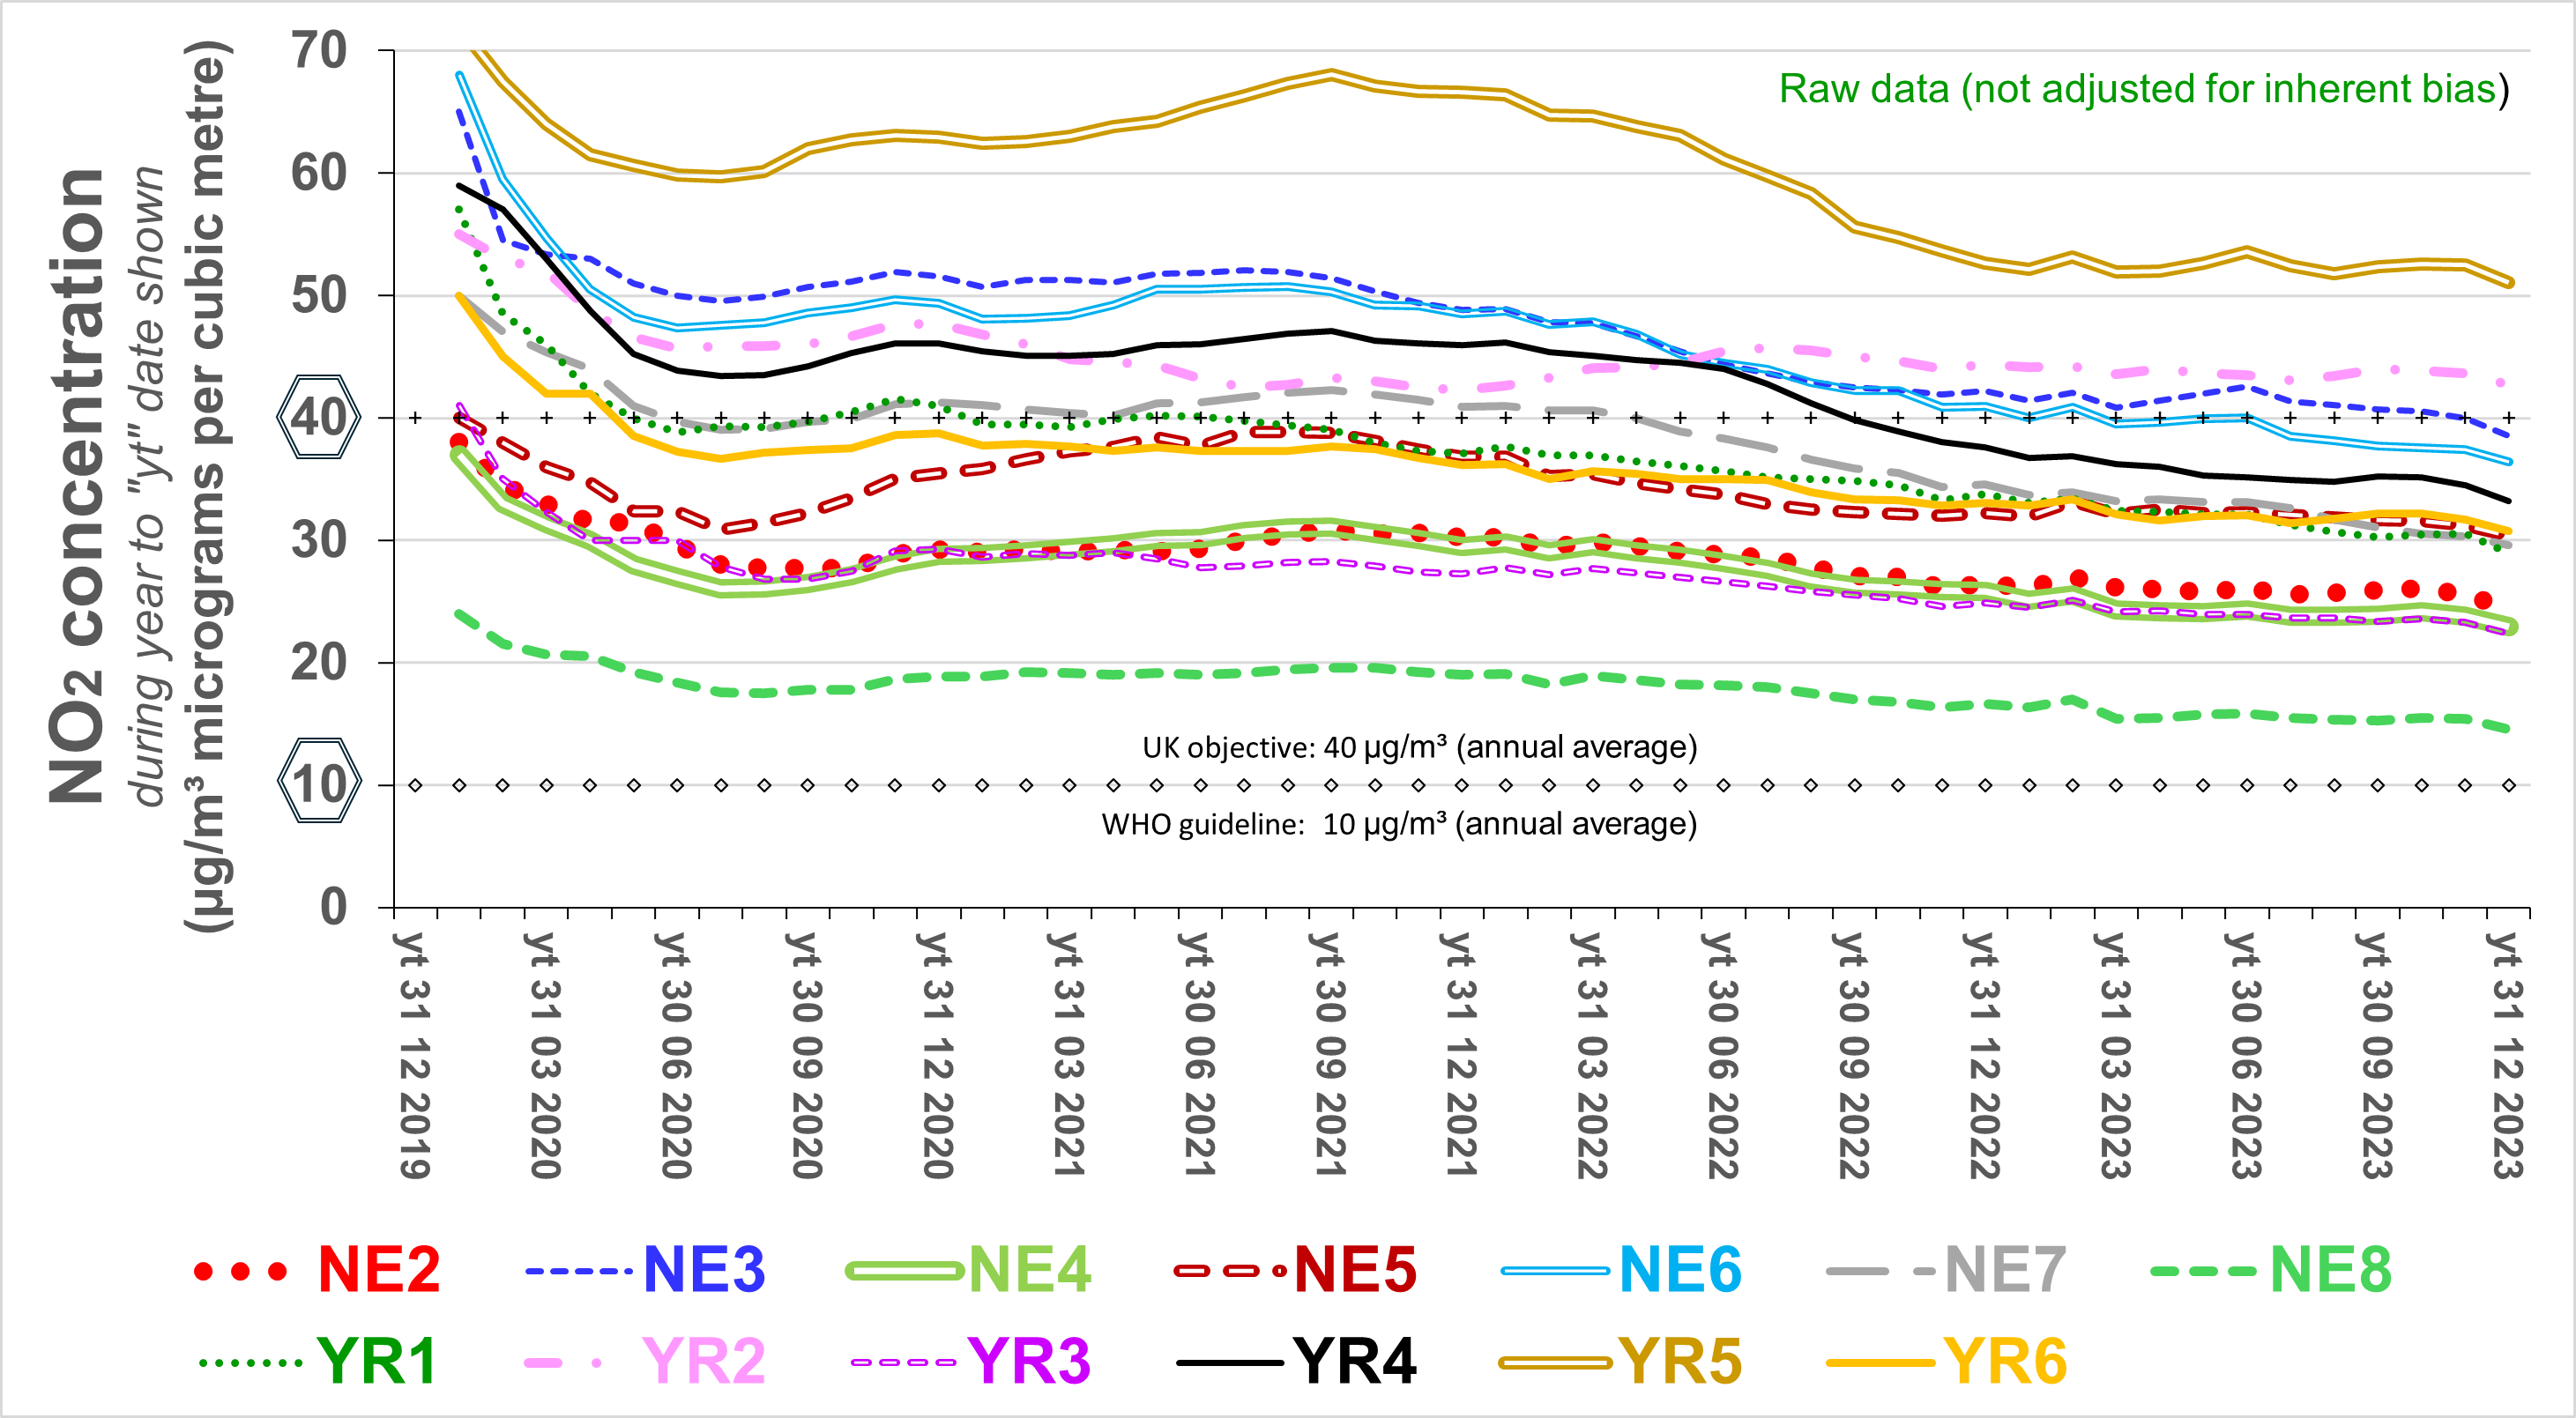
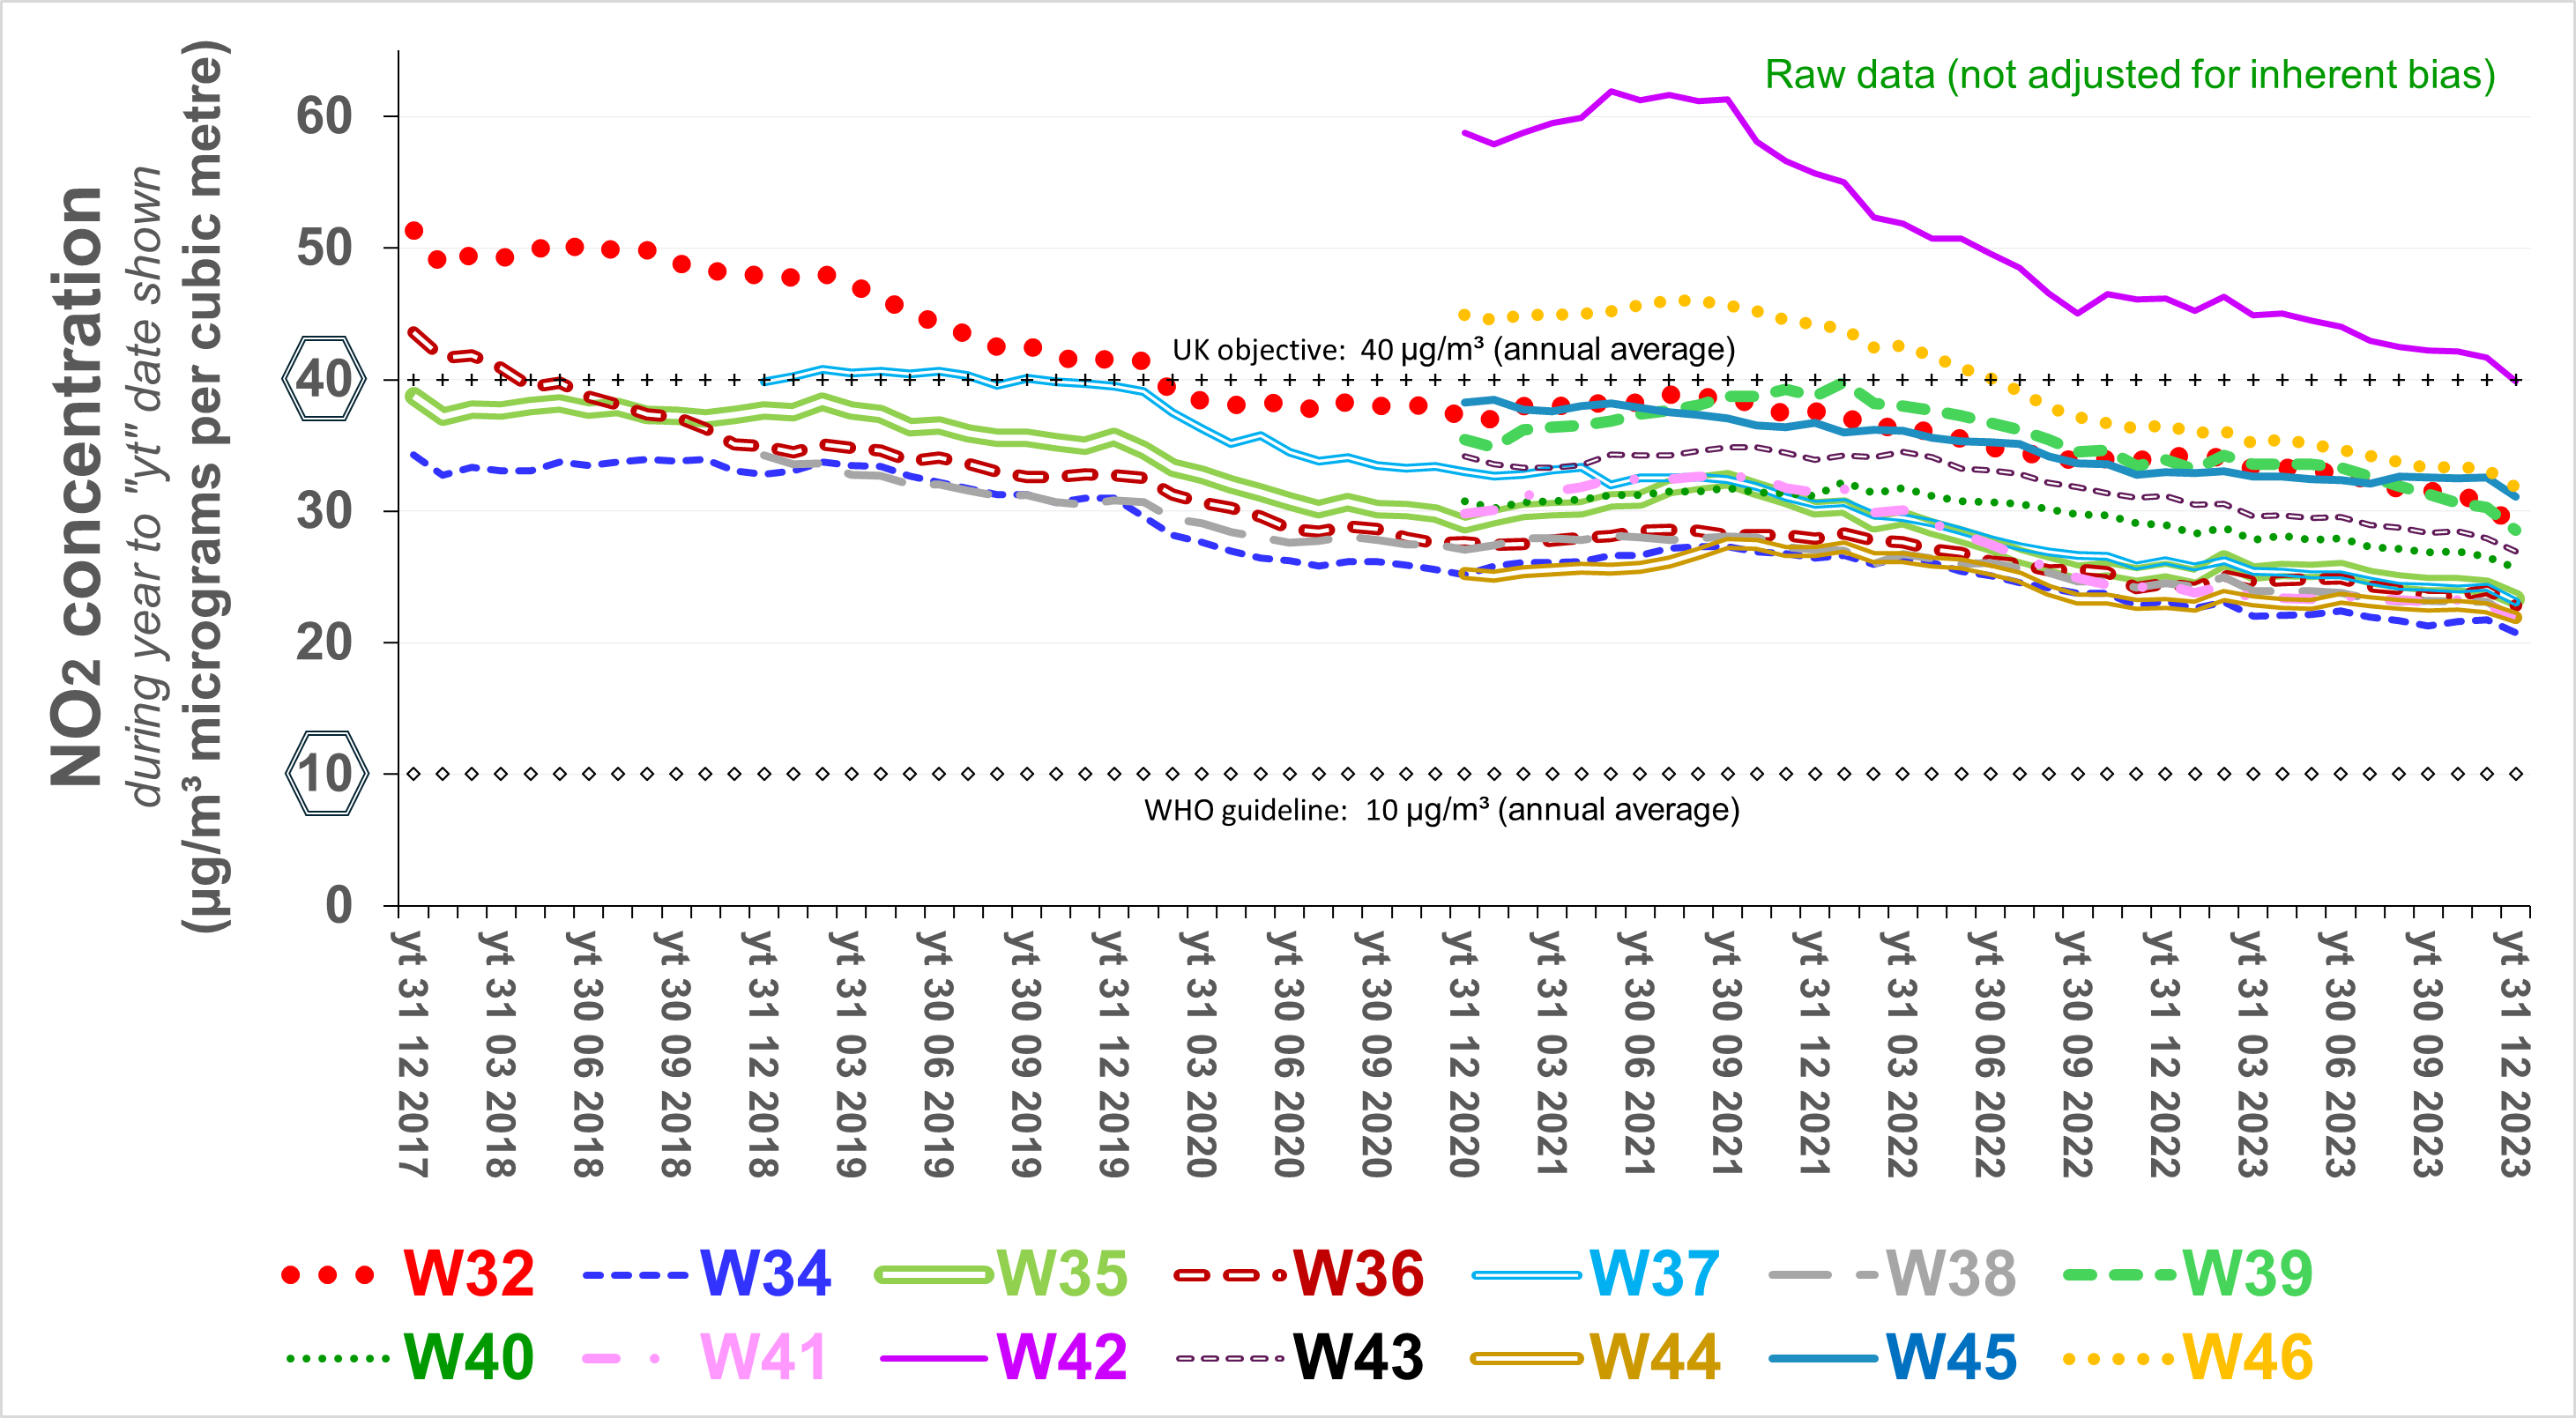
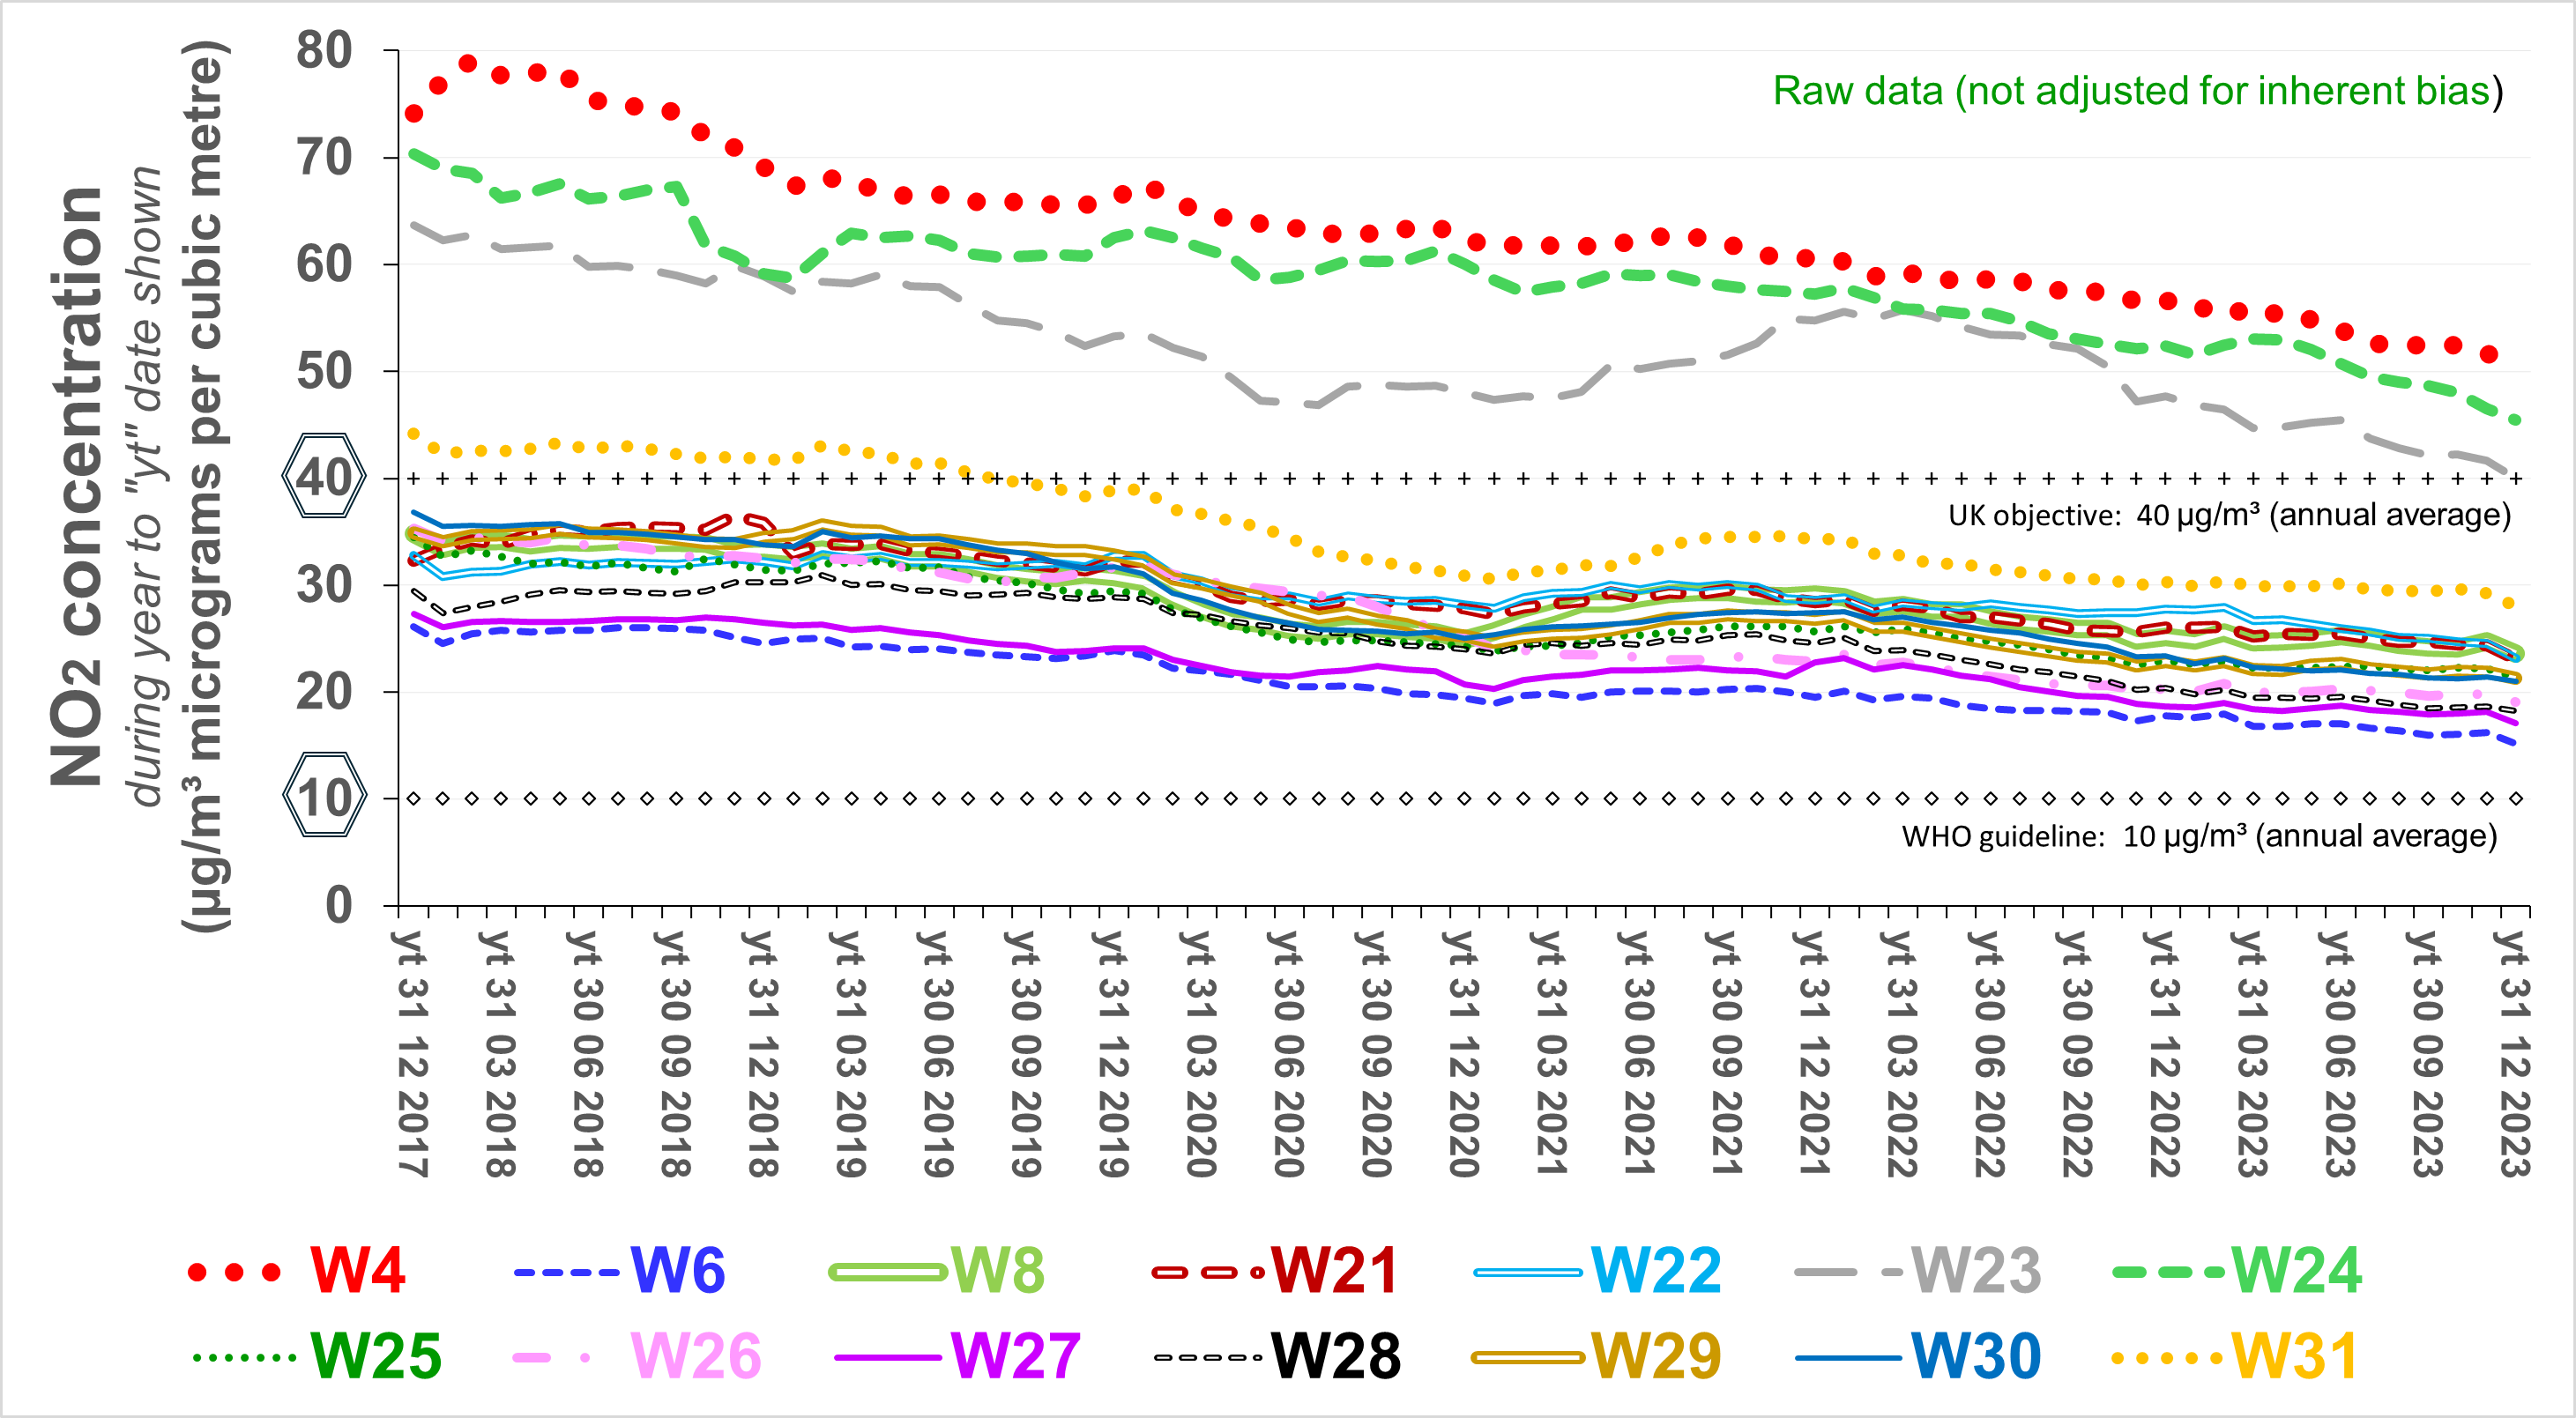
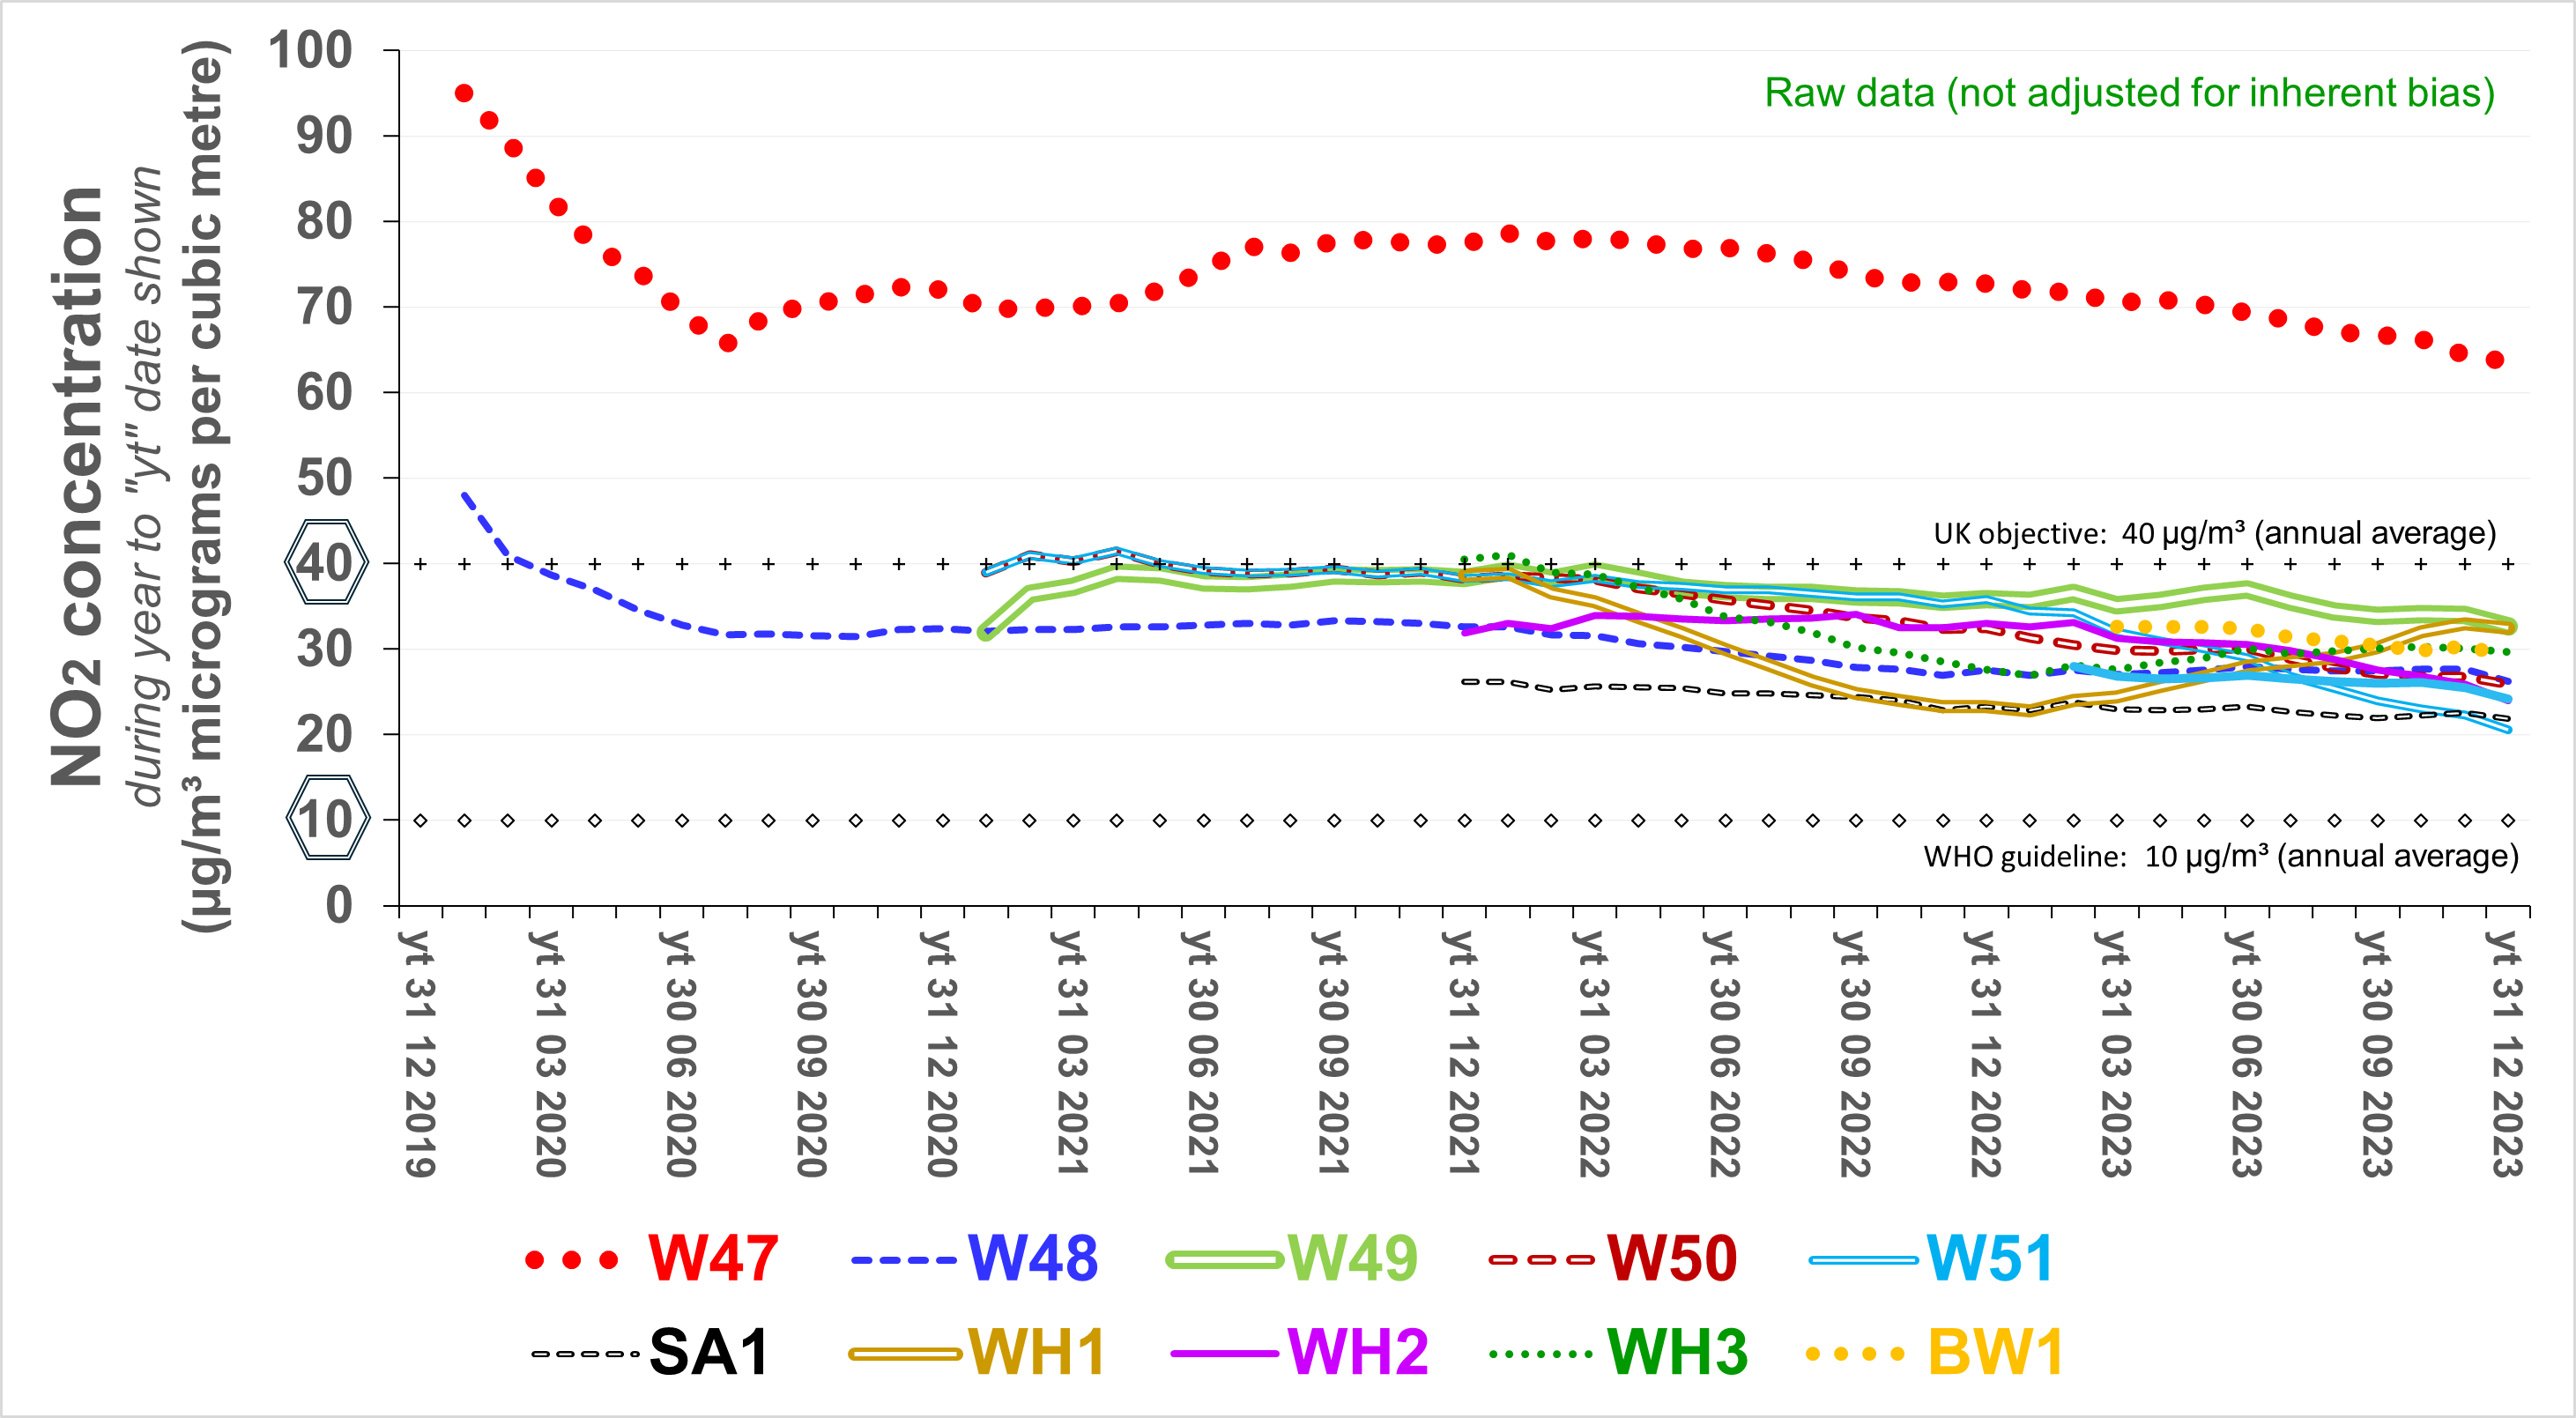
Diffusion tubes The uppermost chart maps annual averages for 2023. It illustrates the considerable difference in concentrations - attributble primarily to the flow of road traffic - between sites a short distance away from each other. The lower four charts indicate that, at the end of 2023, concentrations were similar to what they were during the first covid-19 lock-down and exceeded the UK objective at about four sites, namely: 256 Batterse Park Road, 50 Bickley Street, Putney High Street, and West Hill. Concentrations are lowest at the site in Battersea Park.
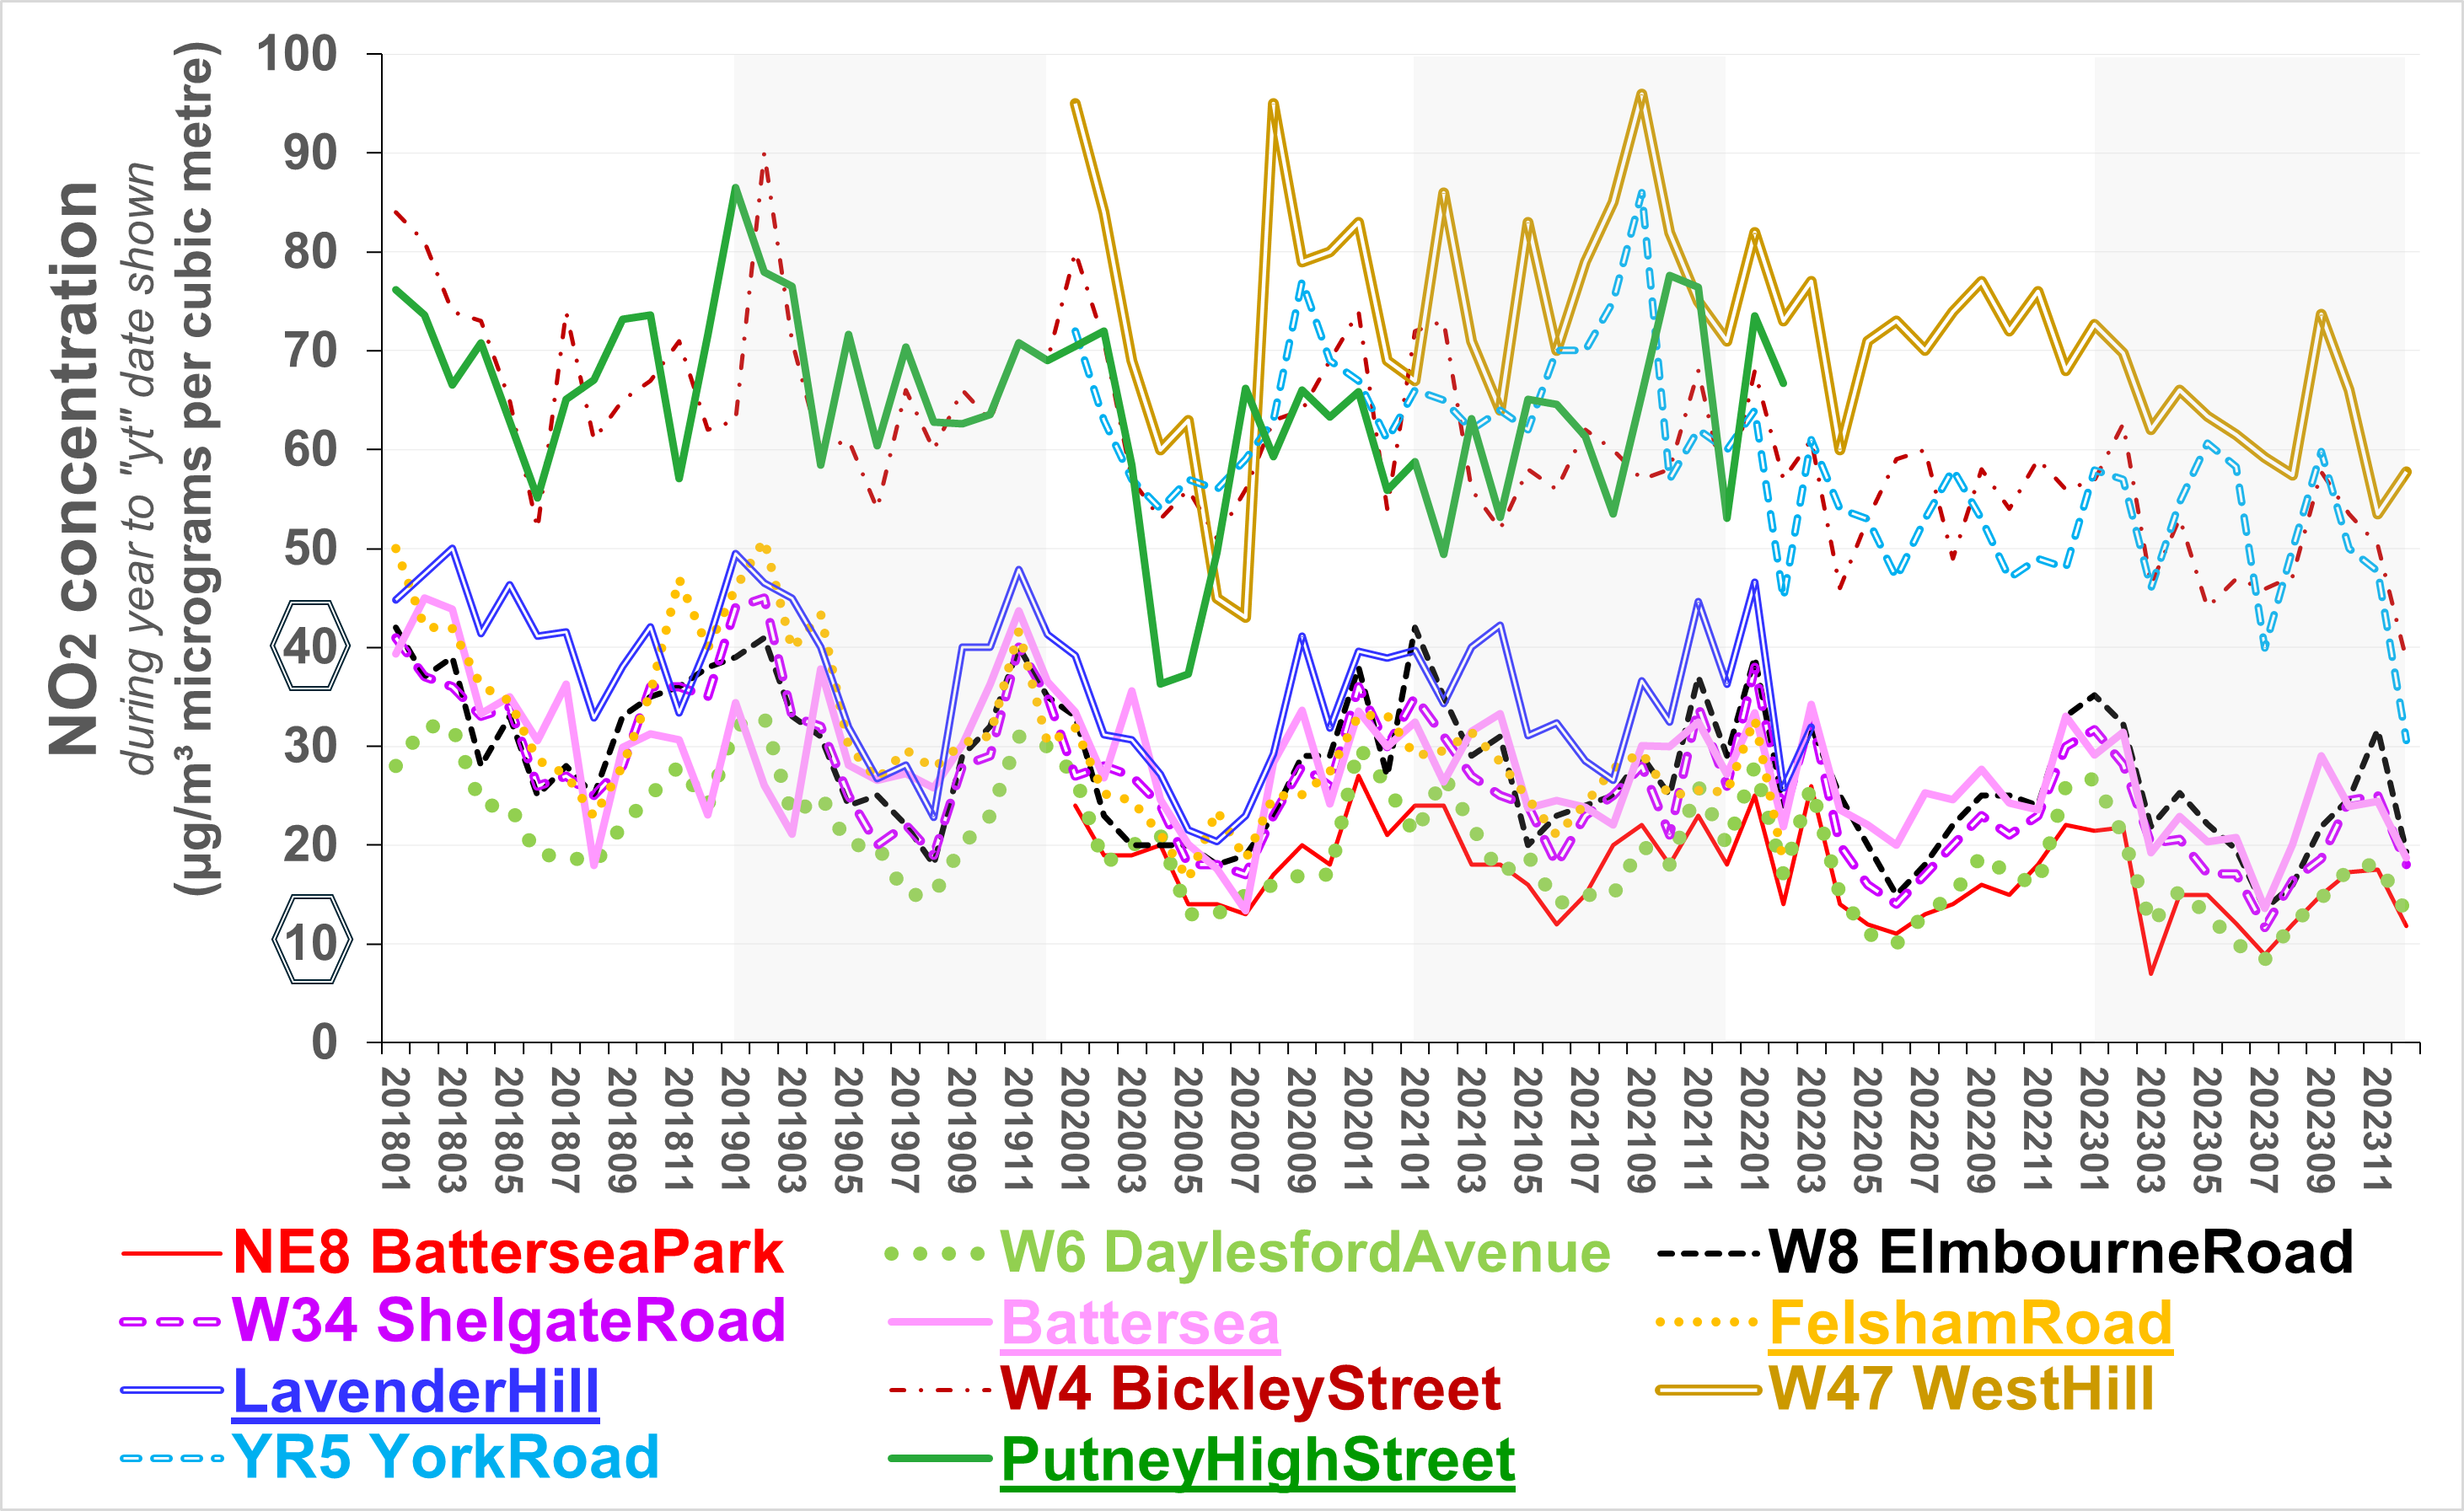
Seasonal variation at heavily trafficked and background locations
Despite being close to heavily trafficked roads, concentrations at the Batterssea, Felsham Road and Lavender Hill reference monitor sites are similar to those where concentraions are lowest. This reflects that NO2 concentrations decline rapidly with distance away from hotspots. Concentrations at the rear of buildings adjacent hotspots will also tend to be lower than in the front. Concentrations inside vehicles on busy roads are much greater than when eating or drinking "al fresco" at the roadside. The owners of those cafes might generate more business (GDP) by successful advocacy for clean air. Jogging along busy roads likewise tends to maximise one's exposure to air pollution (but the benefits from physical exercise may more than compensate for the harm caused by the pollution) Concentrations vary vertically. Adjacent busy roads, they are likely to be greatest near the height of children in buggies. (Horizontally, if the measurement - for NO2 - is made 0.5m away from the kerb and the concentration measured is 35 while that in the background locally is 15, then the concentration in a vehicle being driven on the road is likely to be 40. It would be 30 two long paces further away, and 25 six metres beyond that.)
As one might expect, concentrations of NO2 tend to be greater during working weekdays than at weekends and
public holidays. There is little difference for particulate matter.
Concentrations vary diurnally (by hour of the day). For NO2,
tending to decline steeply during the early hours, rising from
about 6am until 8am, decling somewhat until mid-day, before rising
gradually until late. The best time of day for vigorous
physical exercise would therefore seem to be lunchtime - but, as
concentrations of NO2 decrease, concentrations of ground-level
ozone tend to rise. In urban settings, they peak during the
early afternoon. The rise and fall during the morning
is prominent in urban settings during the working week -
reflecting rush hour traffic. The peak in morning
concentrations tends to occur before the "school run".
Concentrations of particlate matter vary less and do not
neccessarily follow the same diurnal pattern as those of NO2.
|
|
For further information, please contact: info@airqualitymatters.uk |
| Back |
