|
AIR QUALITY MATTERS |
|
Borough of Sutton |
"NO2 beyond the
South Circular"
|
|
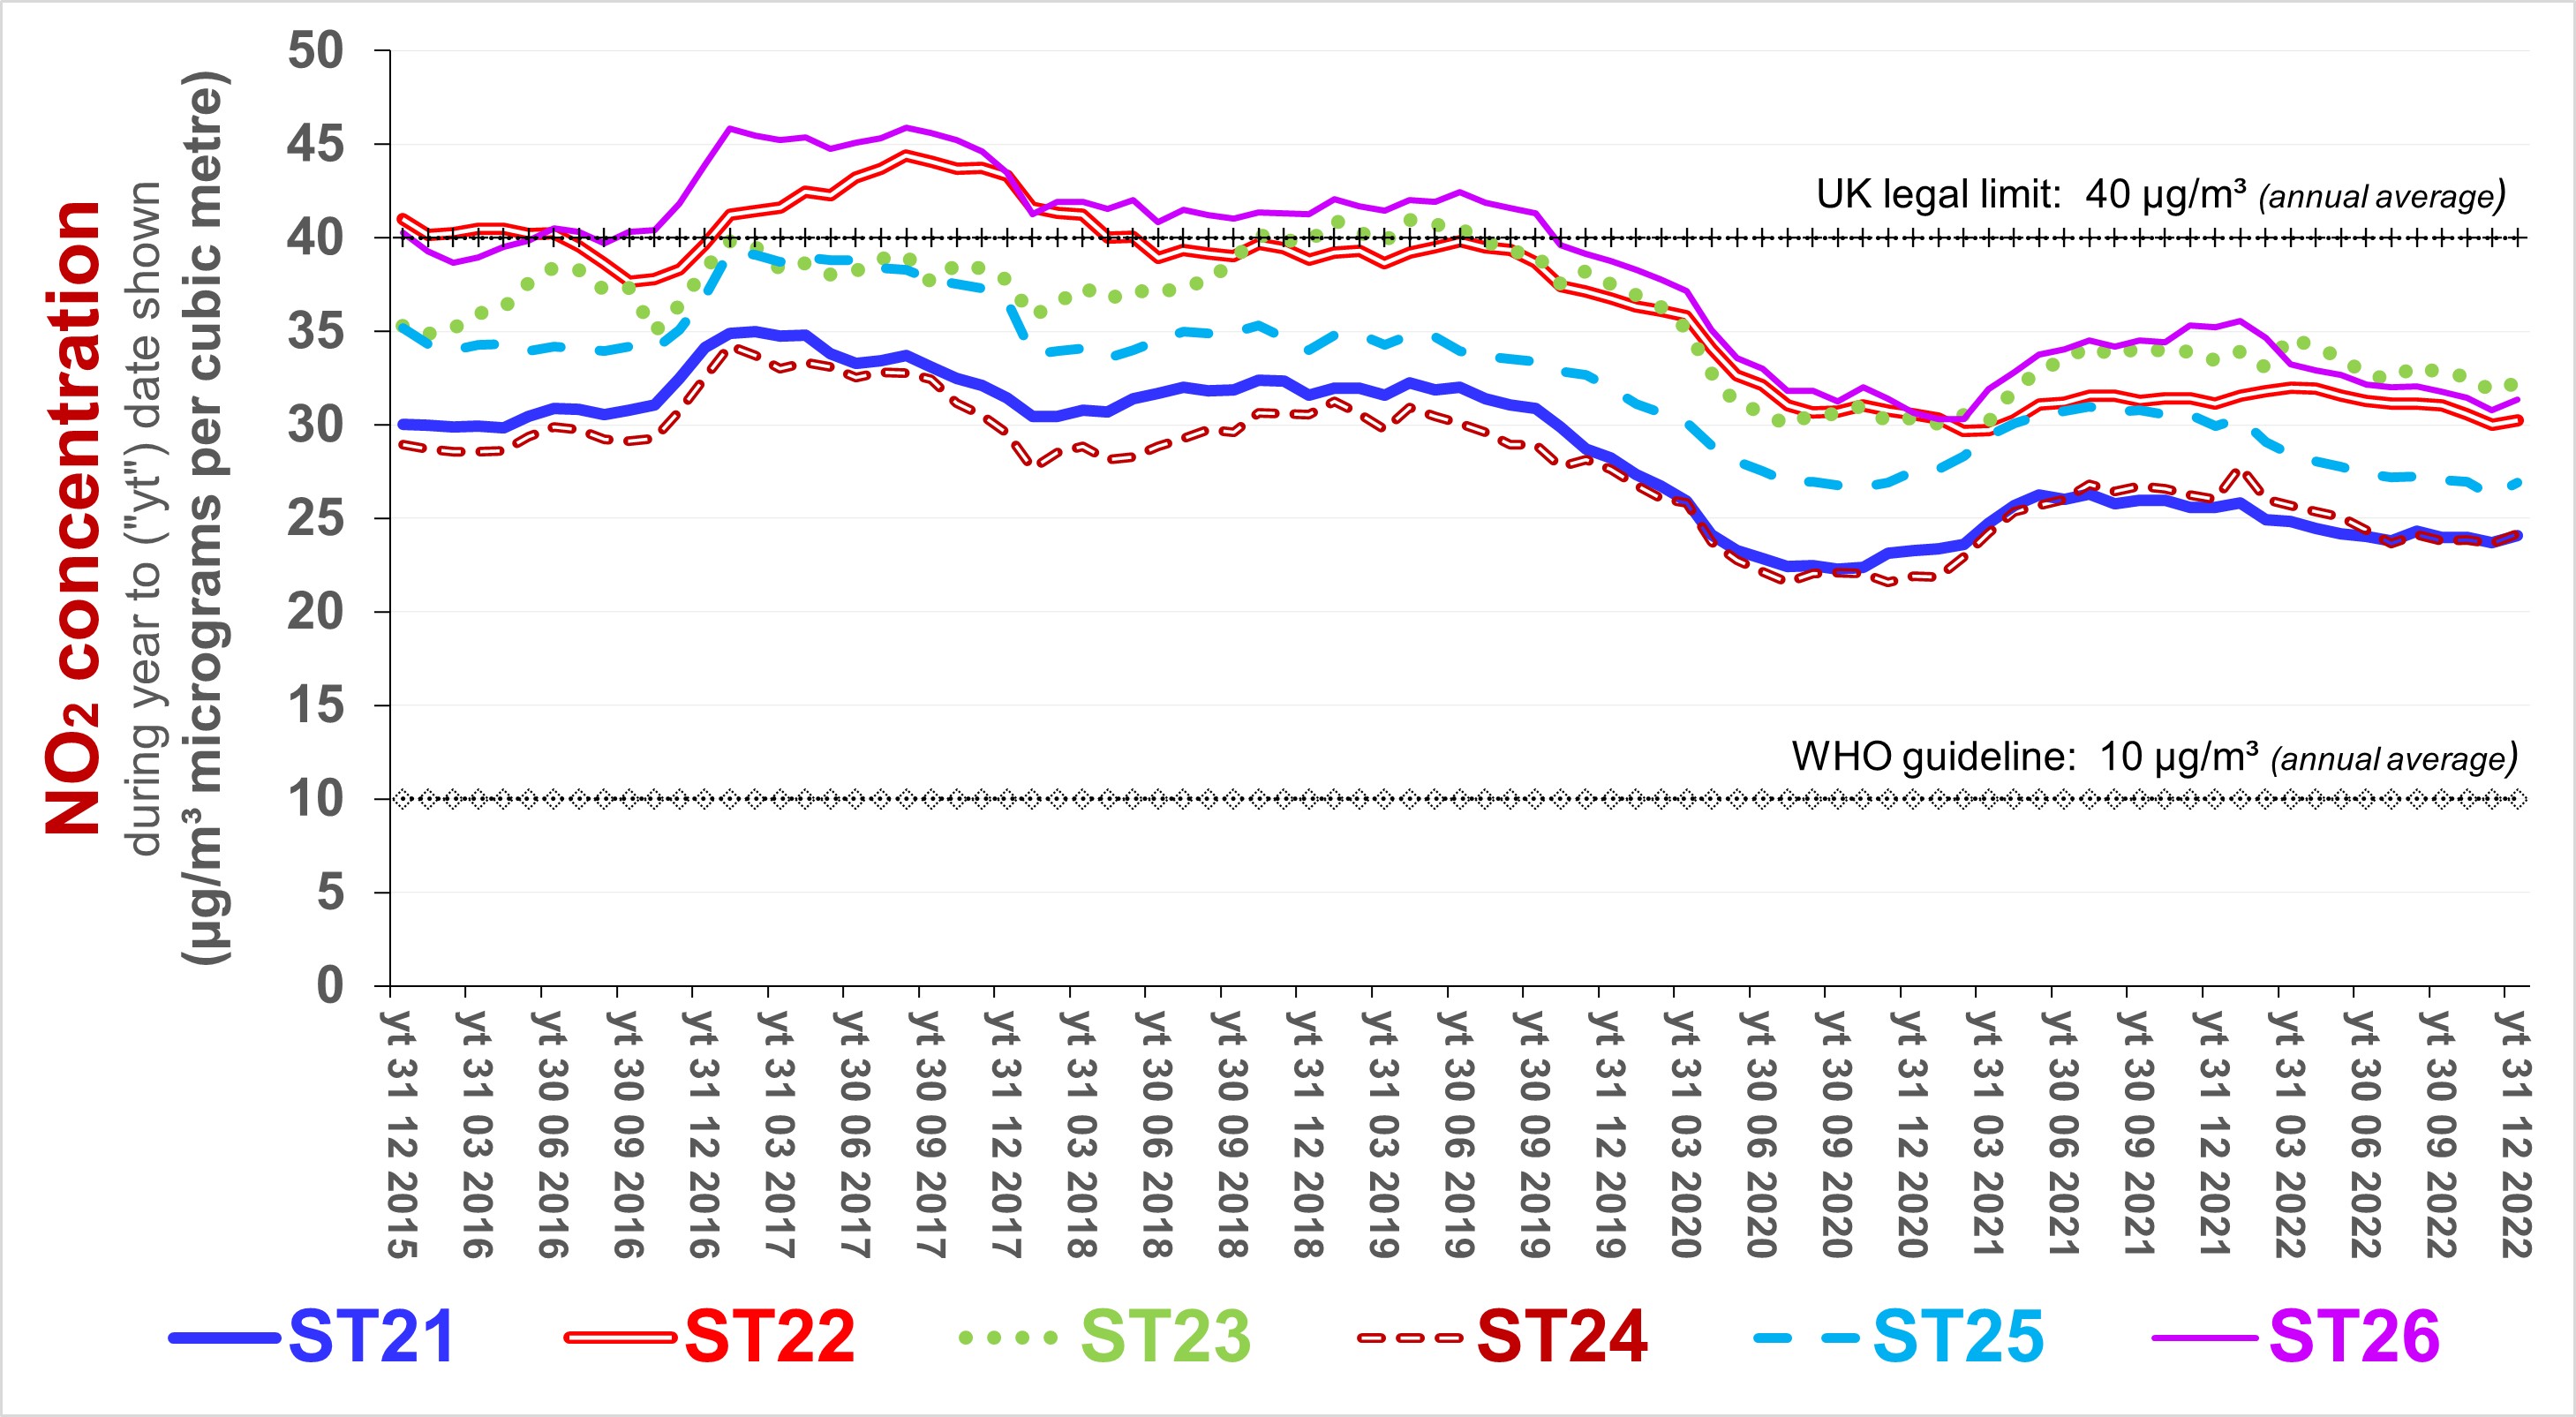
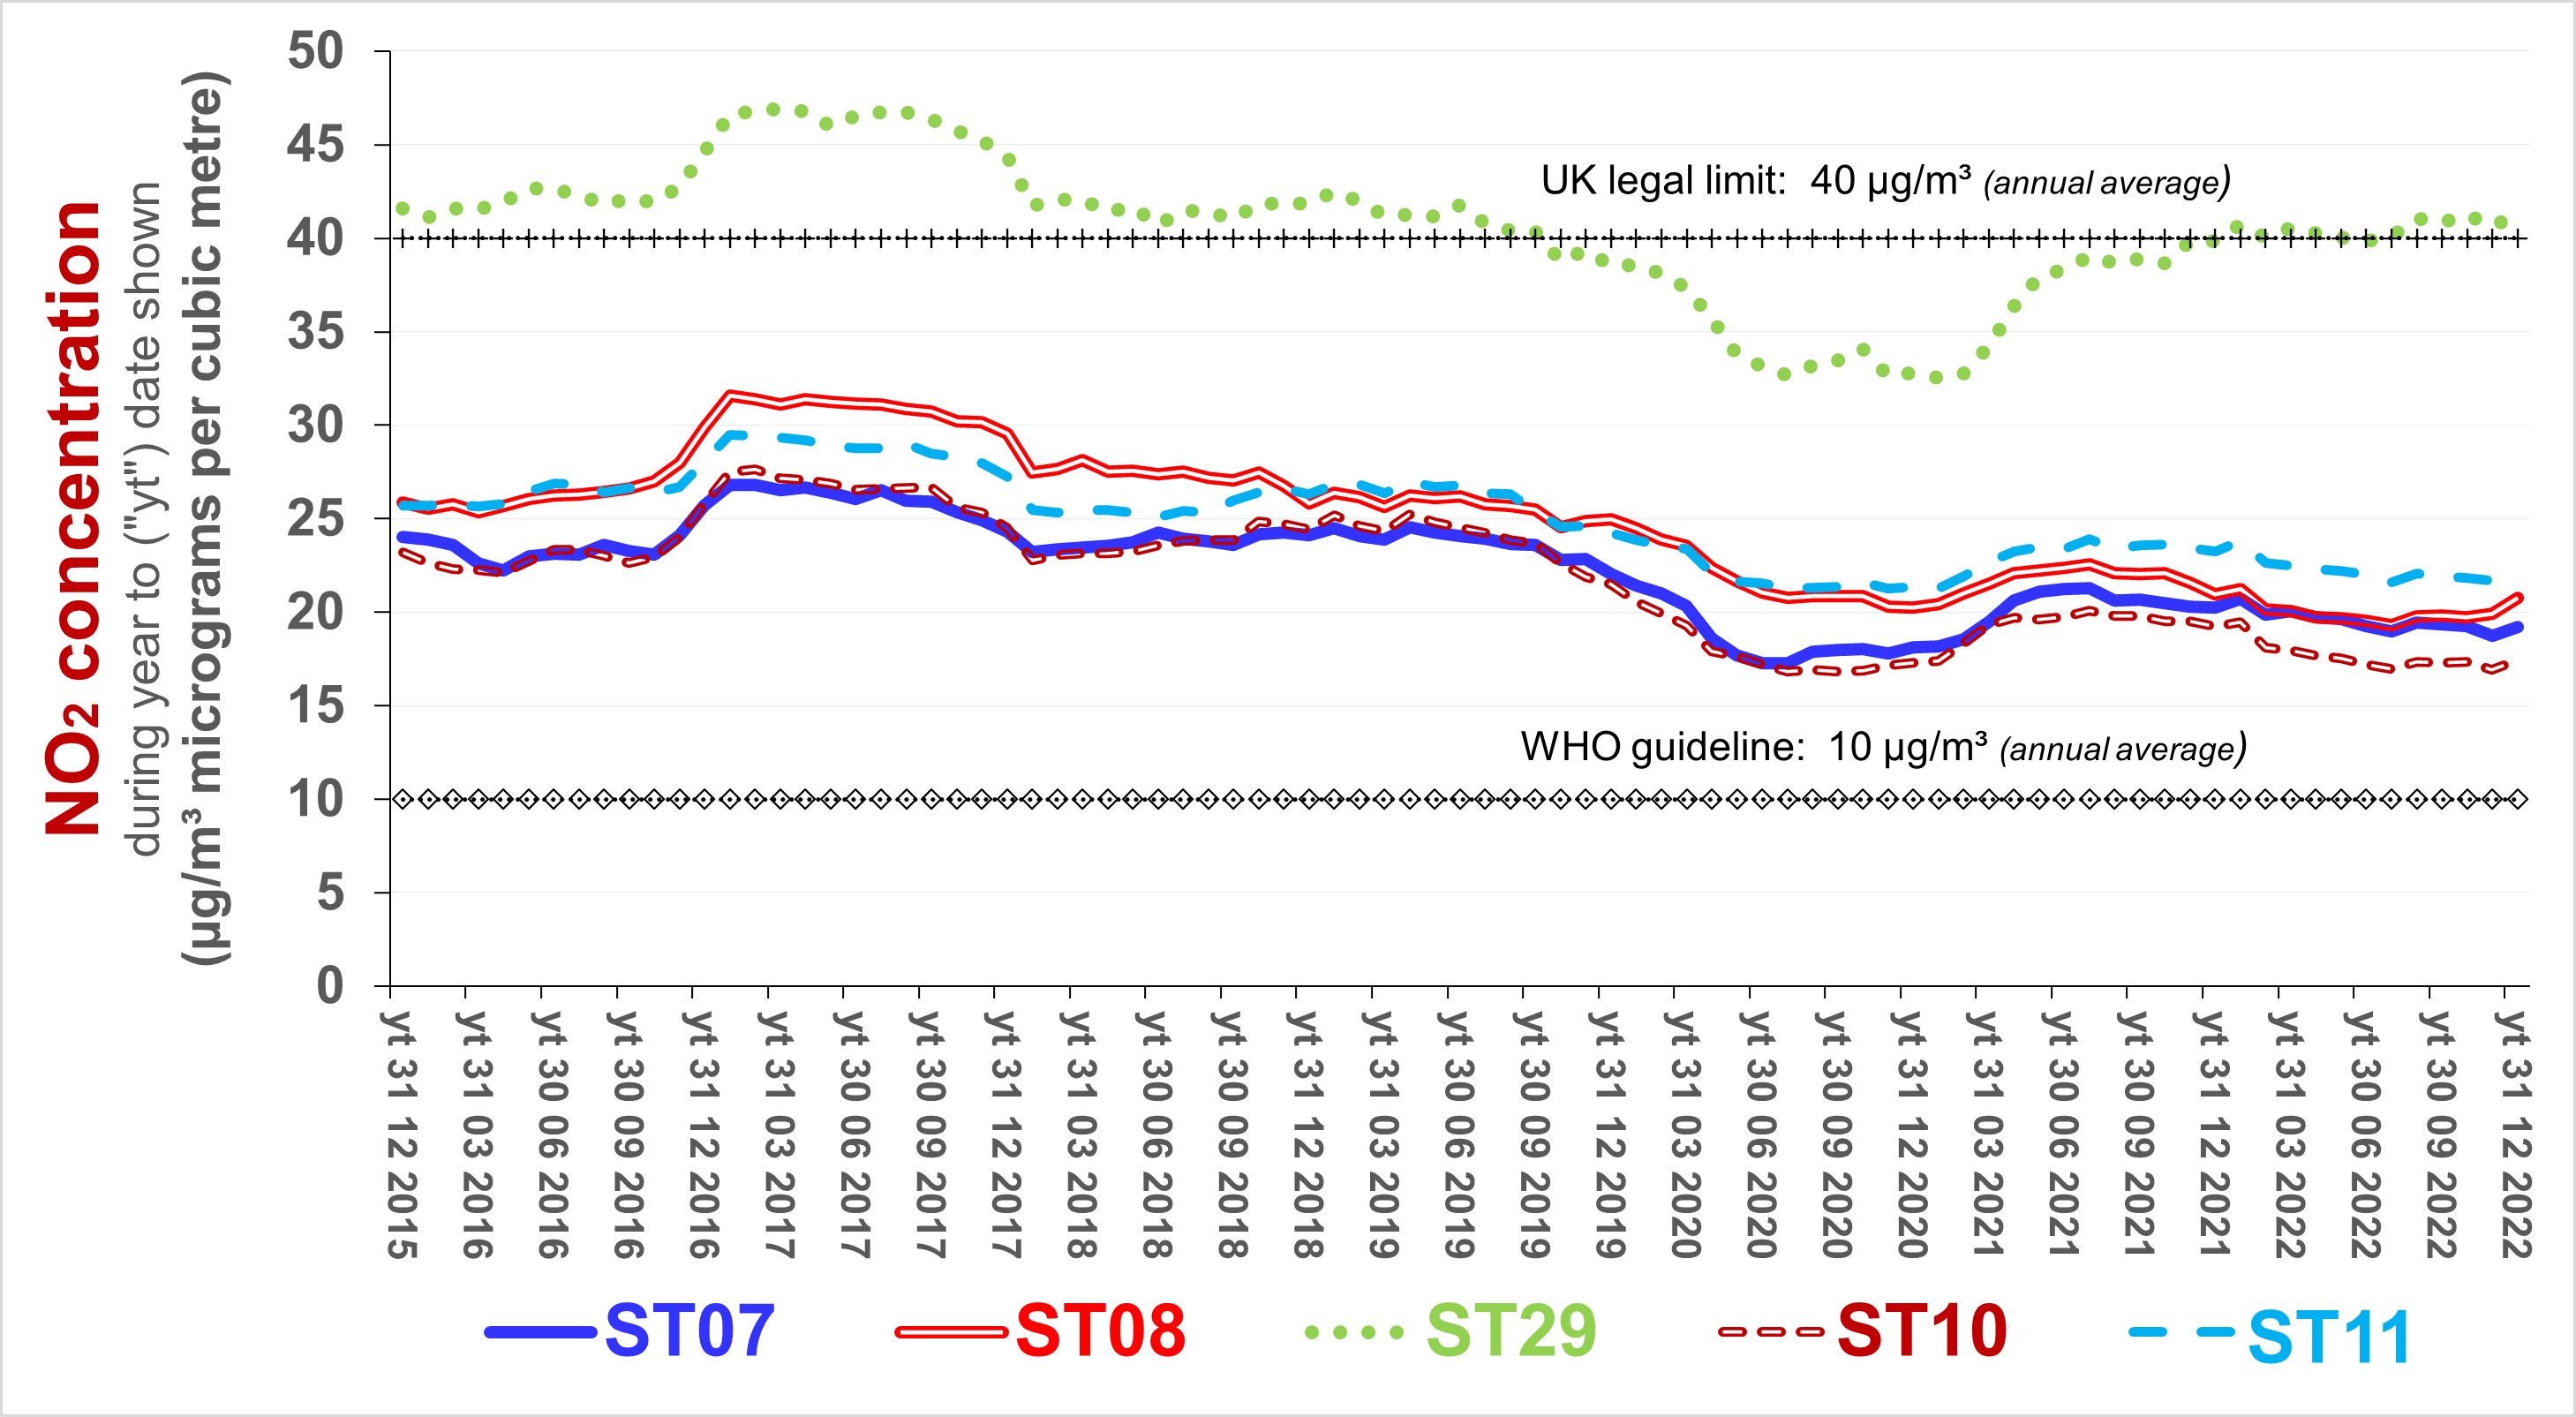
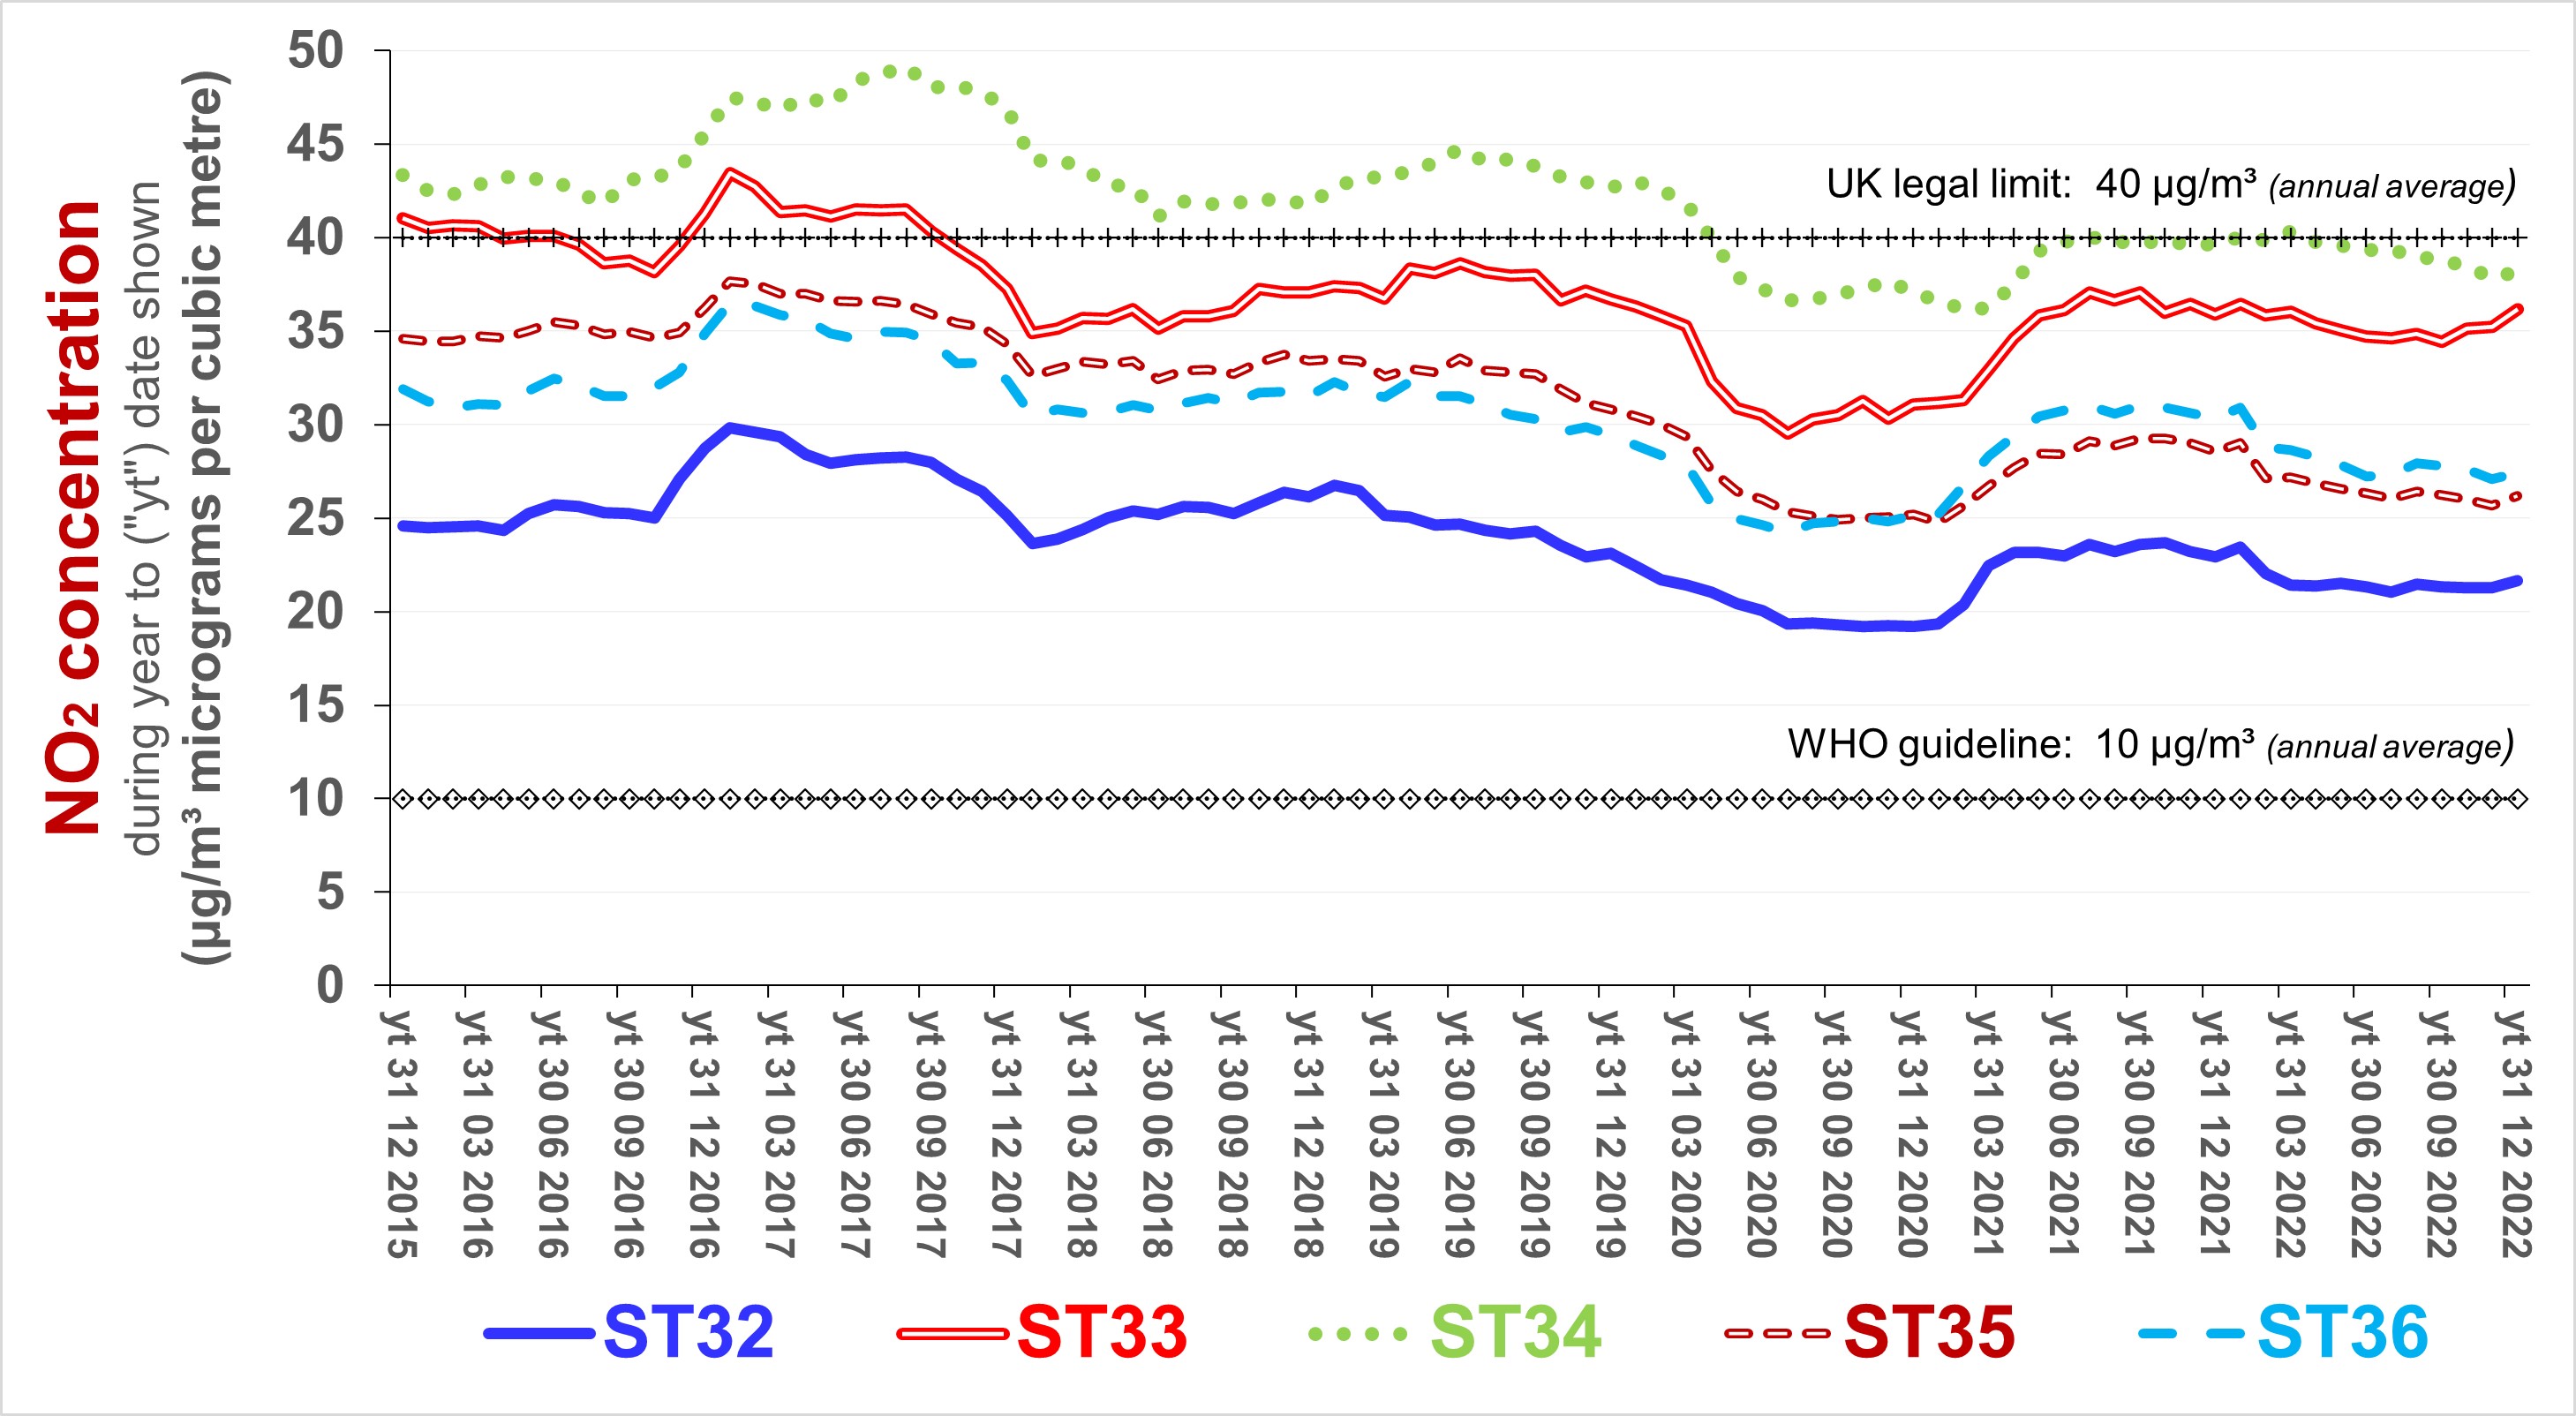
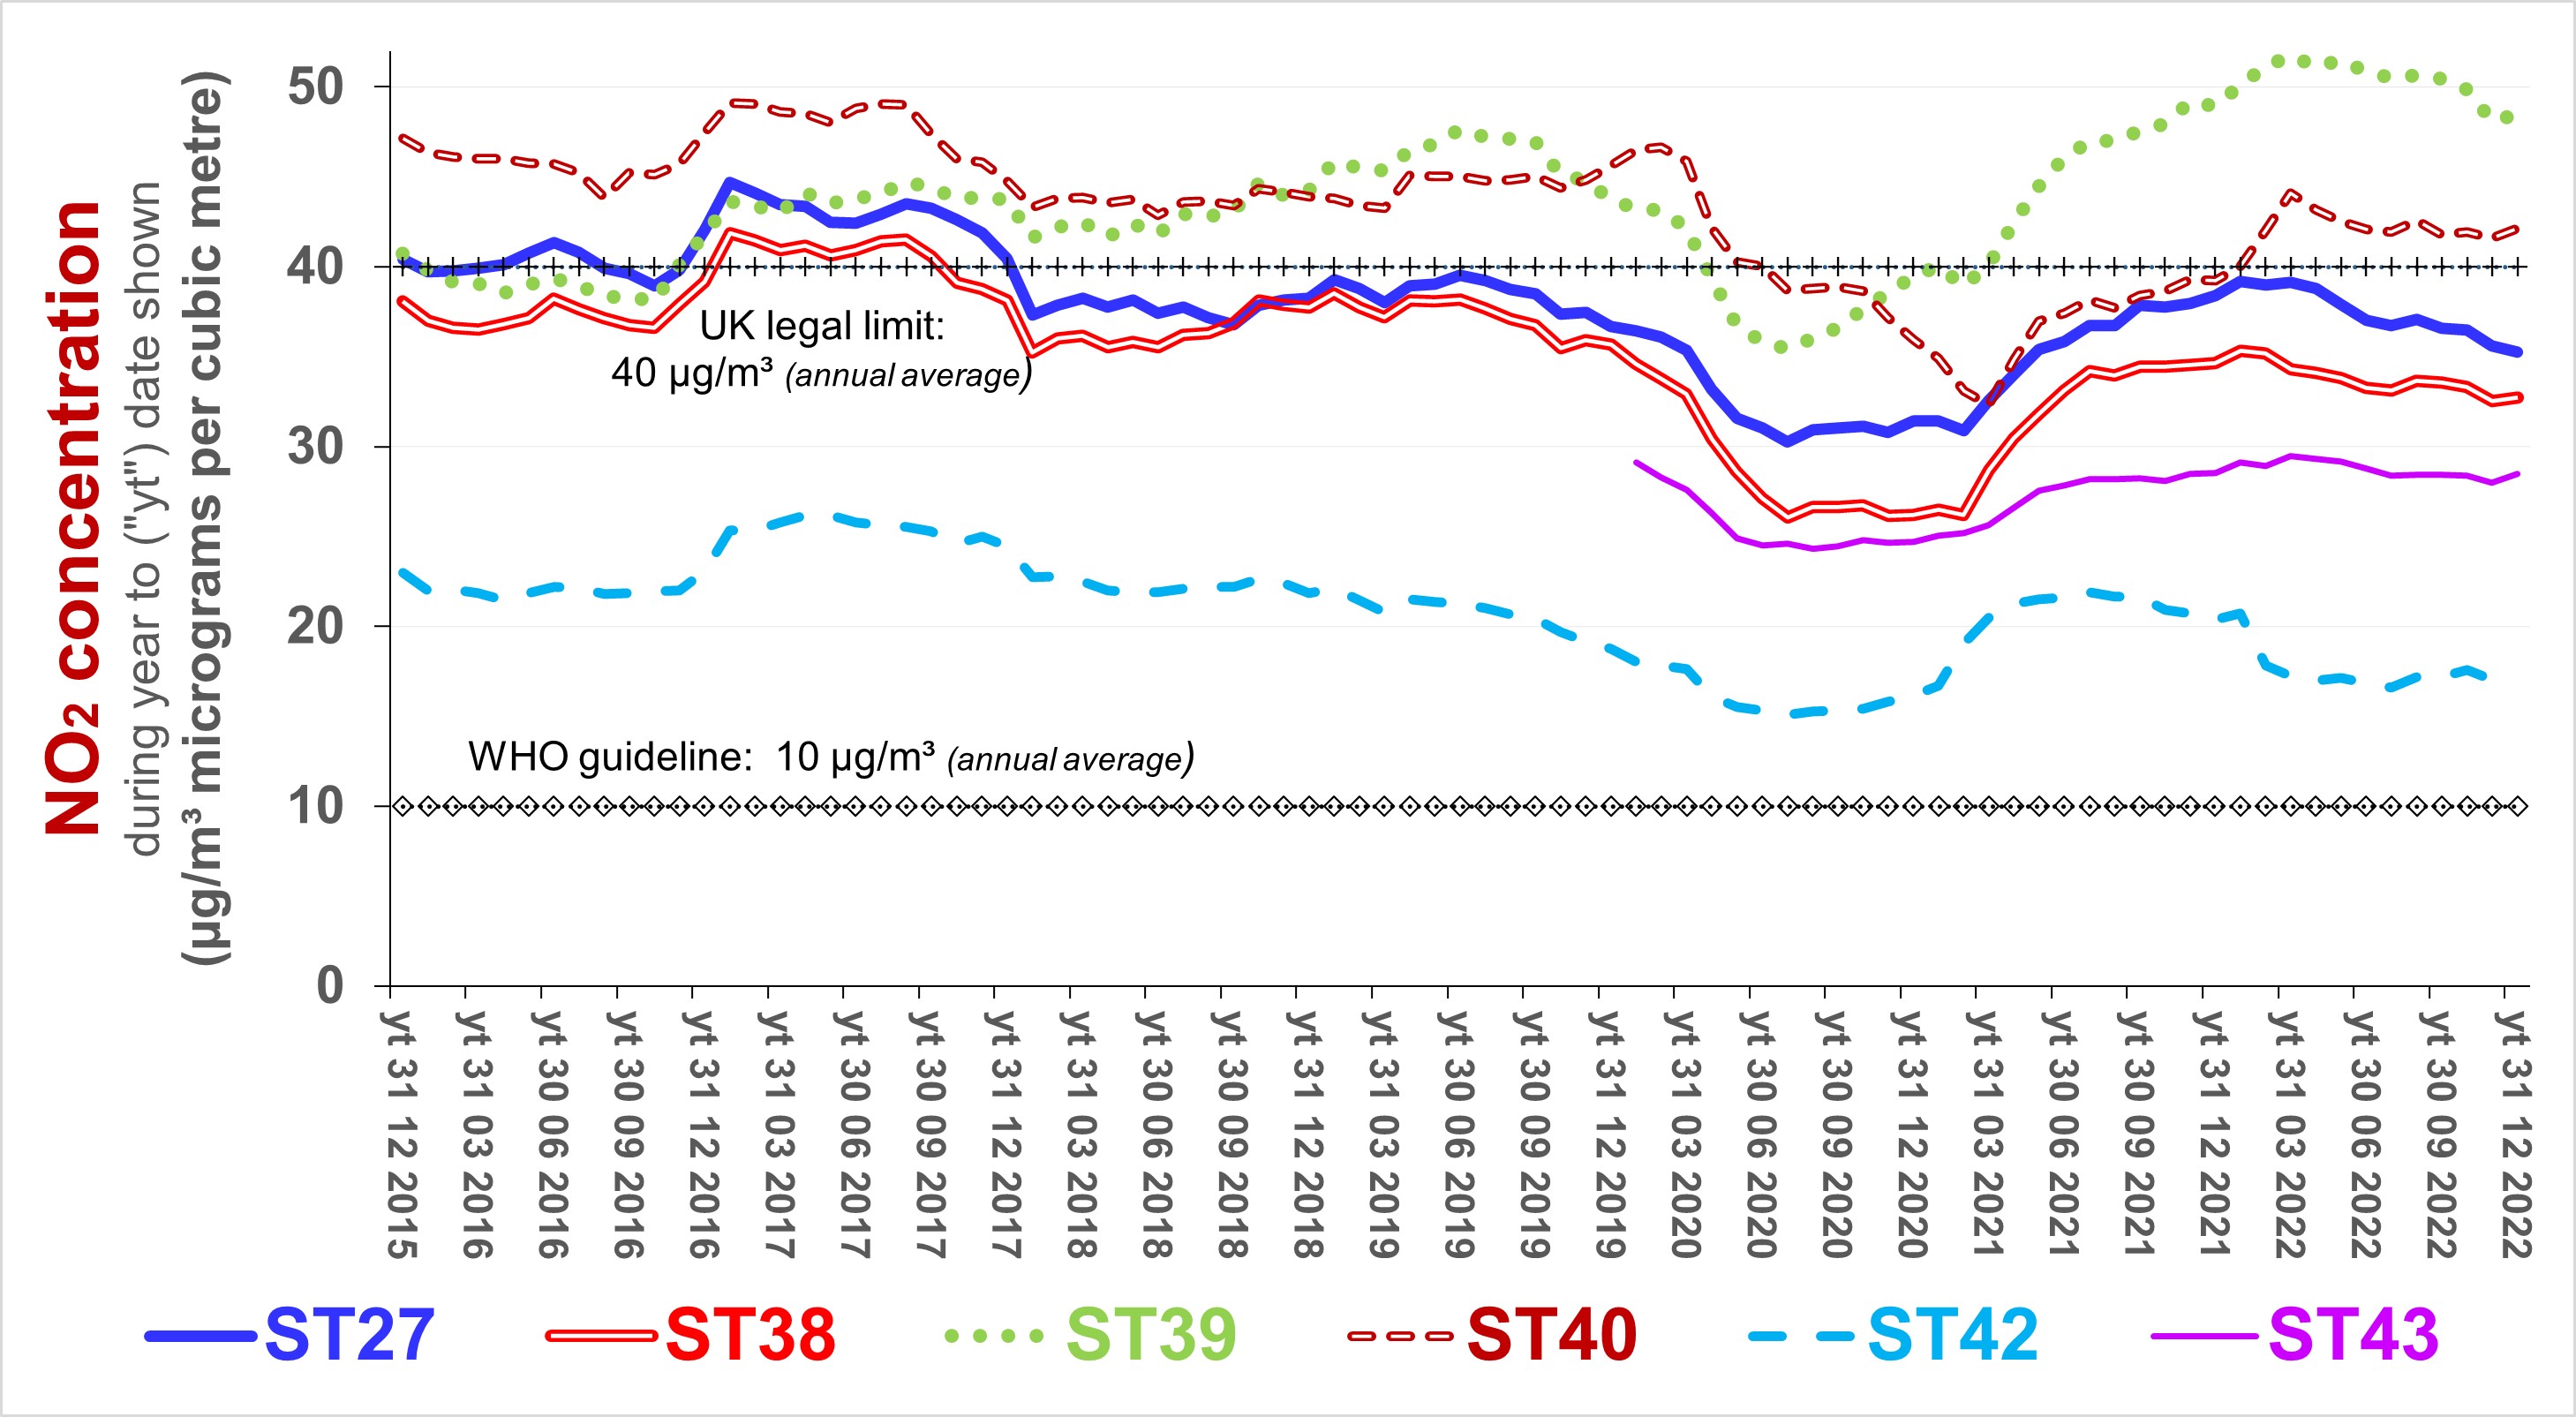
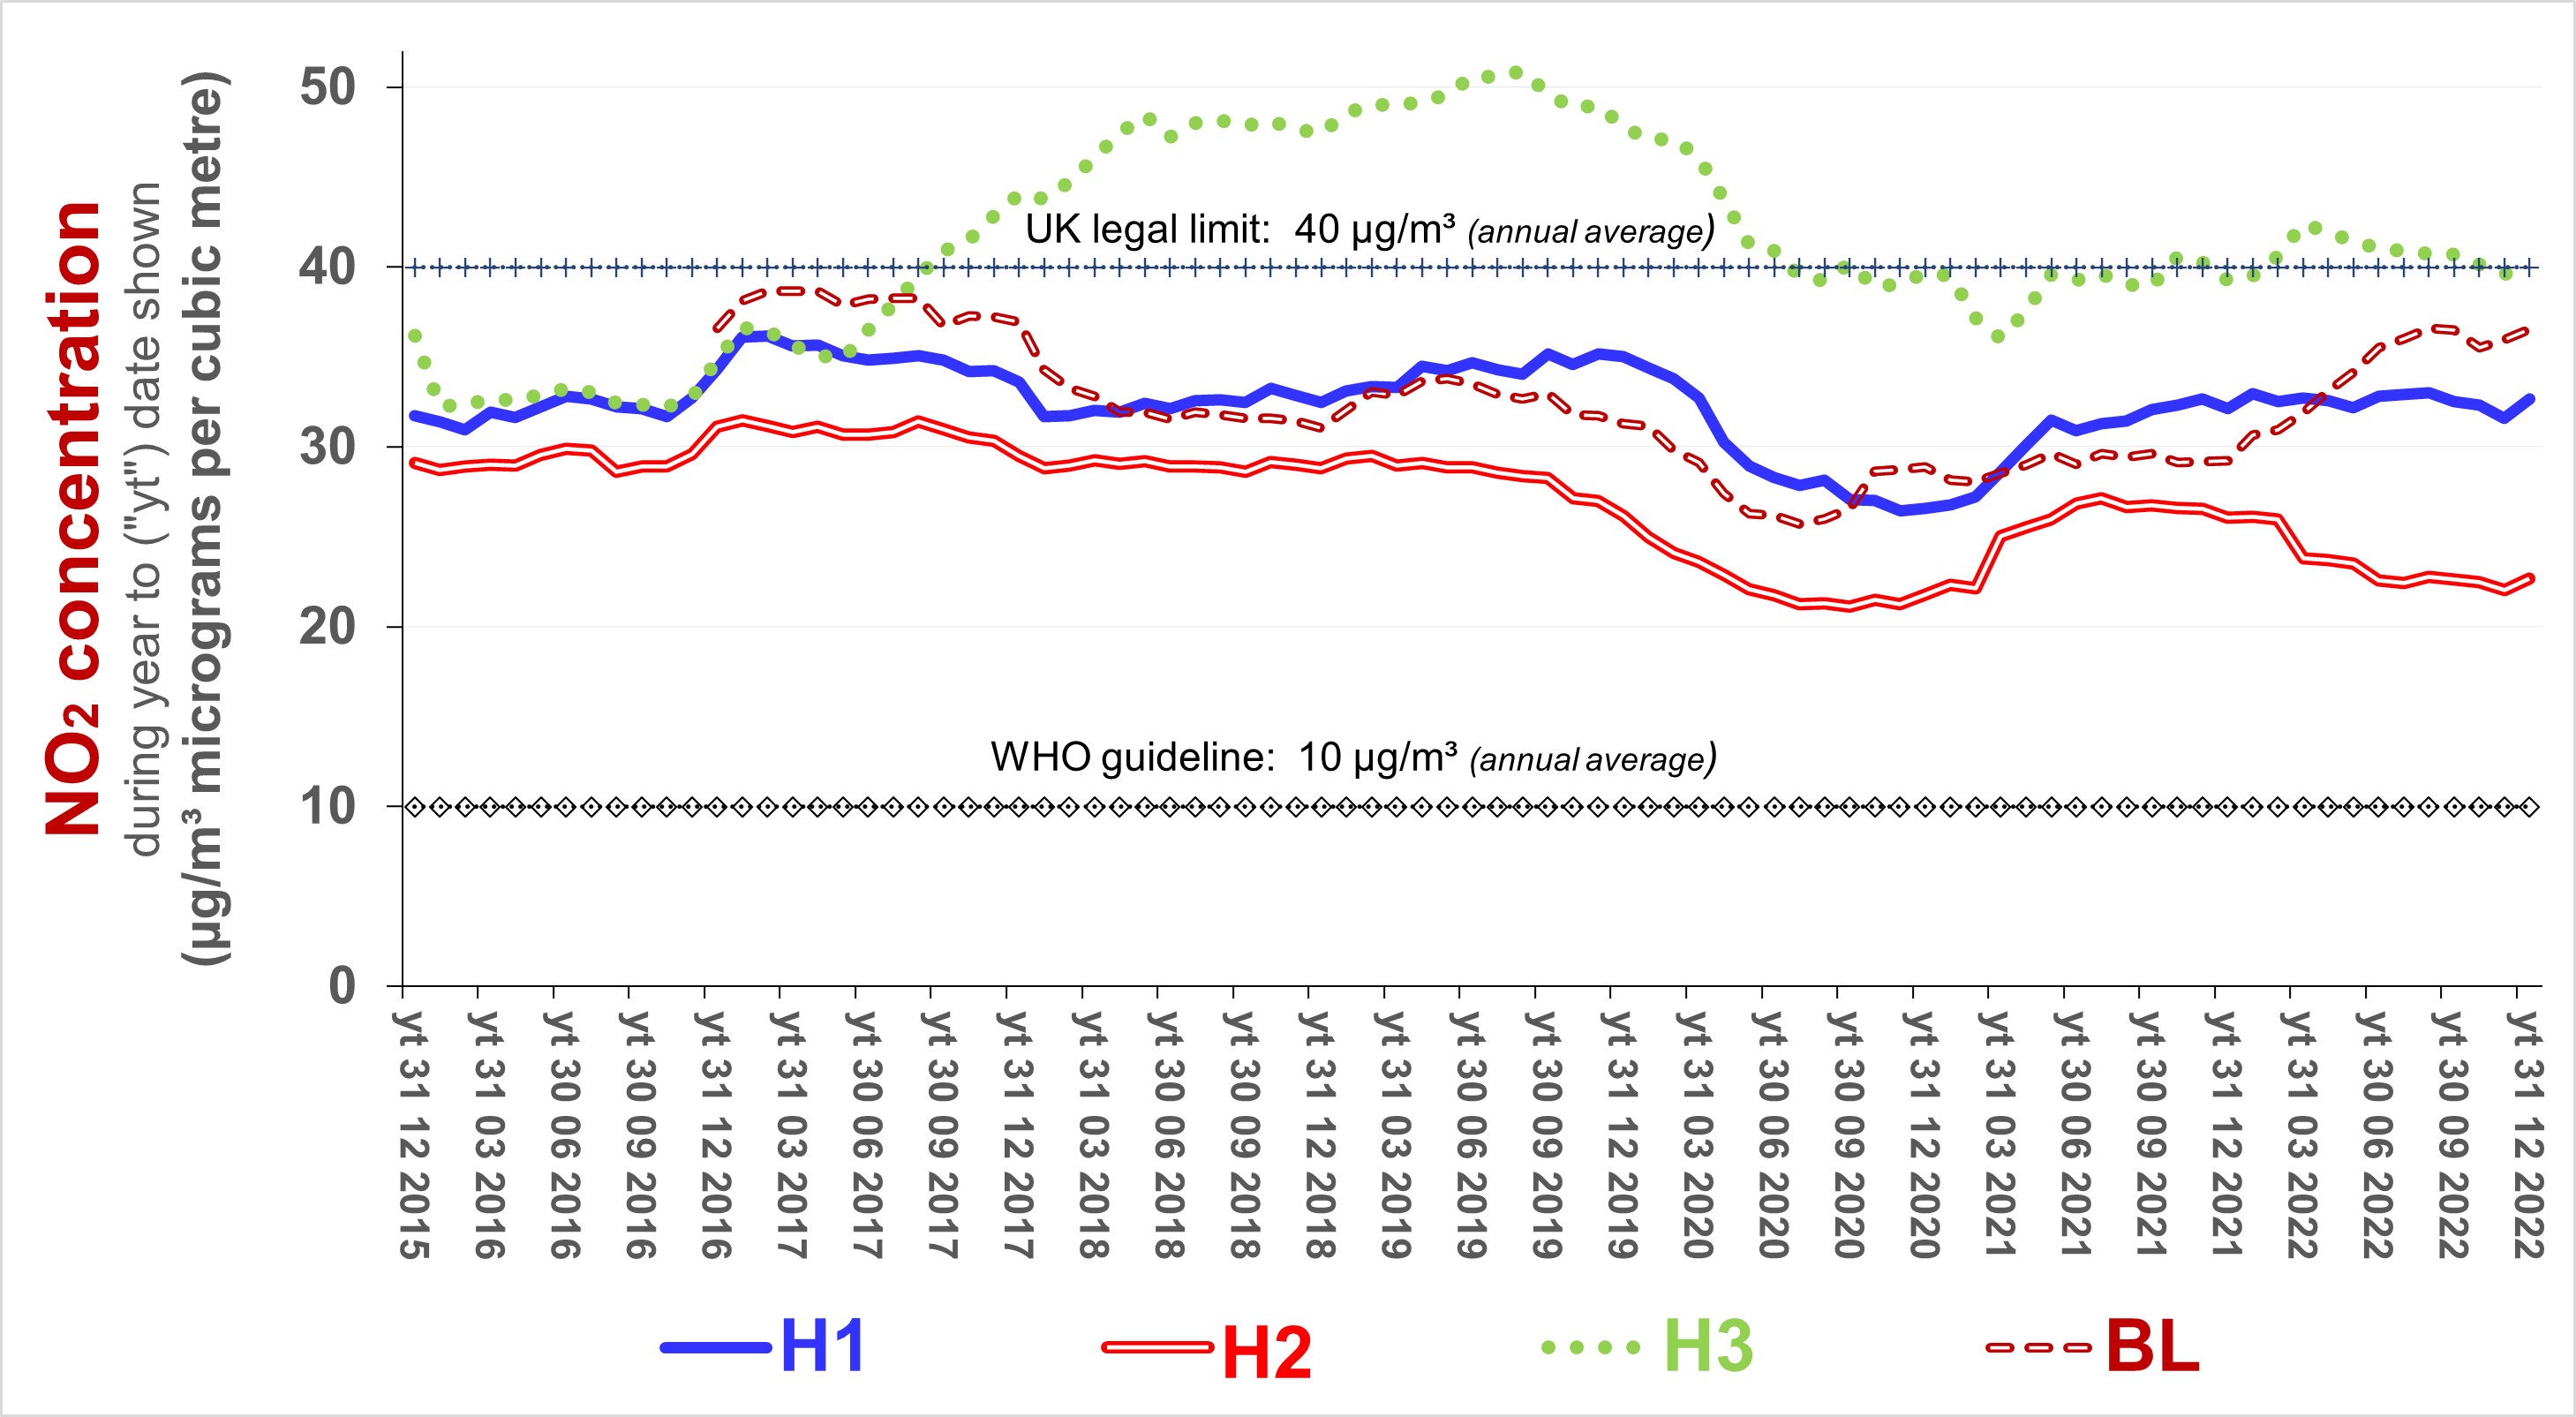
The following charts illustrate trends in emissions of nitrogen dioxide ("NO2") as measured for Sutton Council using diffusion tubes. The data is presented without adjustment for inherent bias (and may overstate recent actual concentrations). Tightened refulations concerning vehicle engines will have contributed to the improvements apparent at some locations since 2019. The dip between 2020 and 2021 will have been attributable primarily to covid-related lockdowns. Towards the end of 2022, concentrations were worst (close to the legal "objective") at the following sites: Rose Hill roundabout, Cheam High Street, Park Lane, Oakhill Road, and London Road.
Source: based on Air Quality Annual Status Reports, London Borough of Sutton
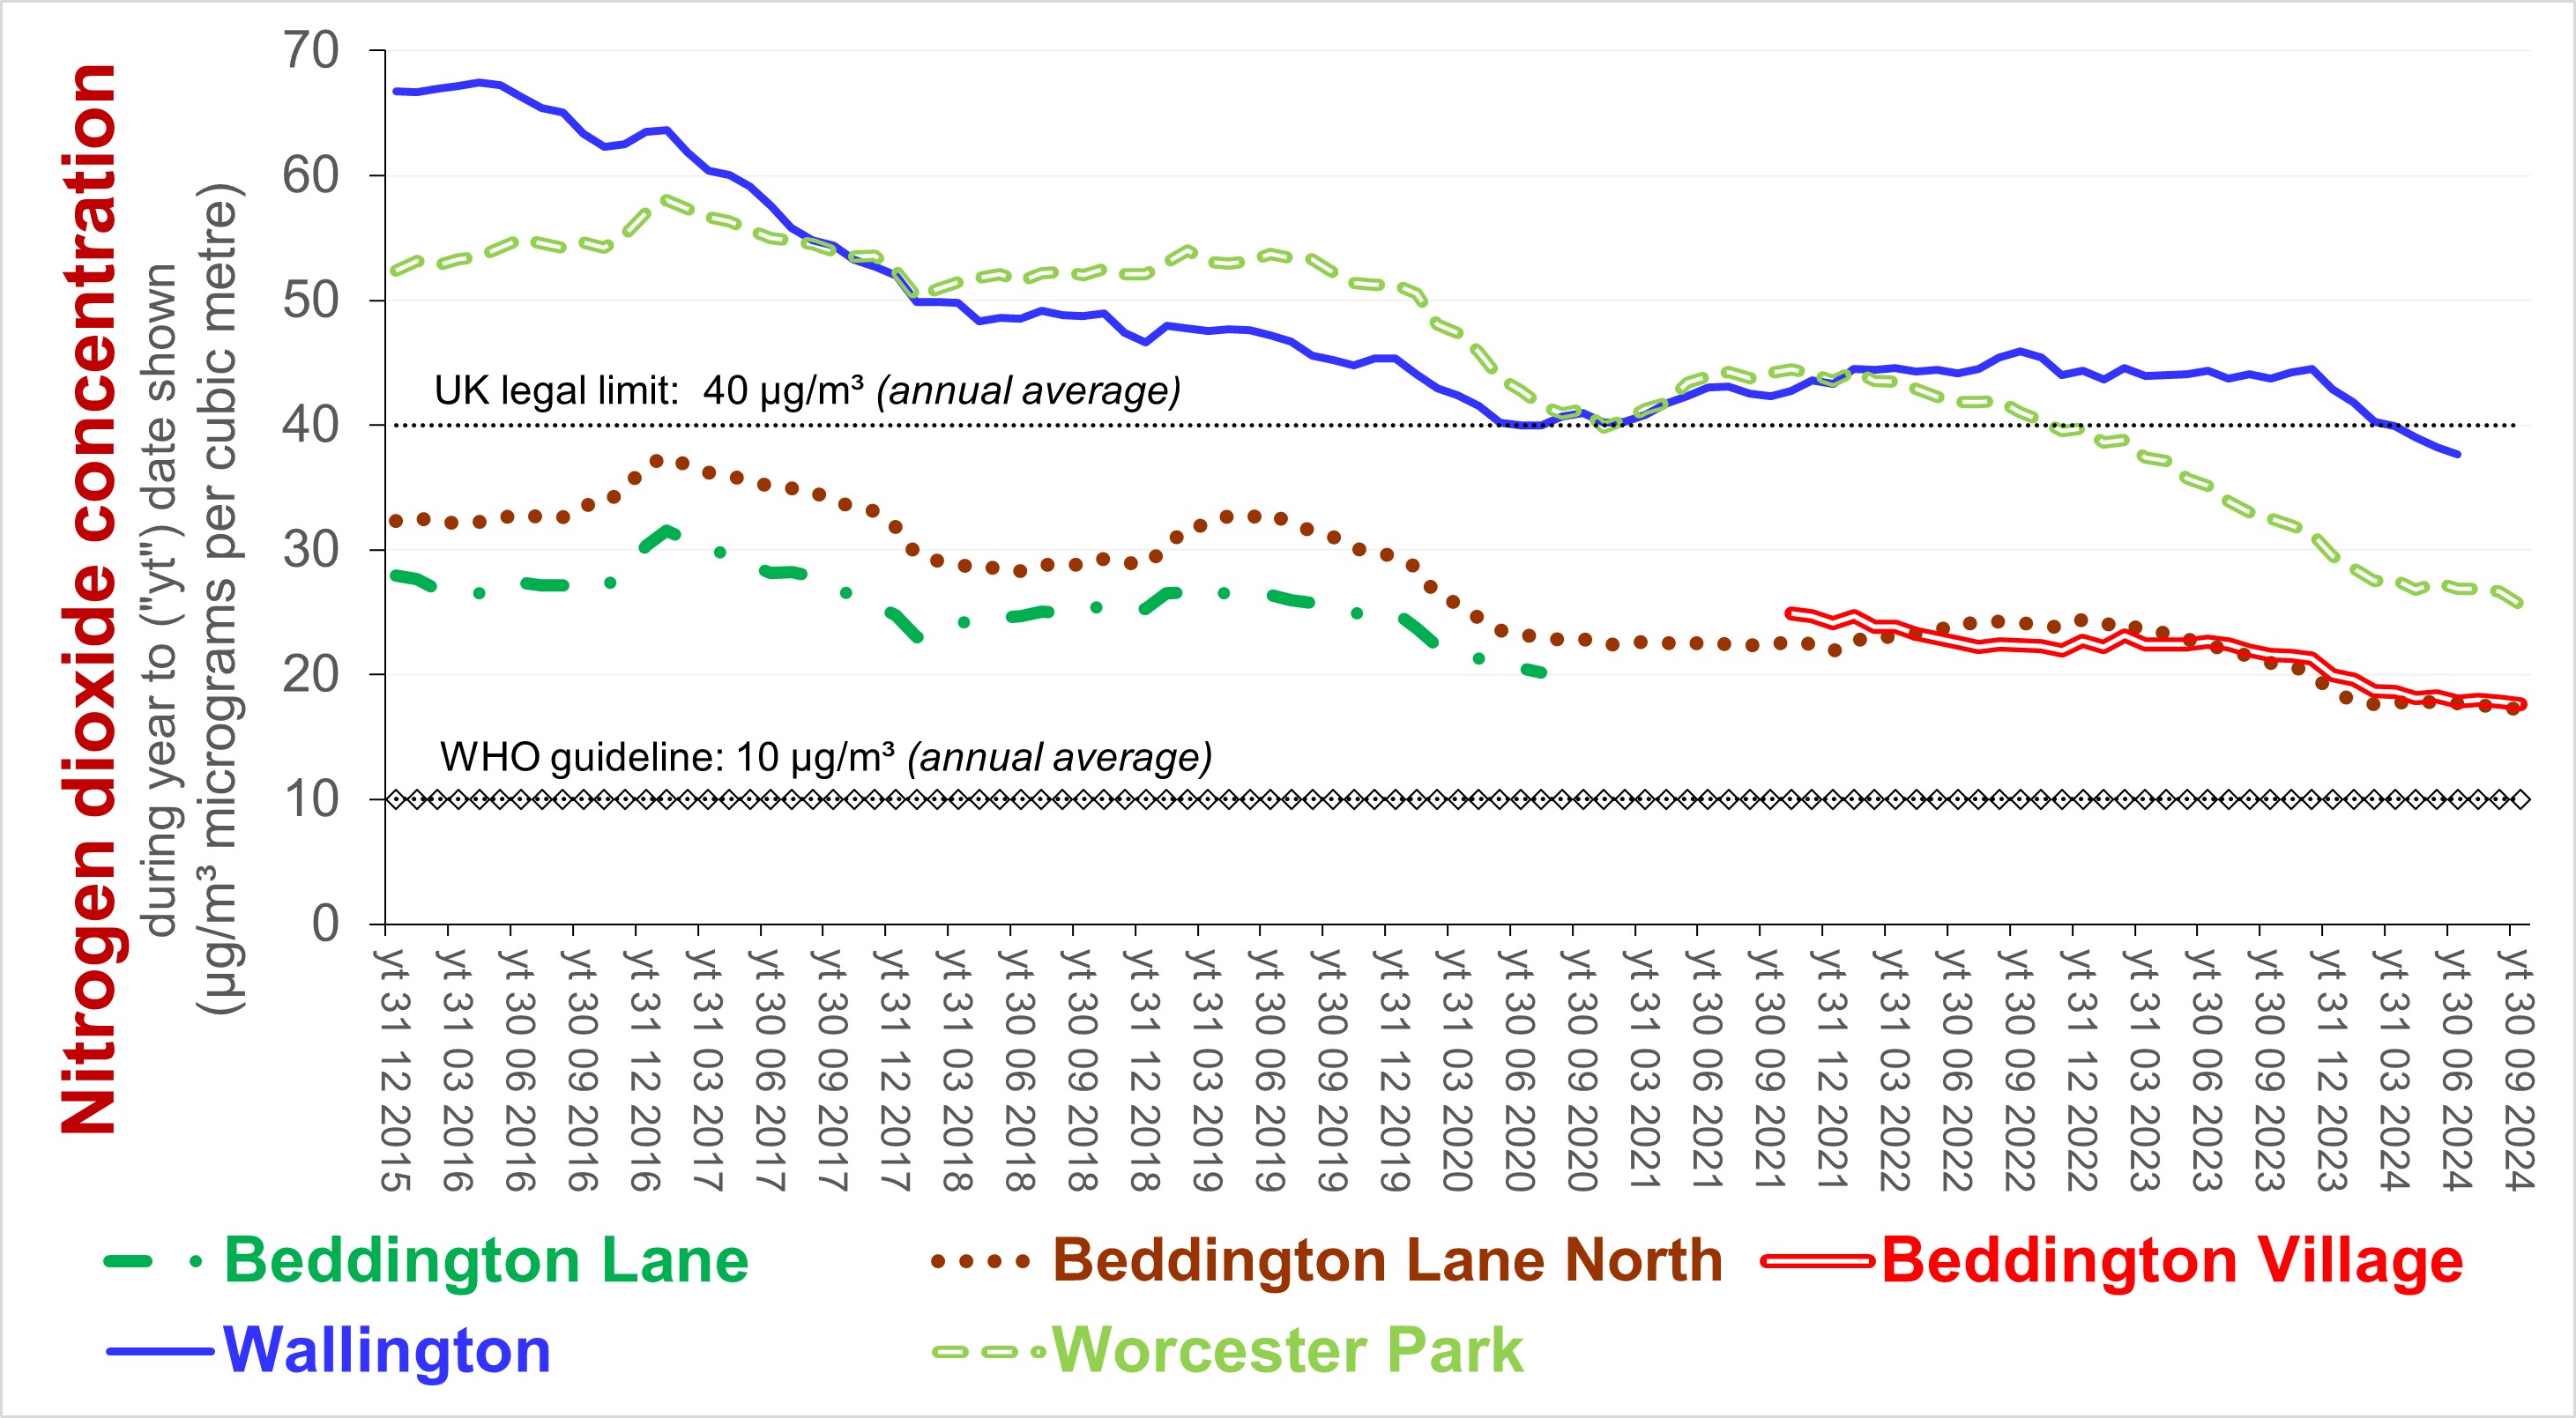
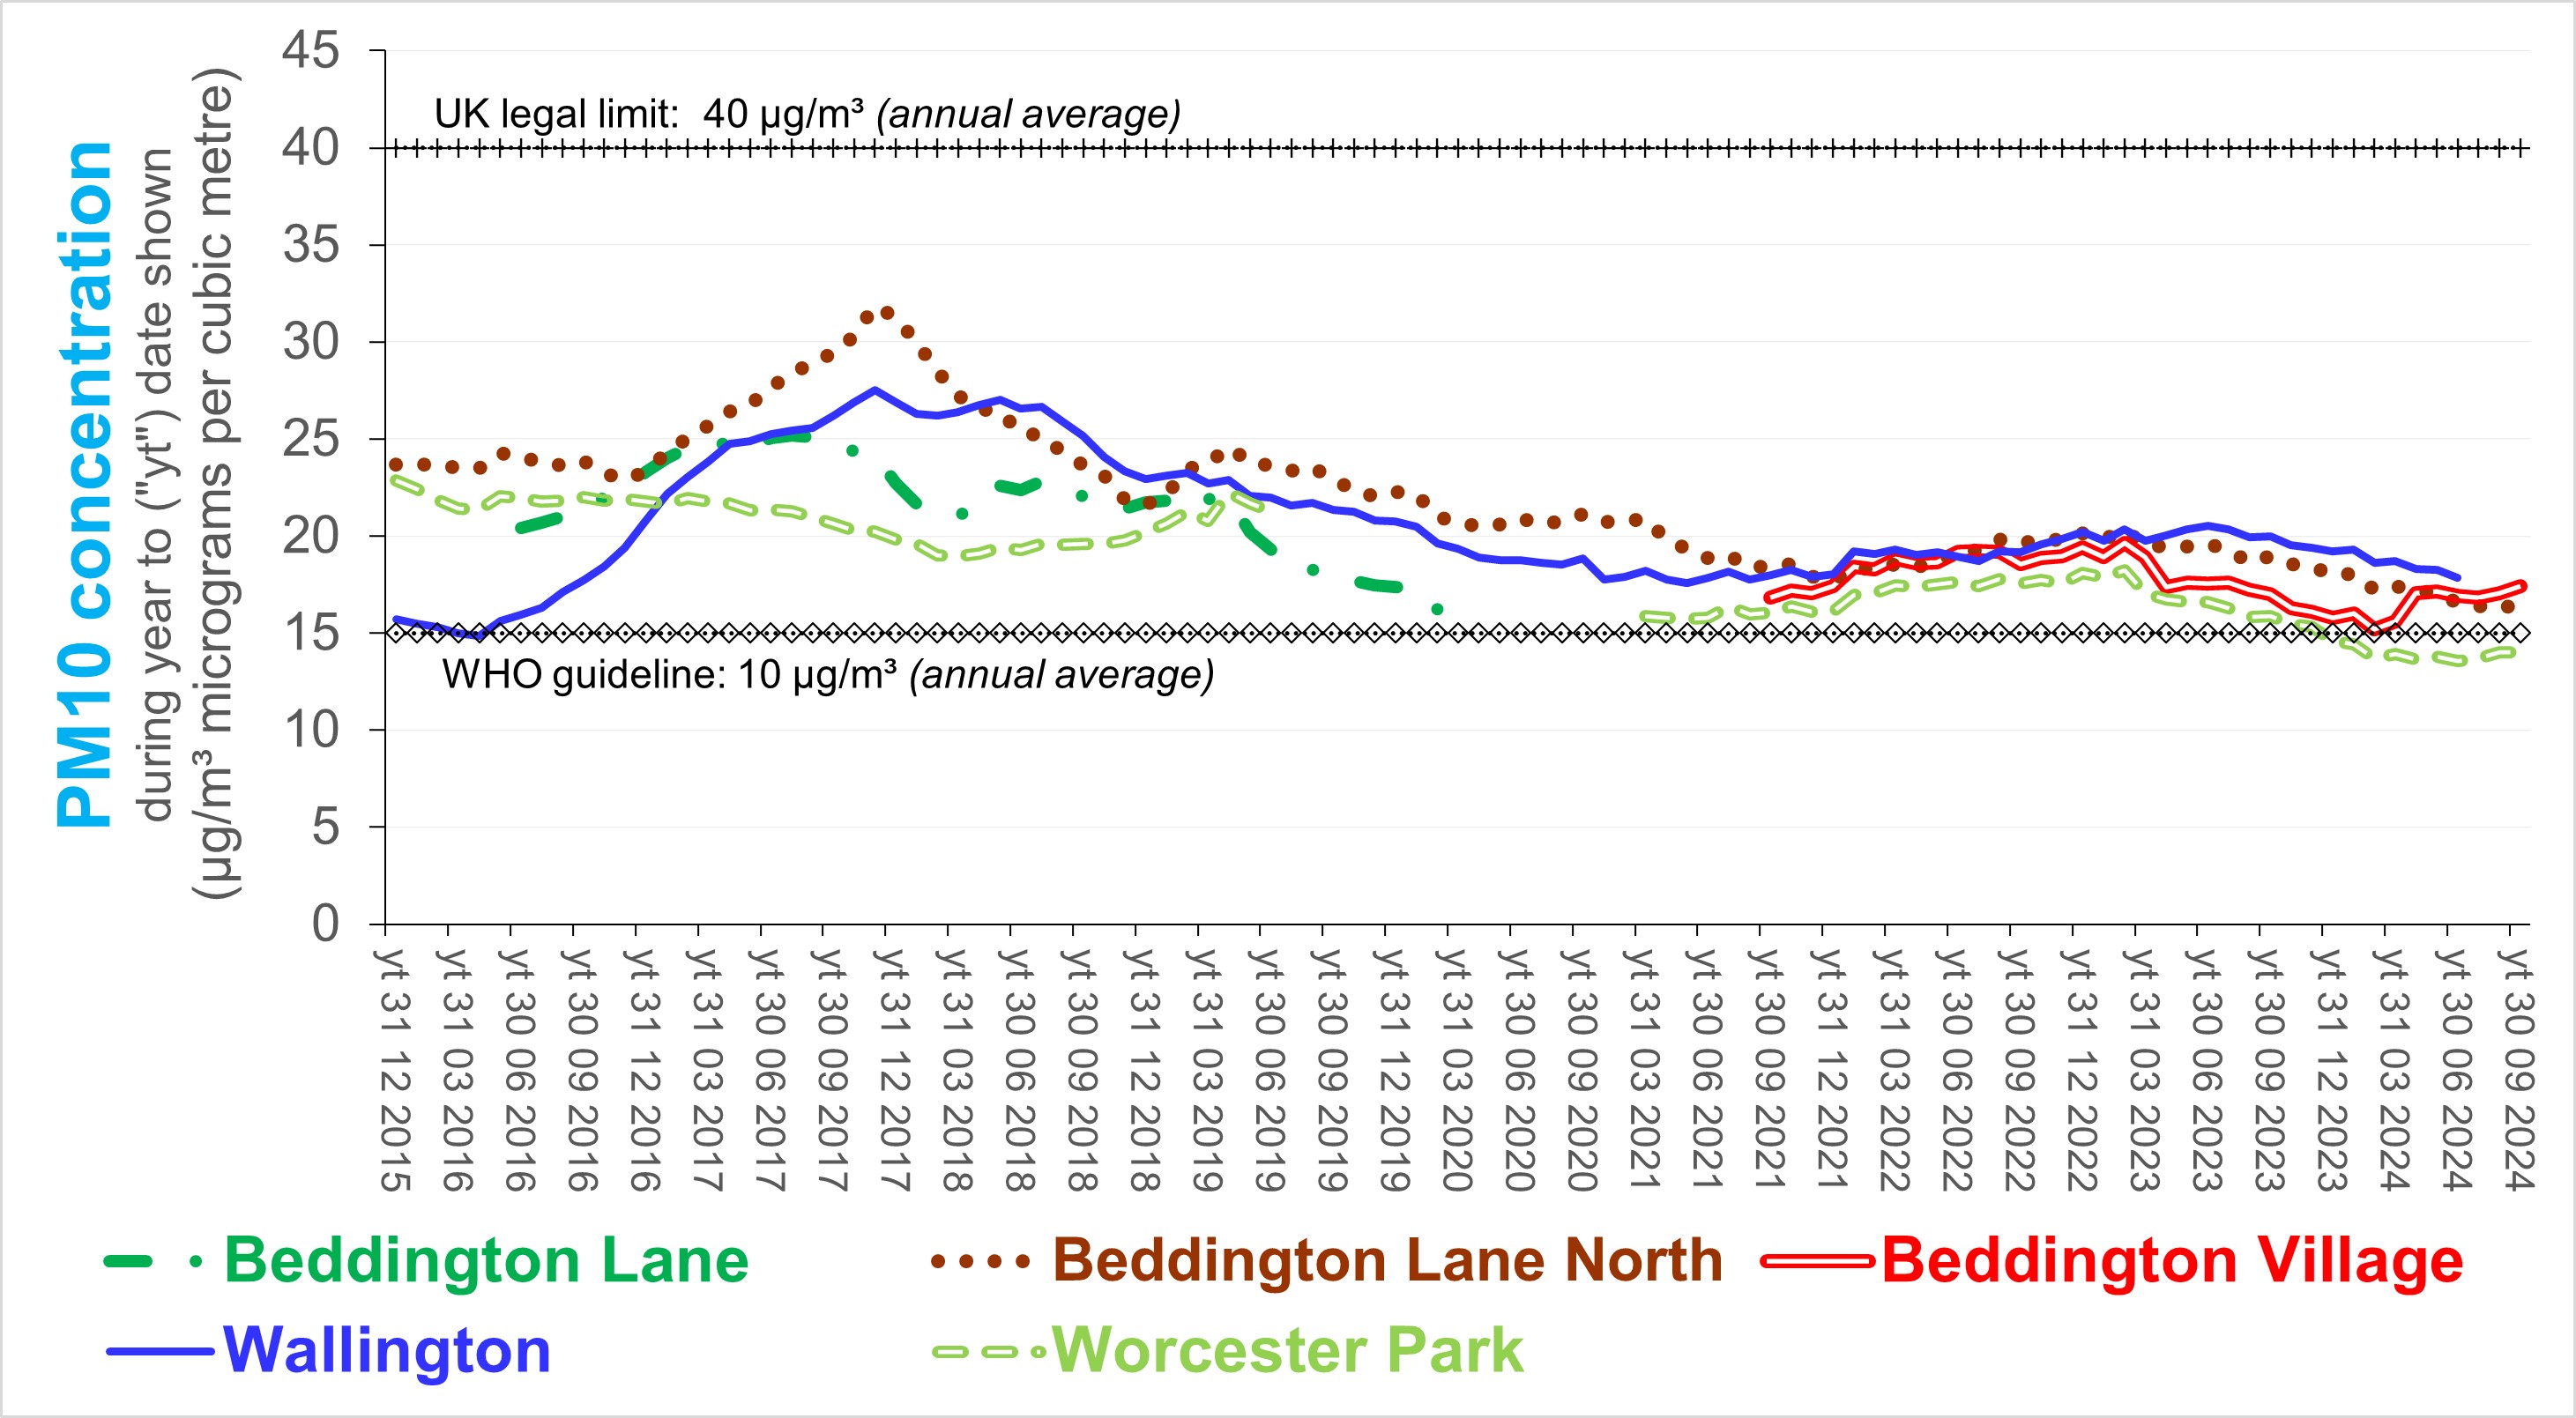
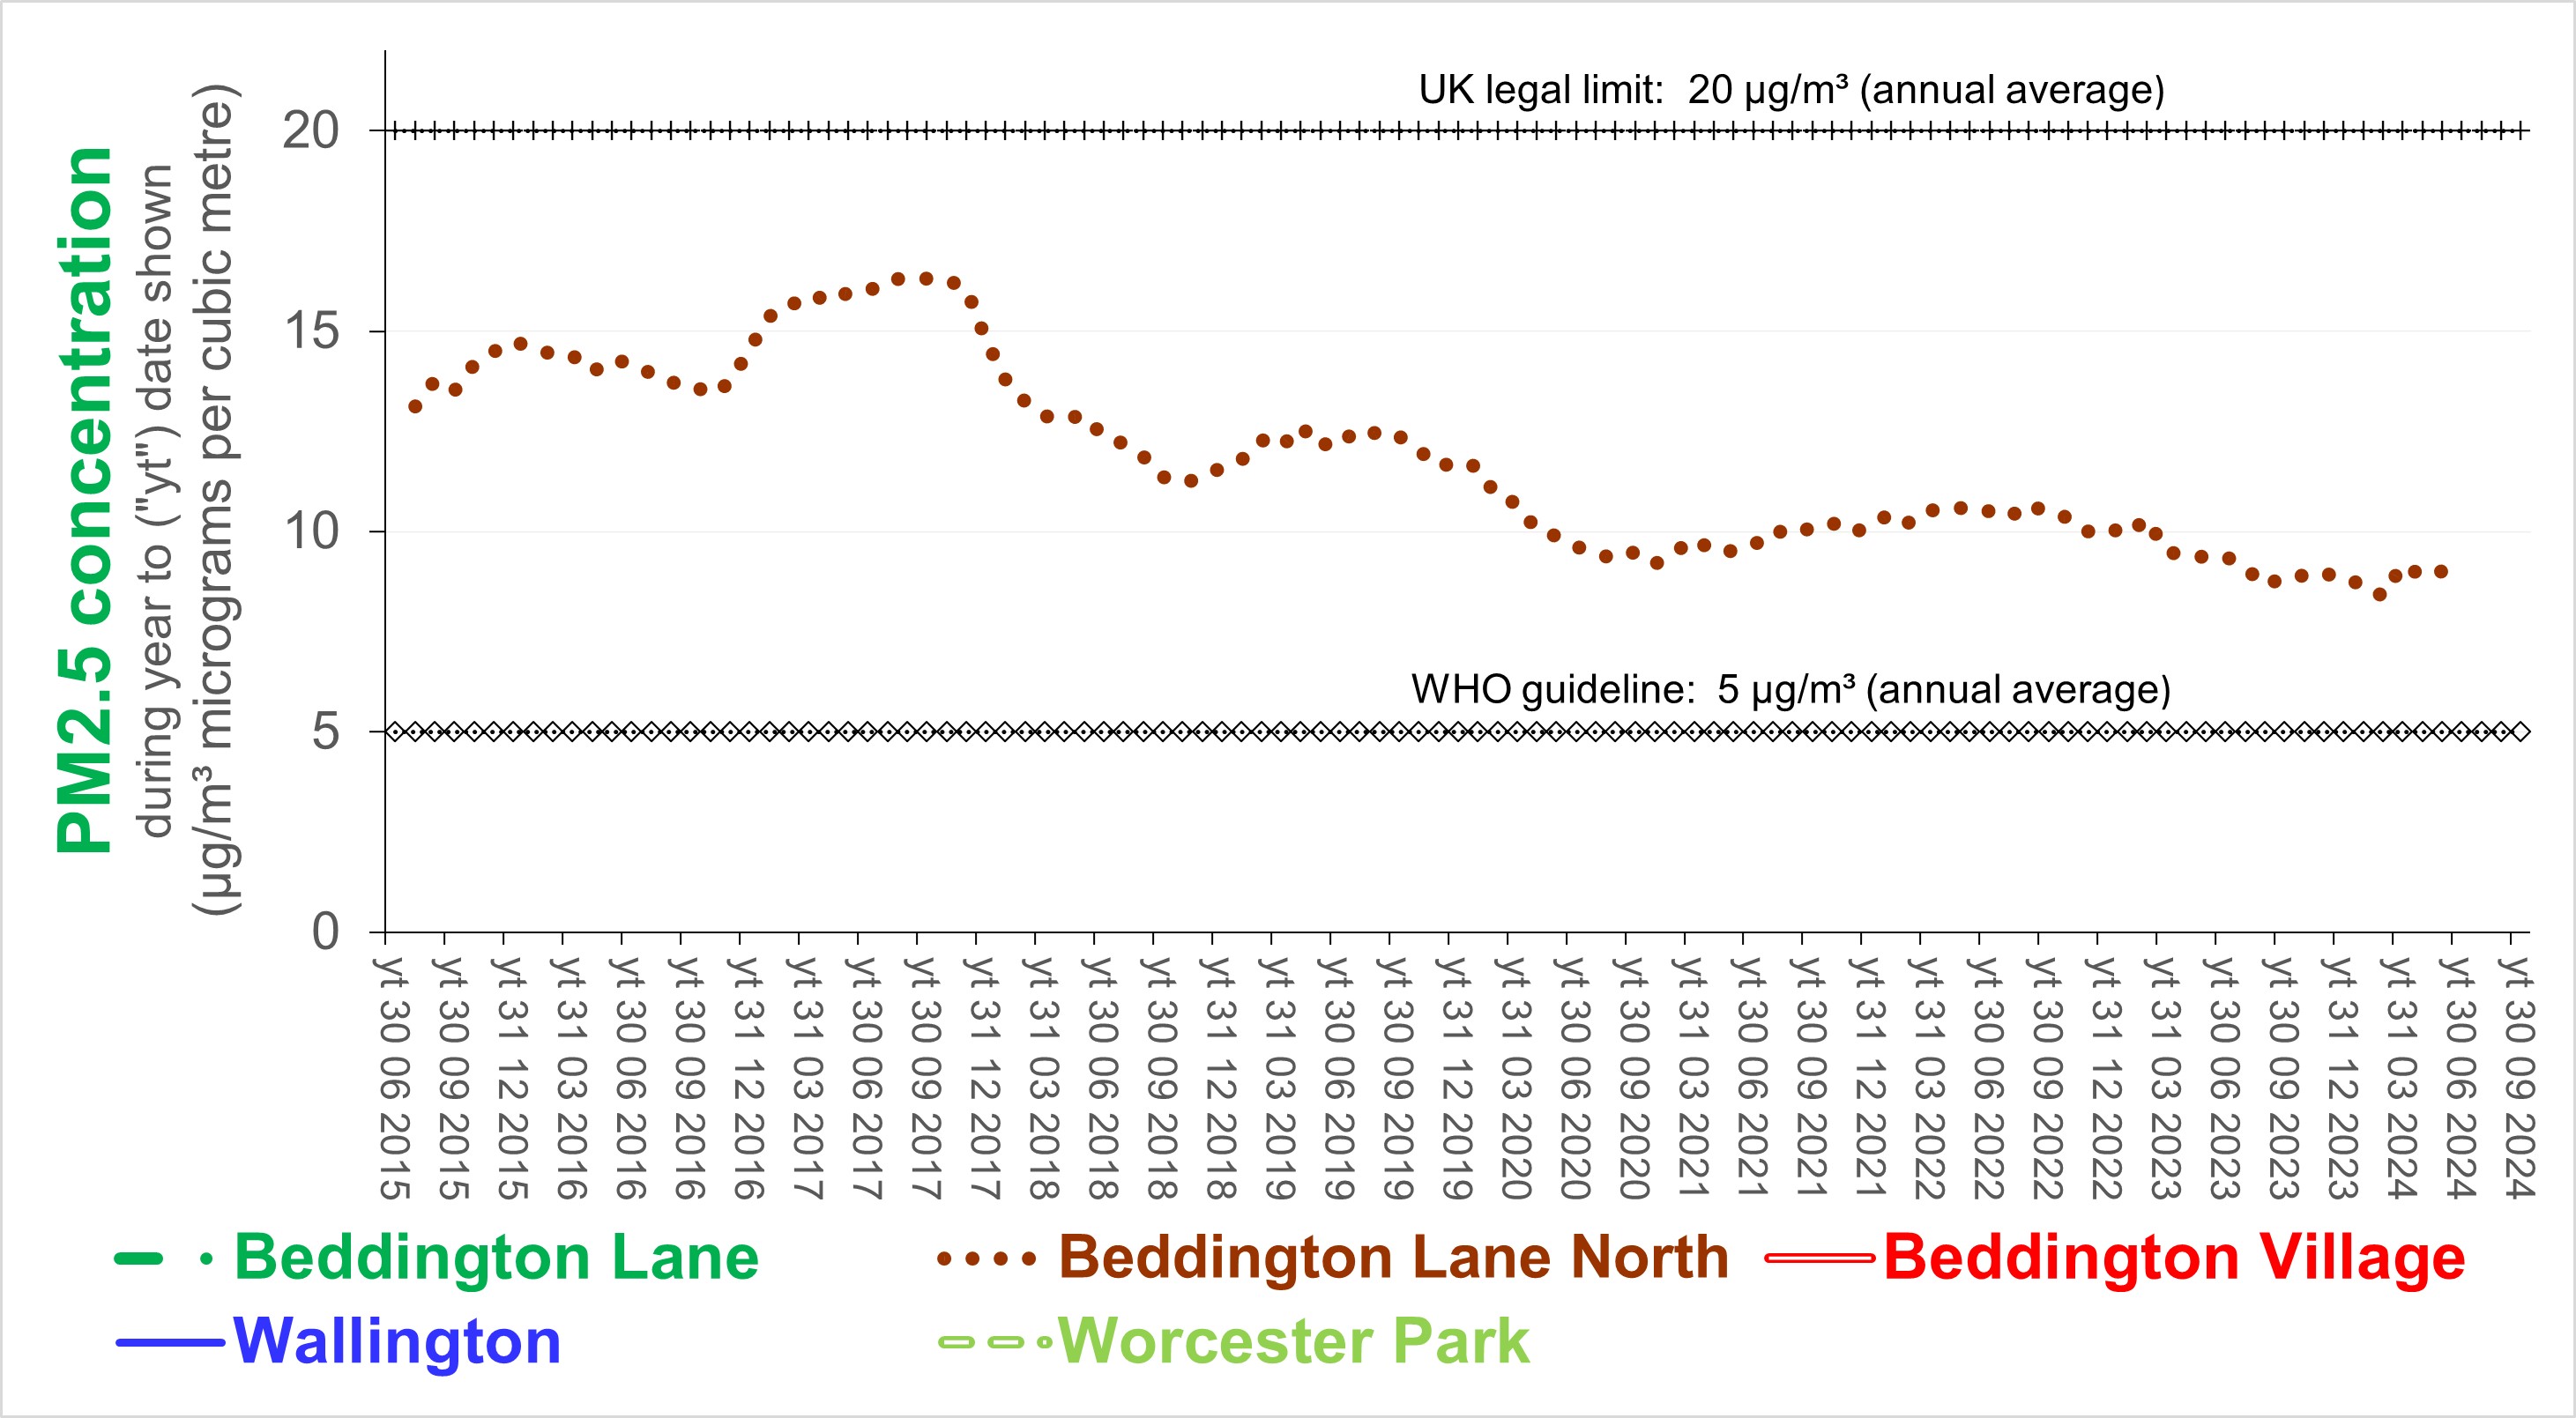
The following three charts illustrate trends in concentrations of NO2 and particulate matter (PM10 and PM2.5) as measured continuously (hourly) at government reference monitors. The data has been ratified prior to early 2024.
Source (based on): Air Quality England
|
|
For further information, please contact: info@airqualitymatters.uk |
| Back |