|
AIR QUALITY MATTERS |
|
Borough of Newham |
|
|
|
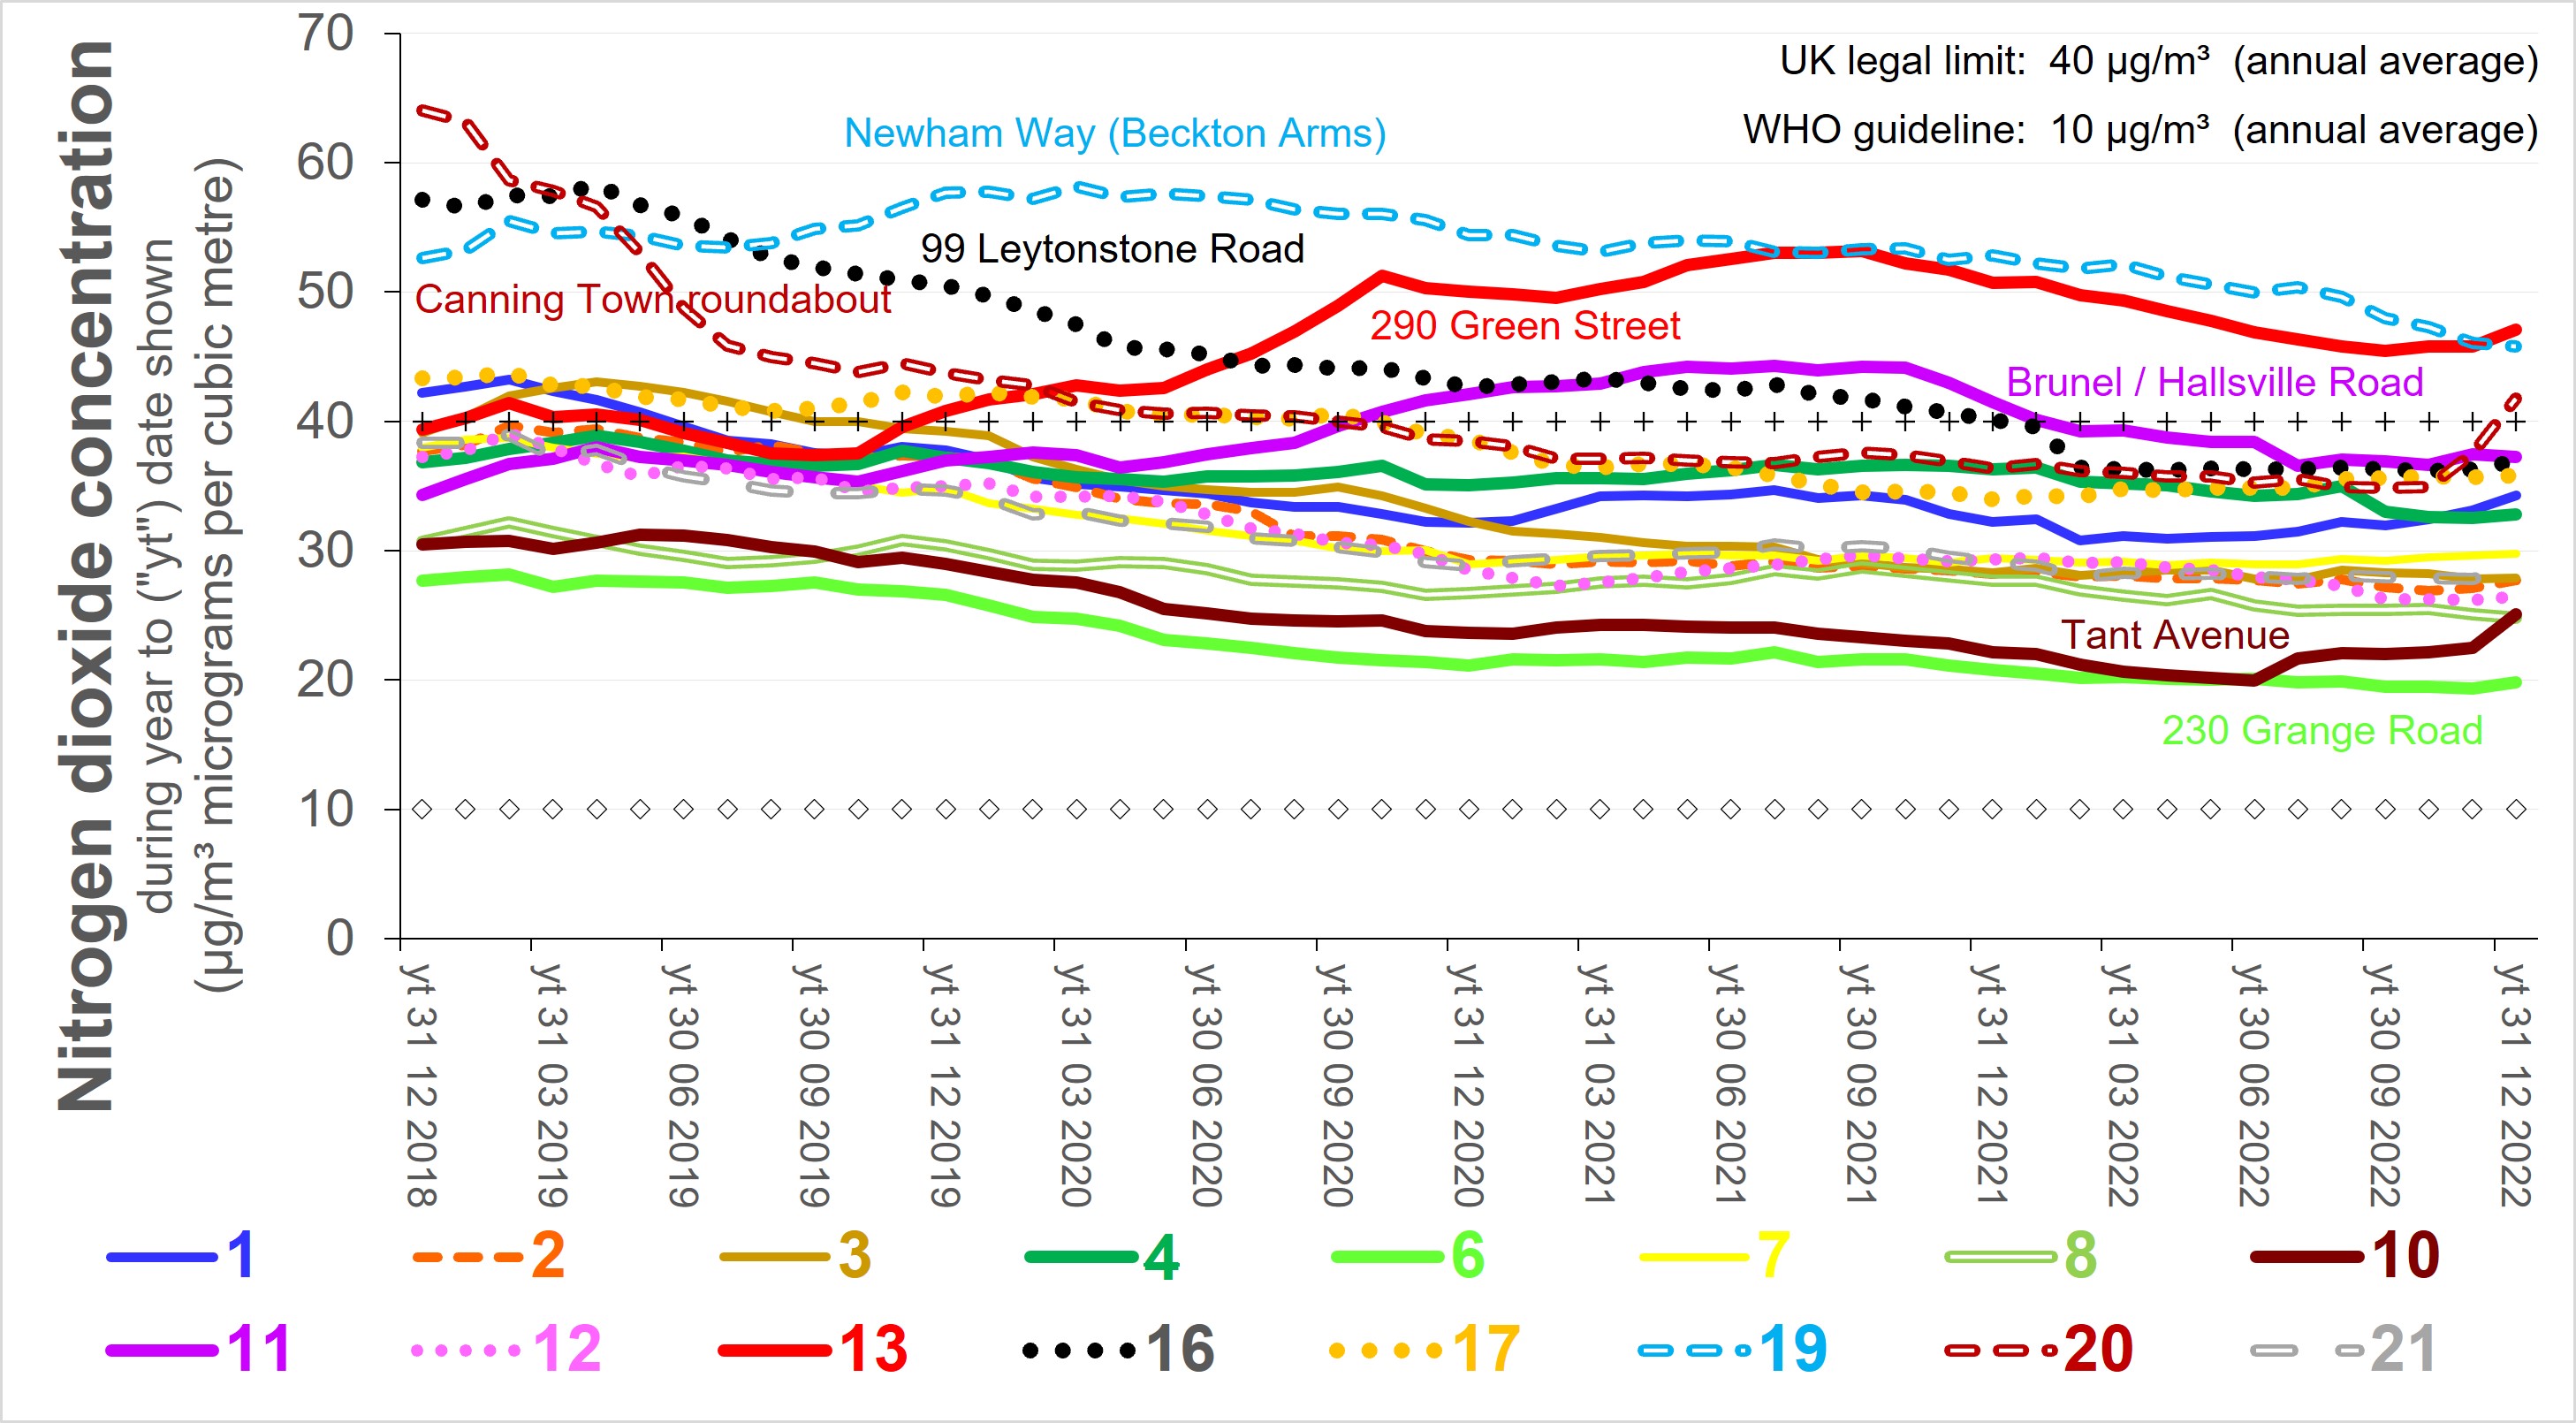
The following chart shows how the annual average
concentration of NO2
changed since 2018 at sites being monitored long-term in the Borough of
Newham. At most sites (and all sites for the most recent
period), the trend is downards. Concentrations at four of
the sites exceed the UK legal limit. The lowest
concentration is double the WHO guideline.
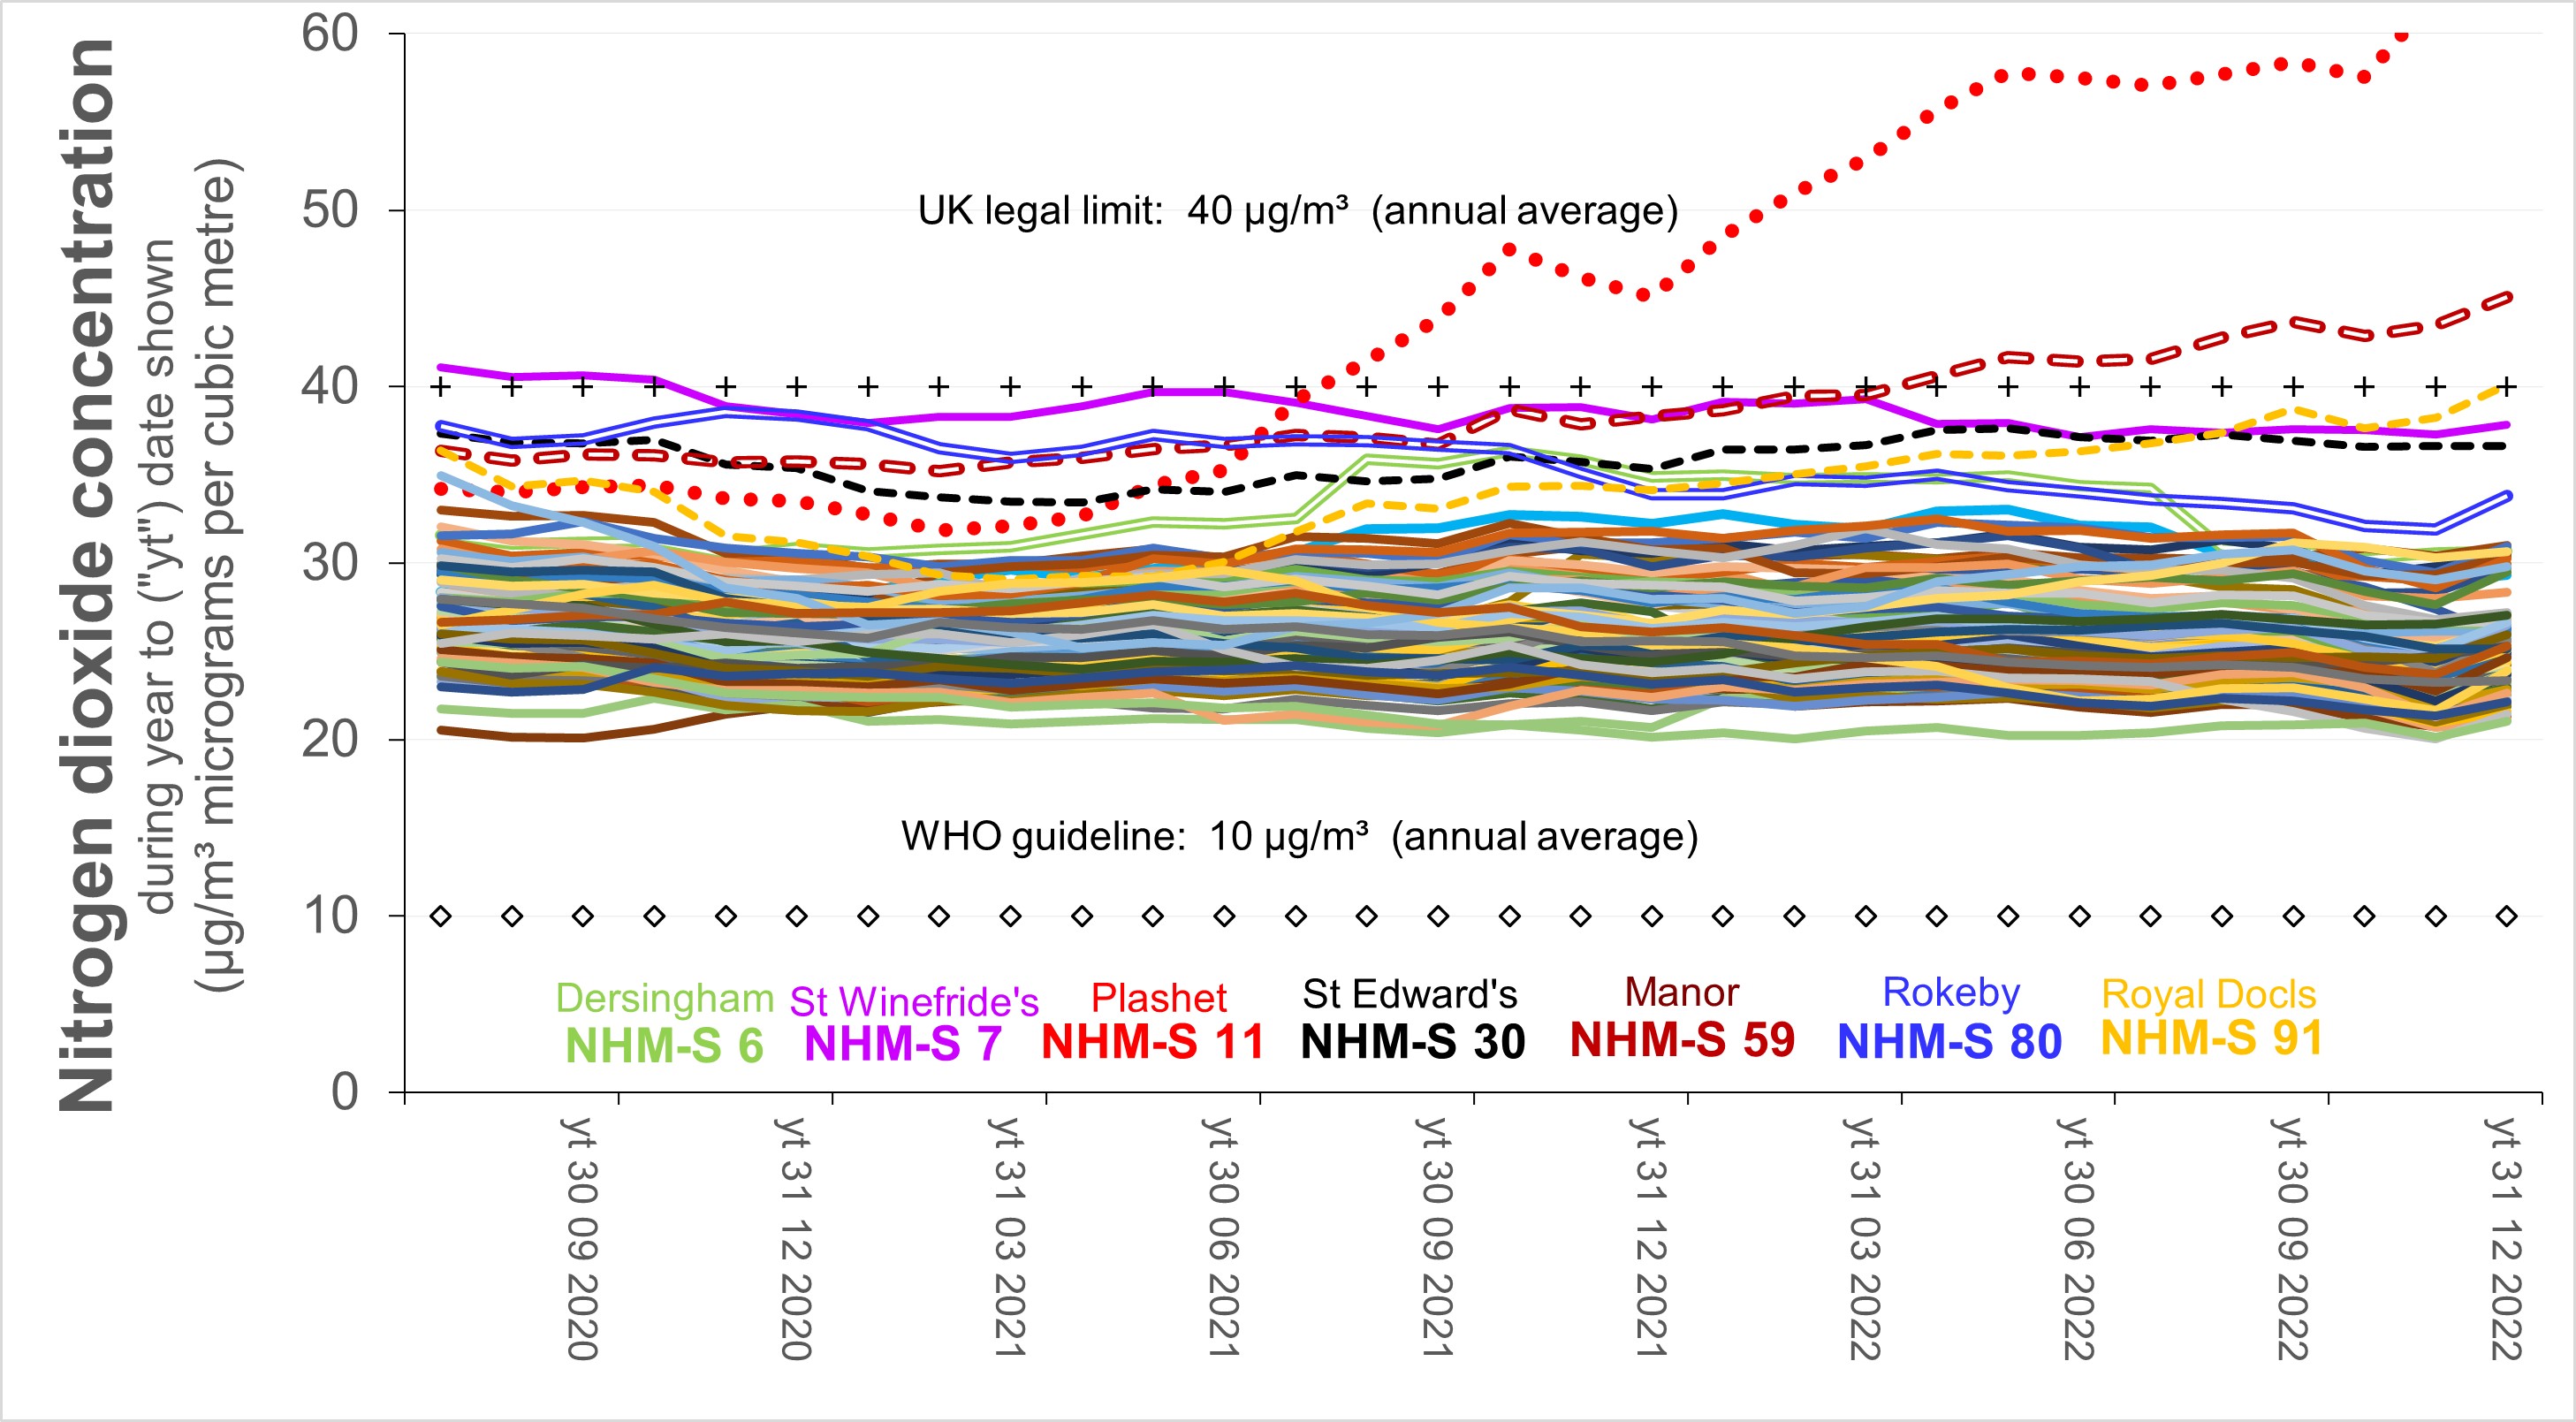
The chart below shows how the annual average concentration of NO2 changed since mid-2020 at sites adjacent schools in Newham. At most sites, the trend was flat. At sites where NO2 concentrations were greatest, the trend for much of the period shown was rising. The trend for the most recent period is downards at almost all sites - no data for 2024. Concentrations exceeded the legal limit adjacent one school and are generally between two and three times greater than the WHO guideline.
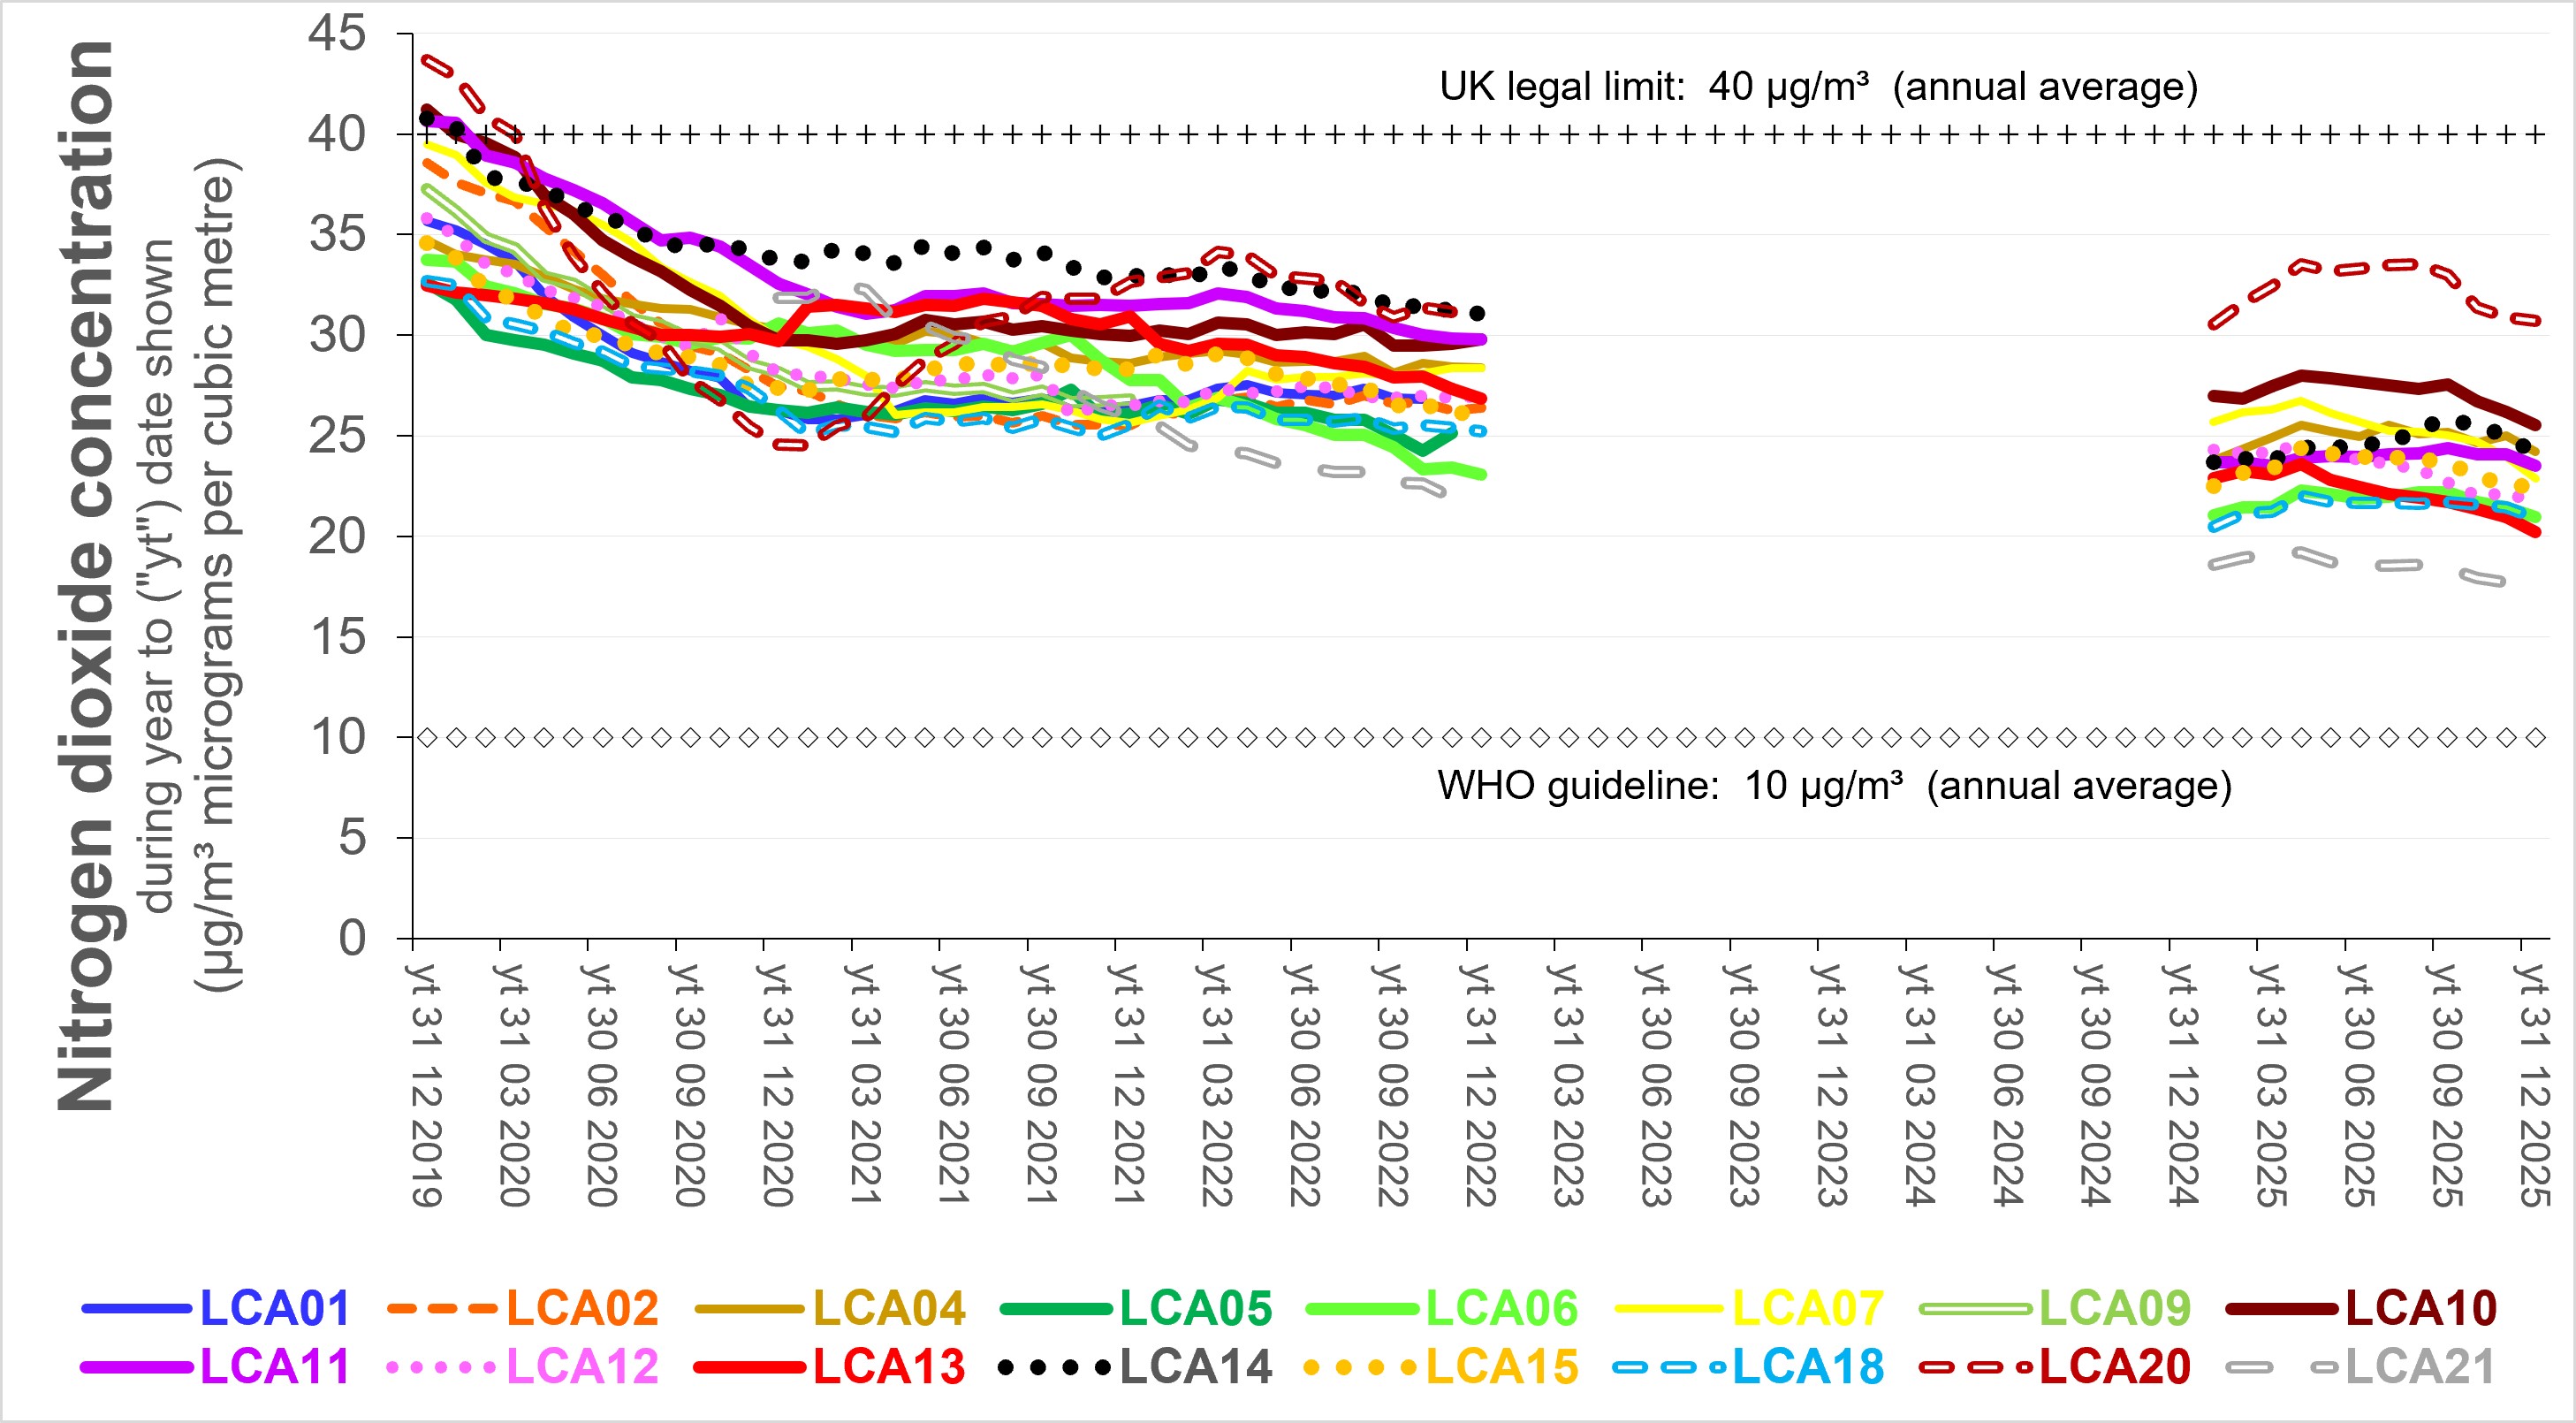
The chart below shows how the annual average
concentration of NO2
changed since 2019 at sites adjacent London City Airport.
There is no data for 2023.
Between 2020 and 2025, concentrations have tended to
decline slowly.
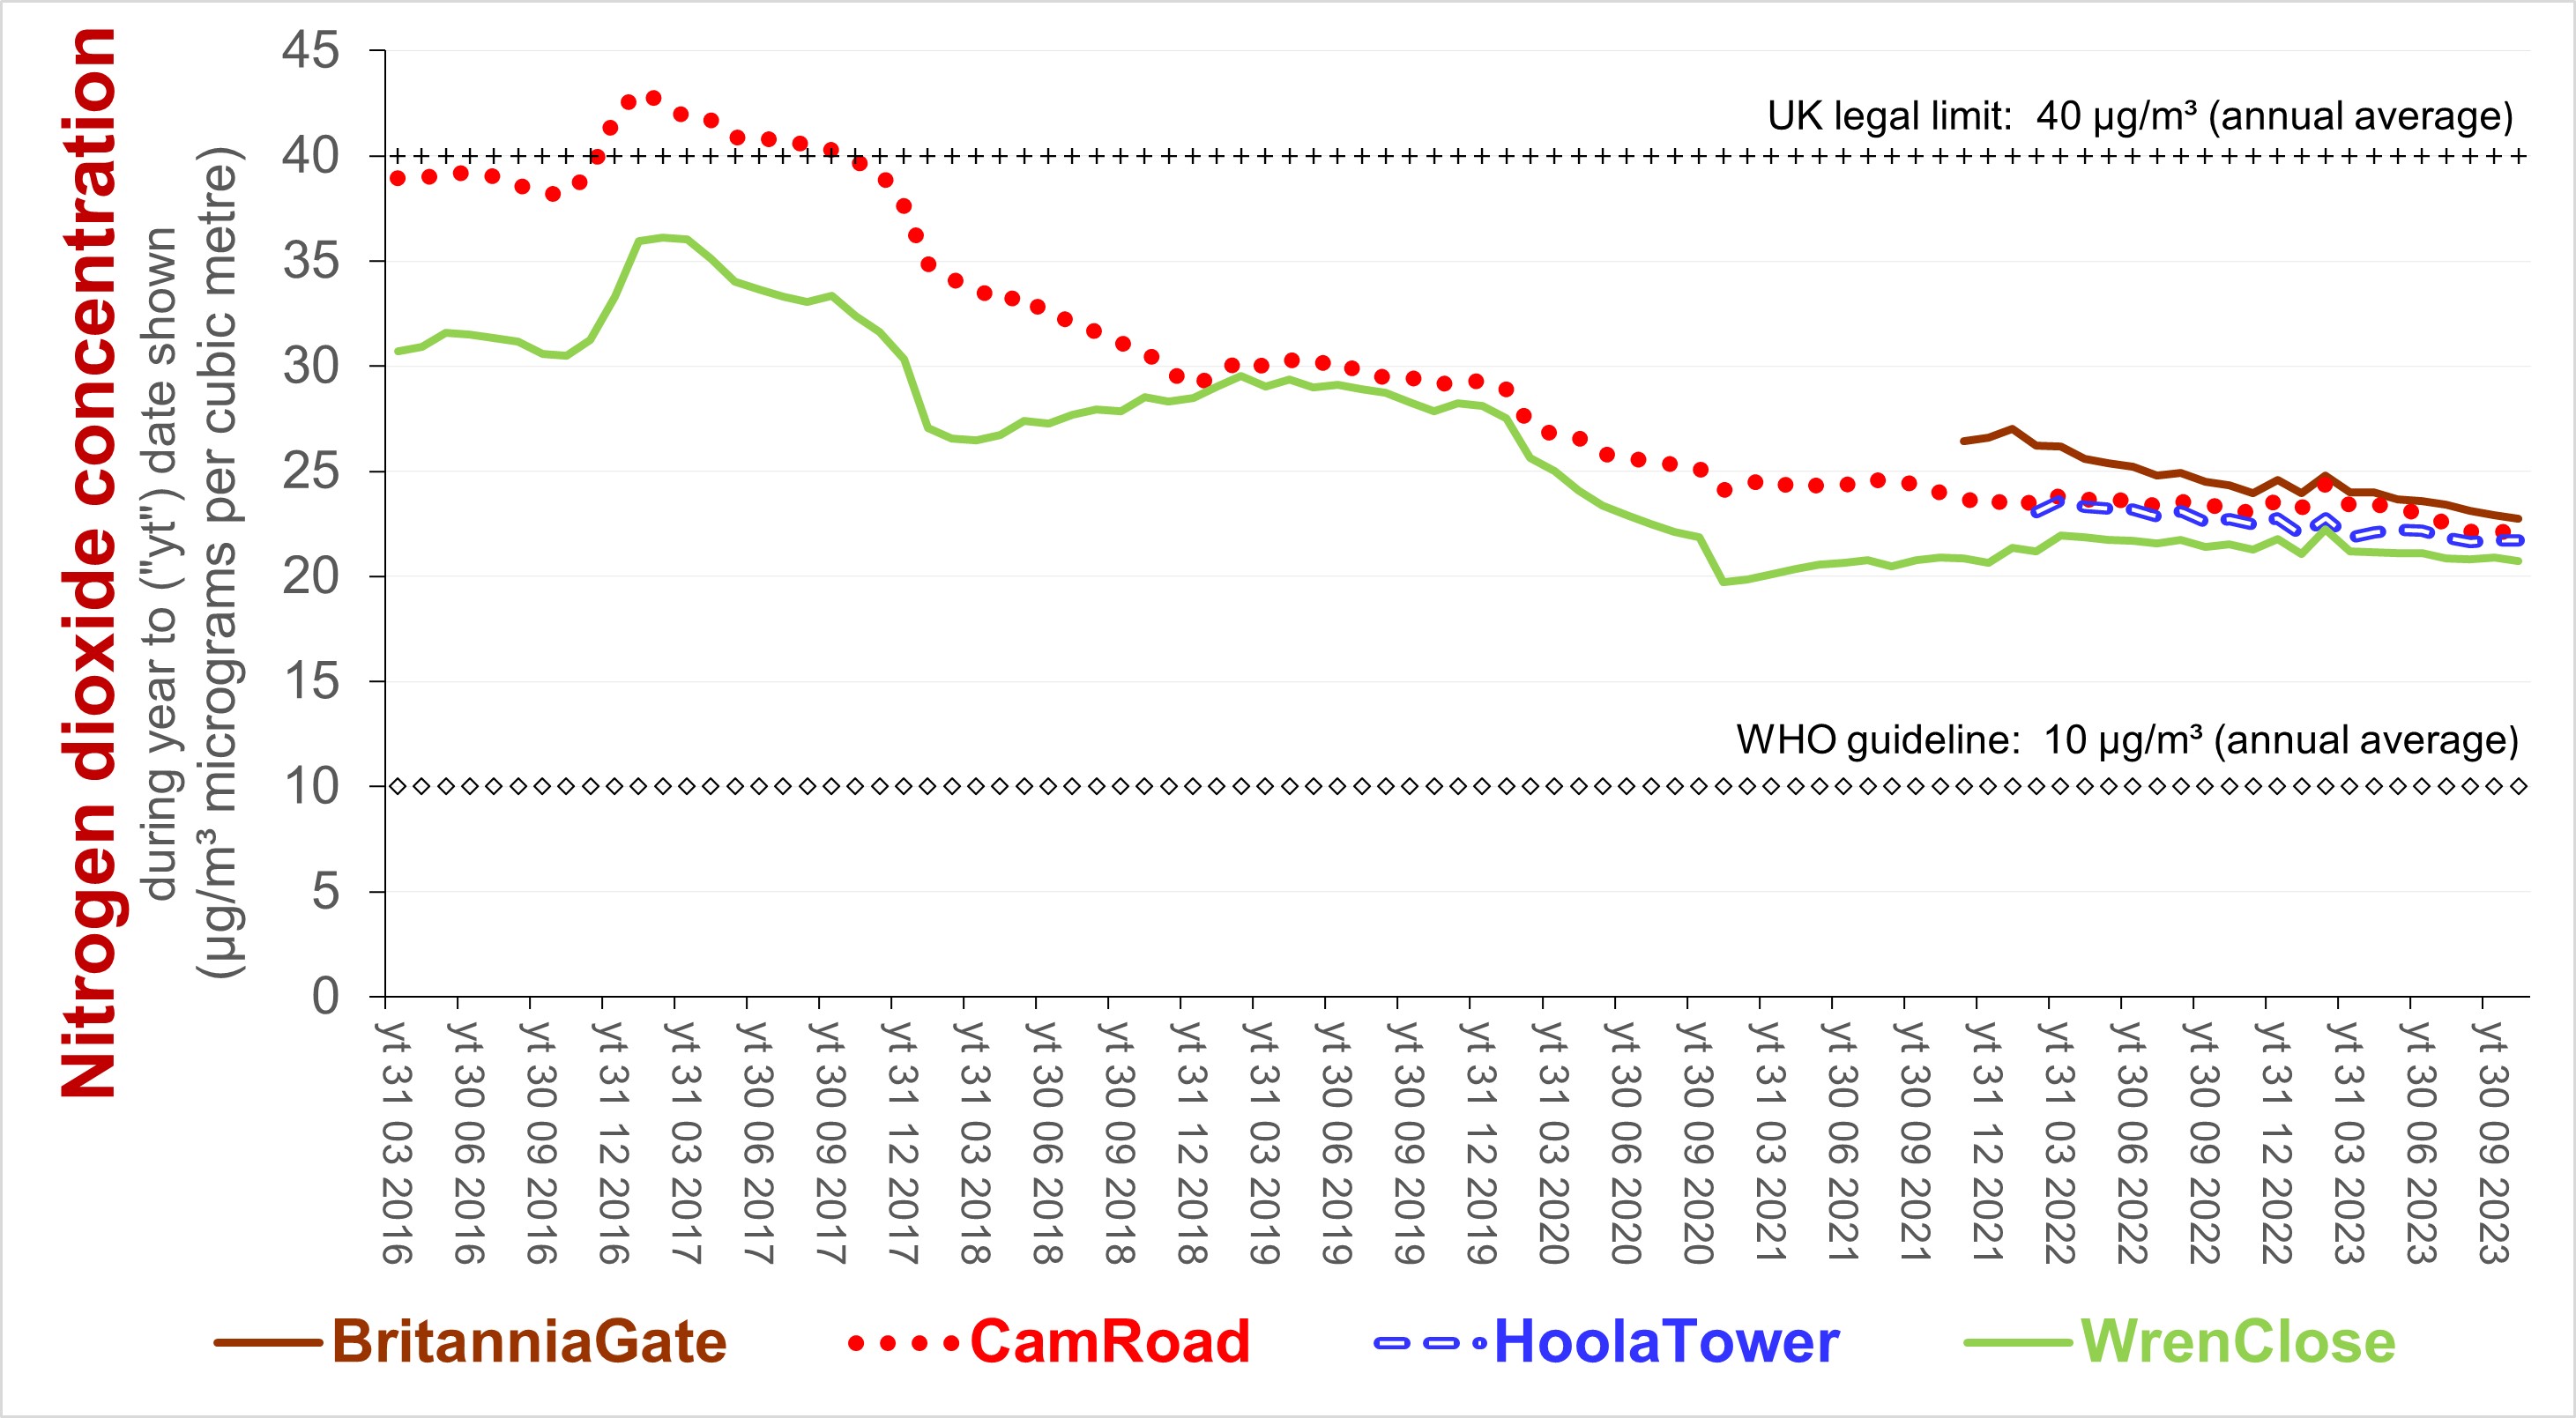
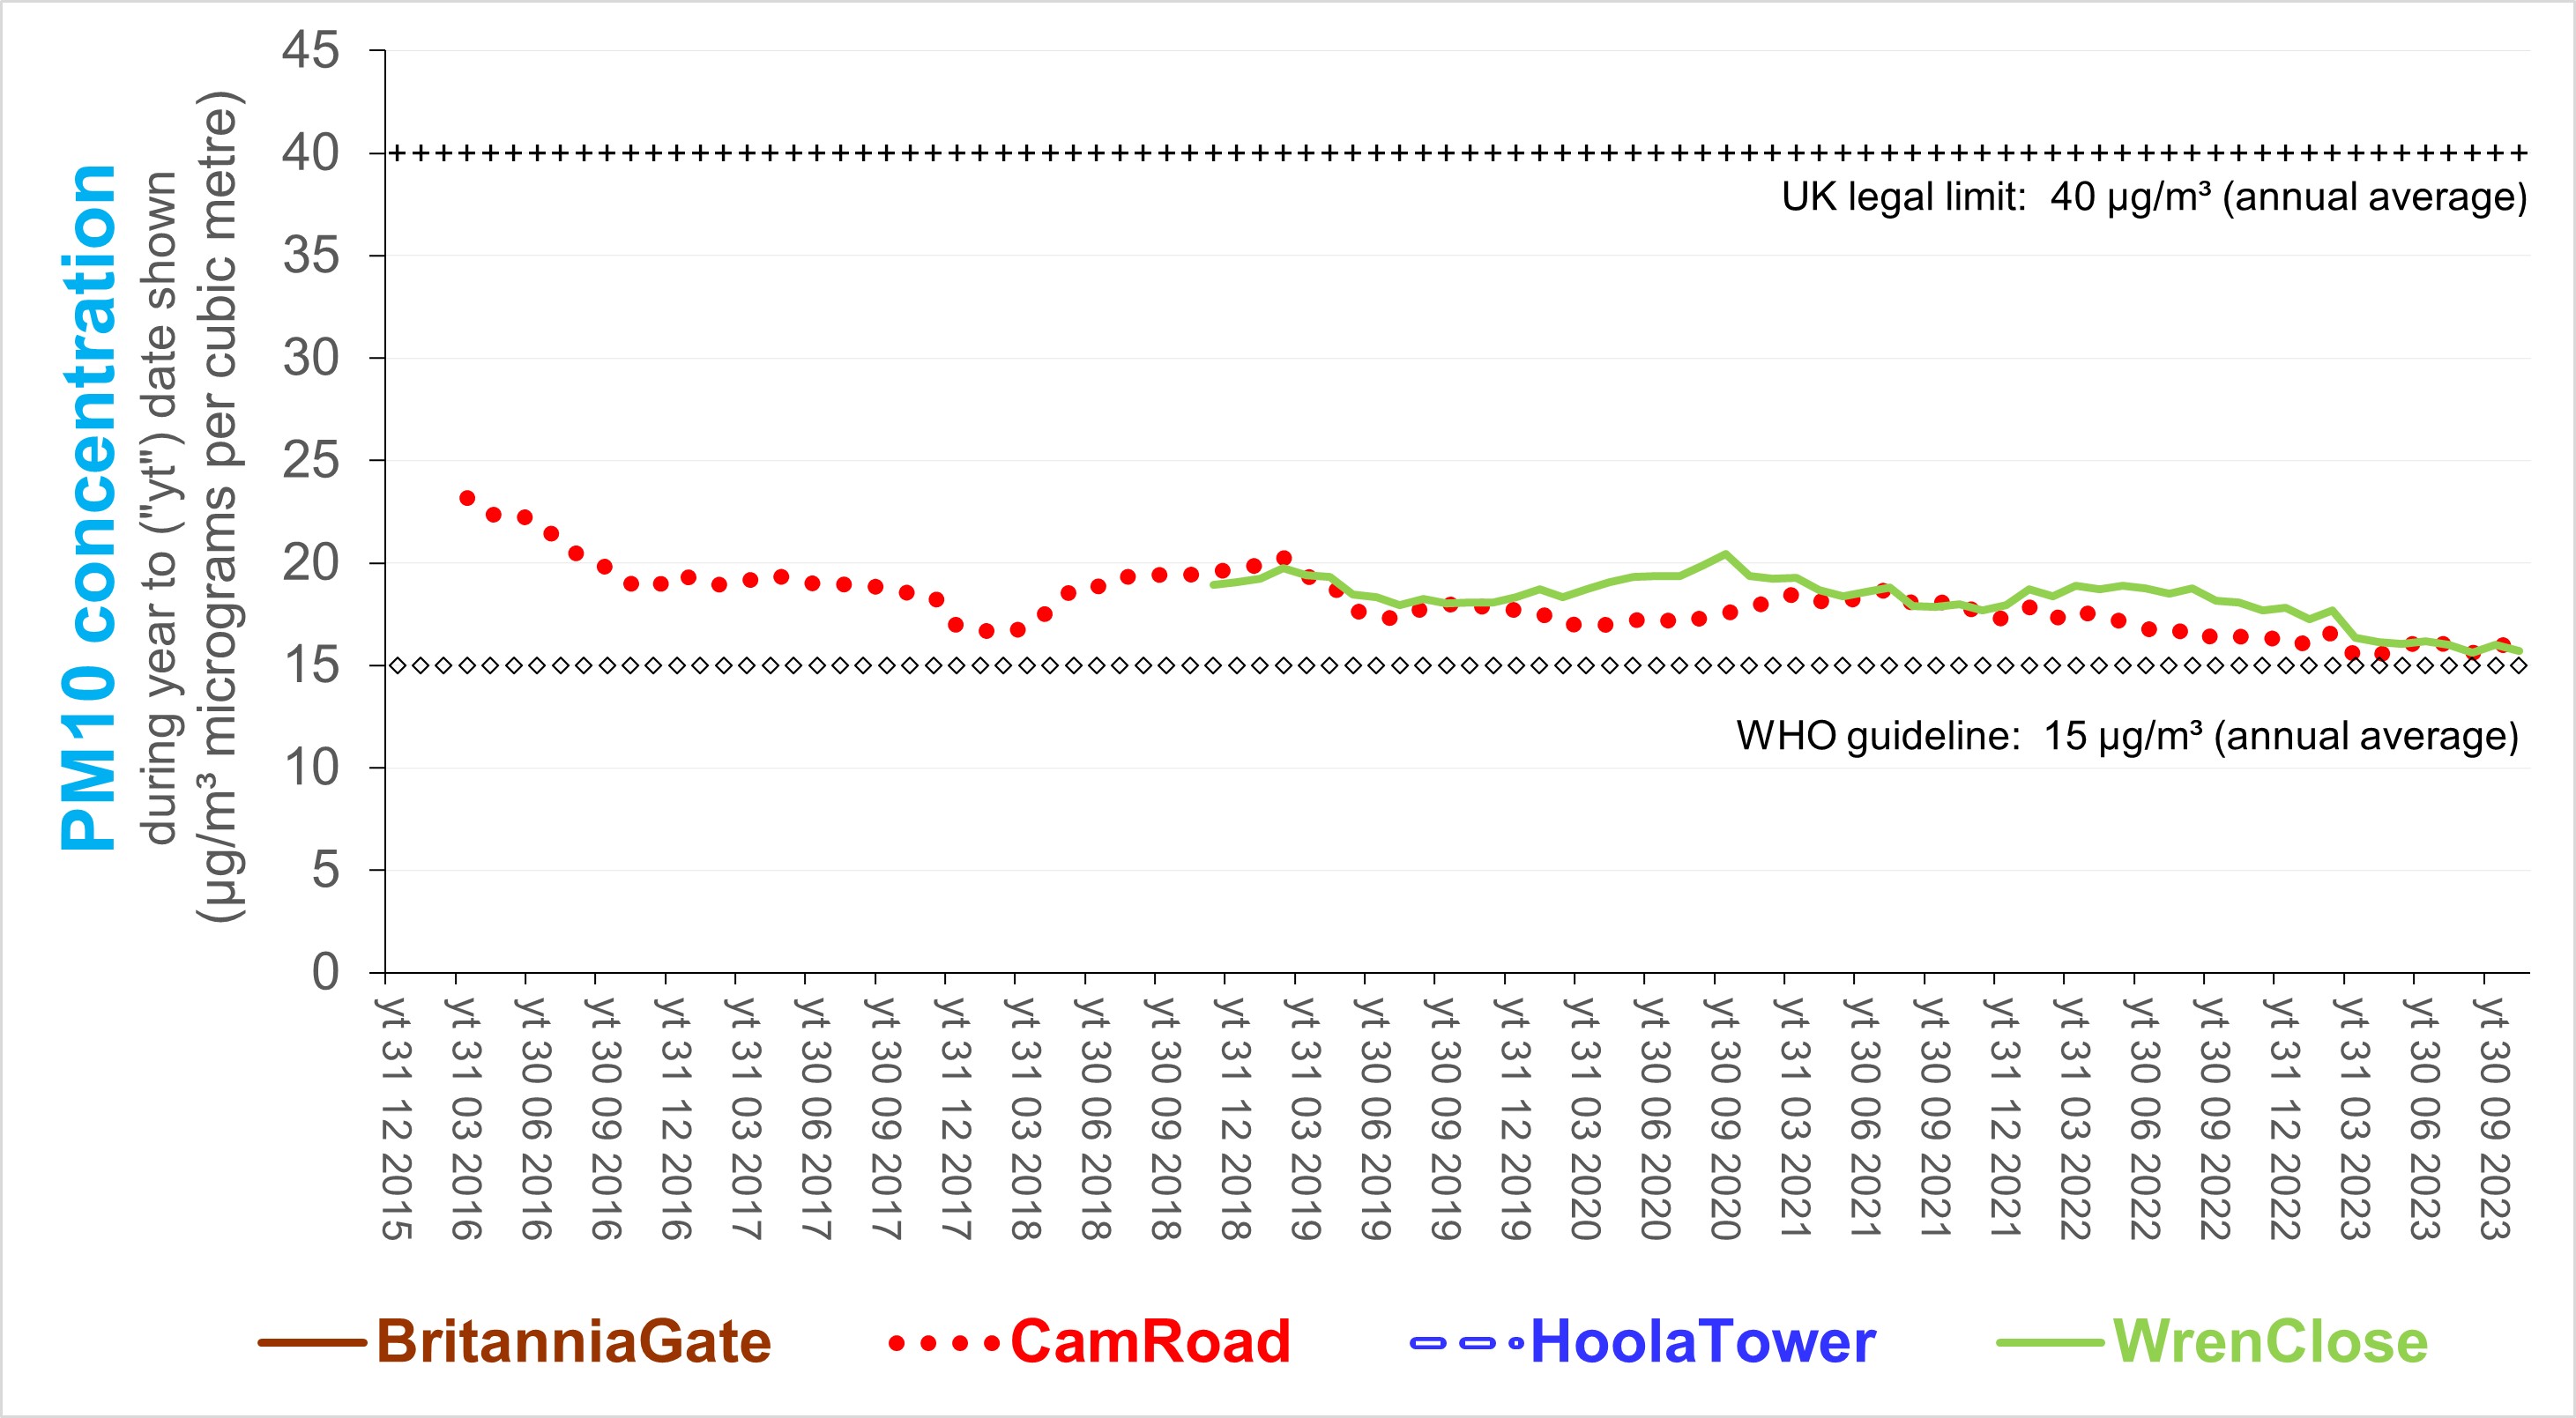
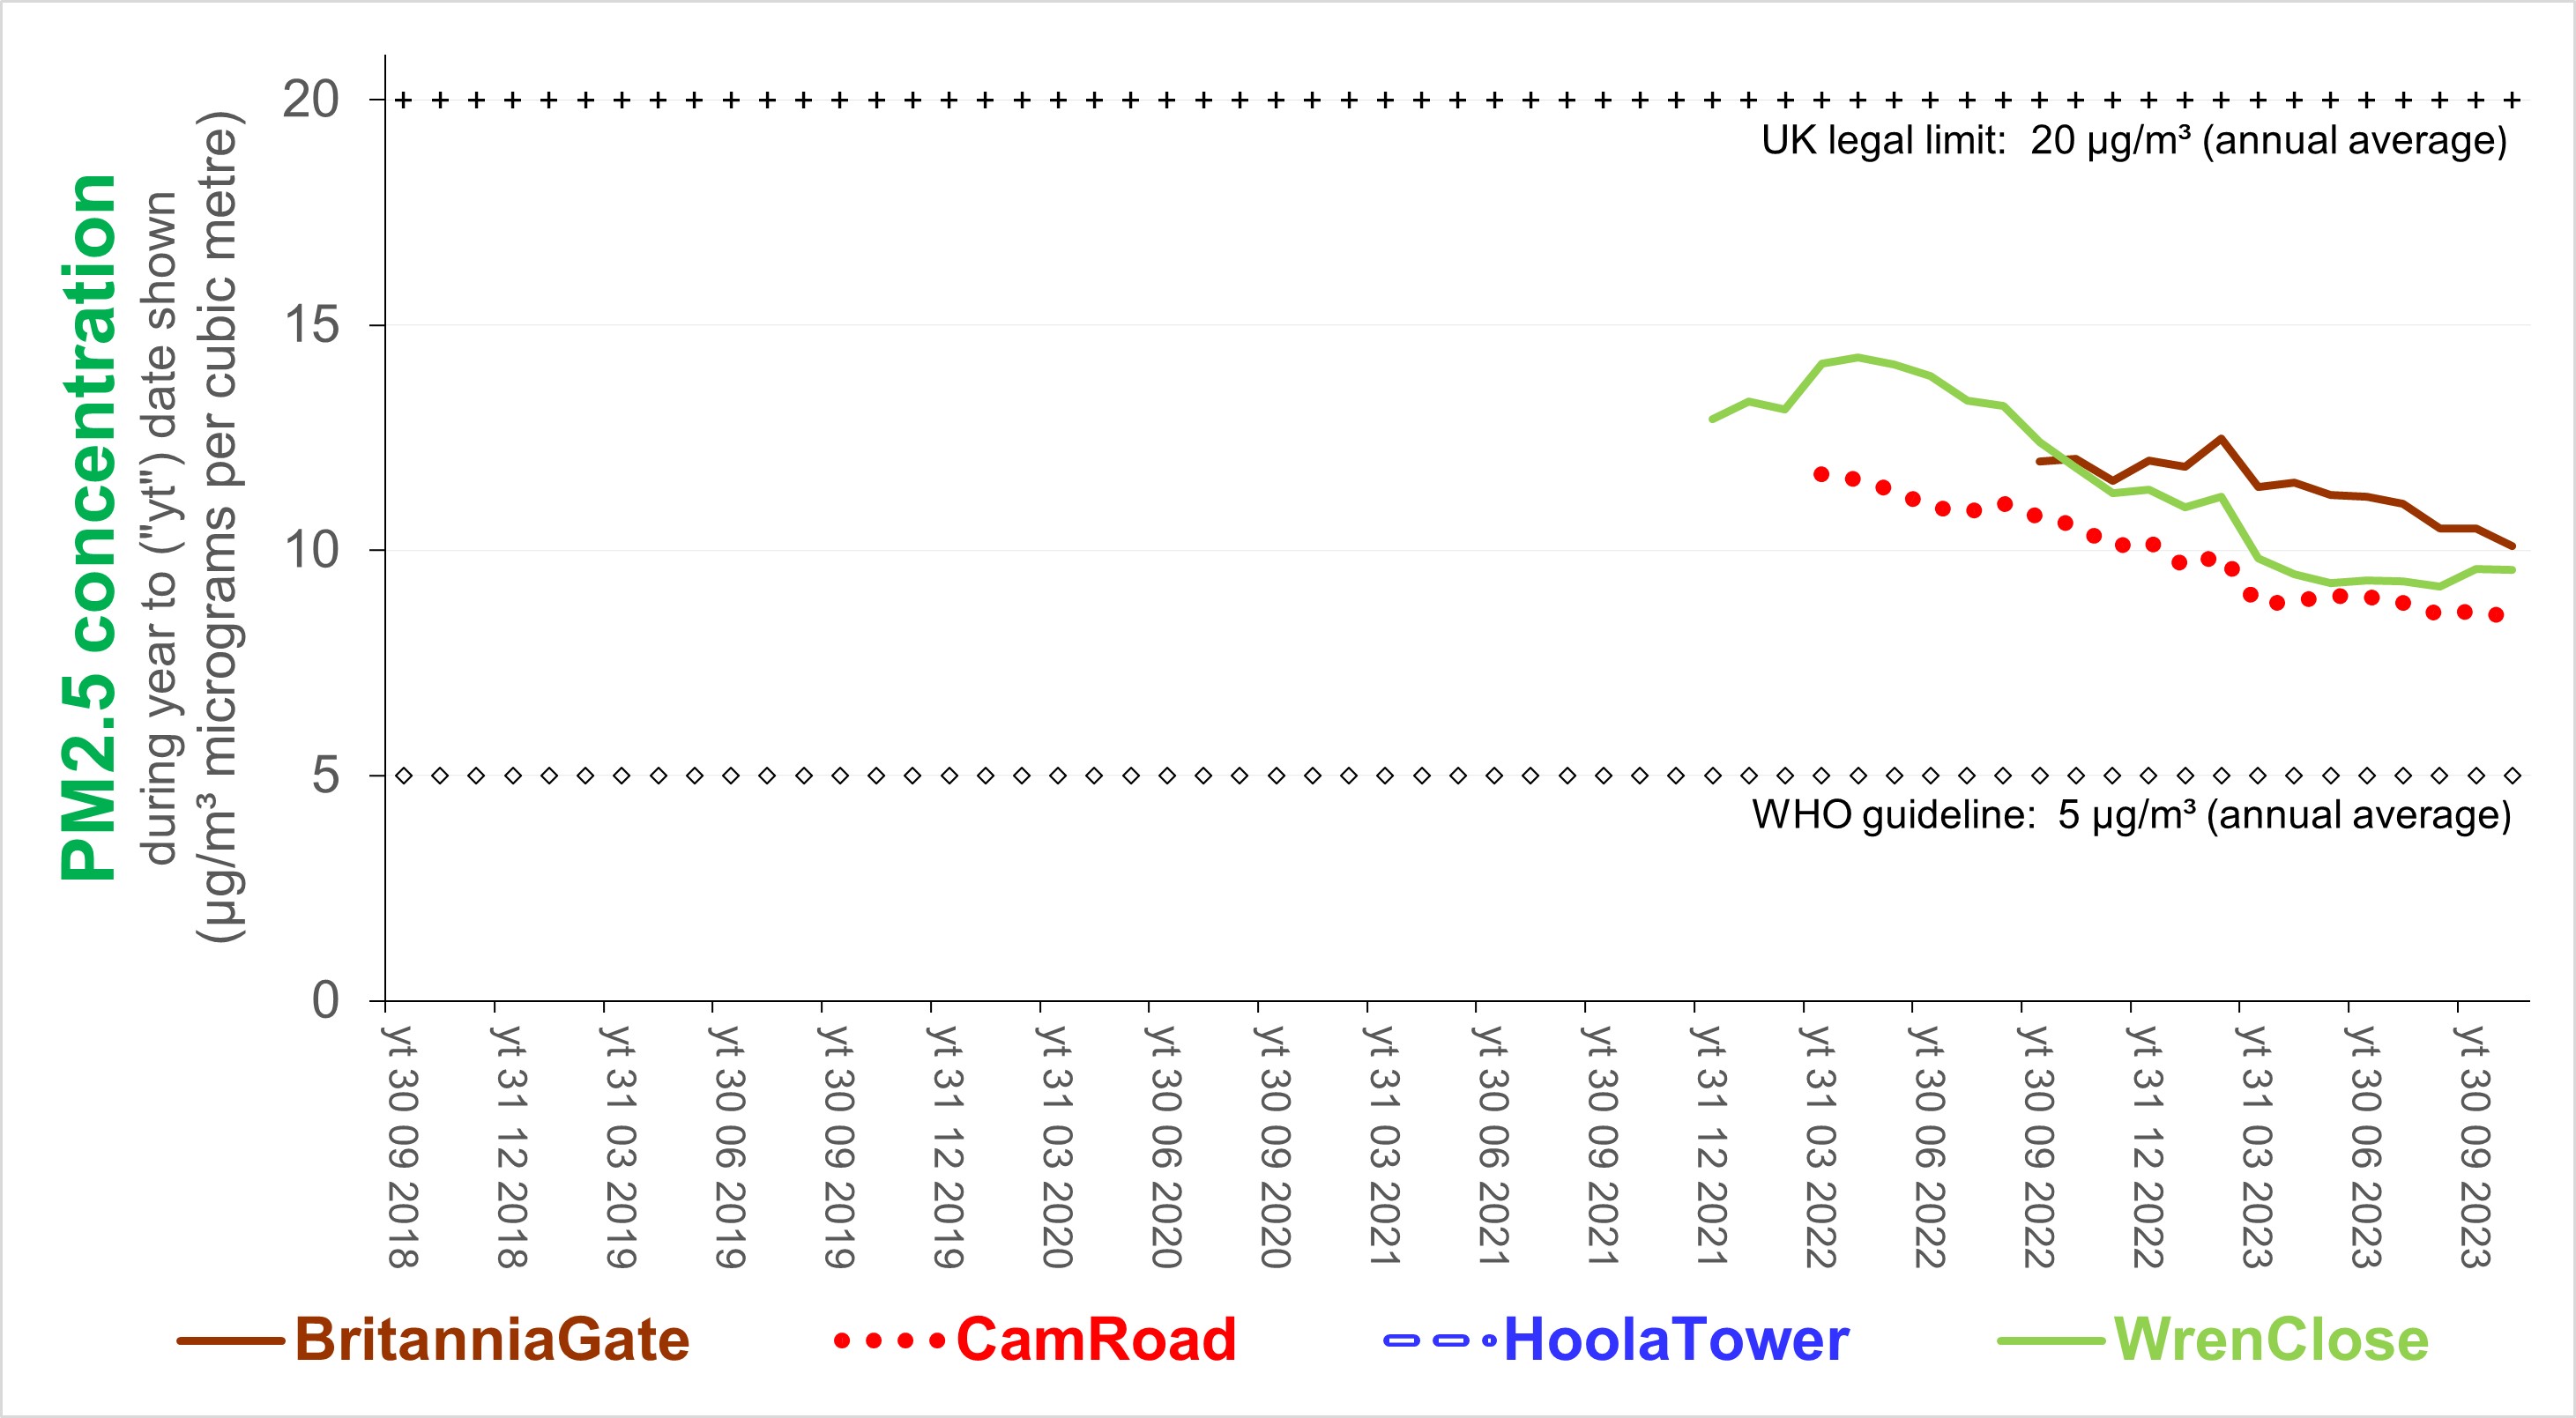
The following two charts show trends in the concentration of
nitrogen dioxide and particulate matter PM10 in
Newham as measured automatically at government reference sites
over the last few years.
Source: based on
London Air
and
Air Quality England
Data indicating concentrations of NO2 and PM2.5 are being reported for "nodes" by Breathe London at several locations across Newham. Indicative data for the 12 months ending 30 June 2026 presented below for one of these. 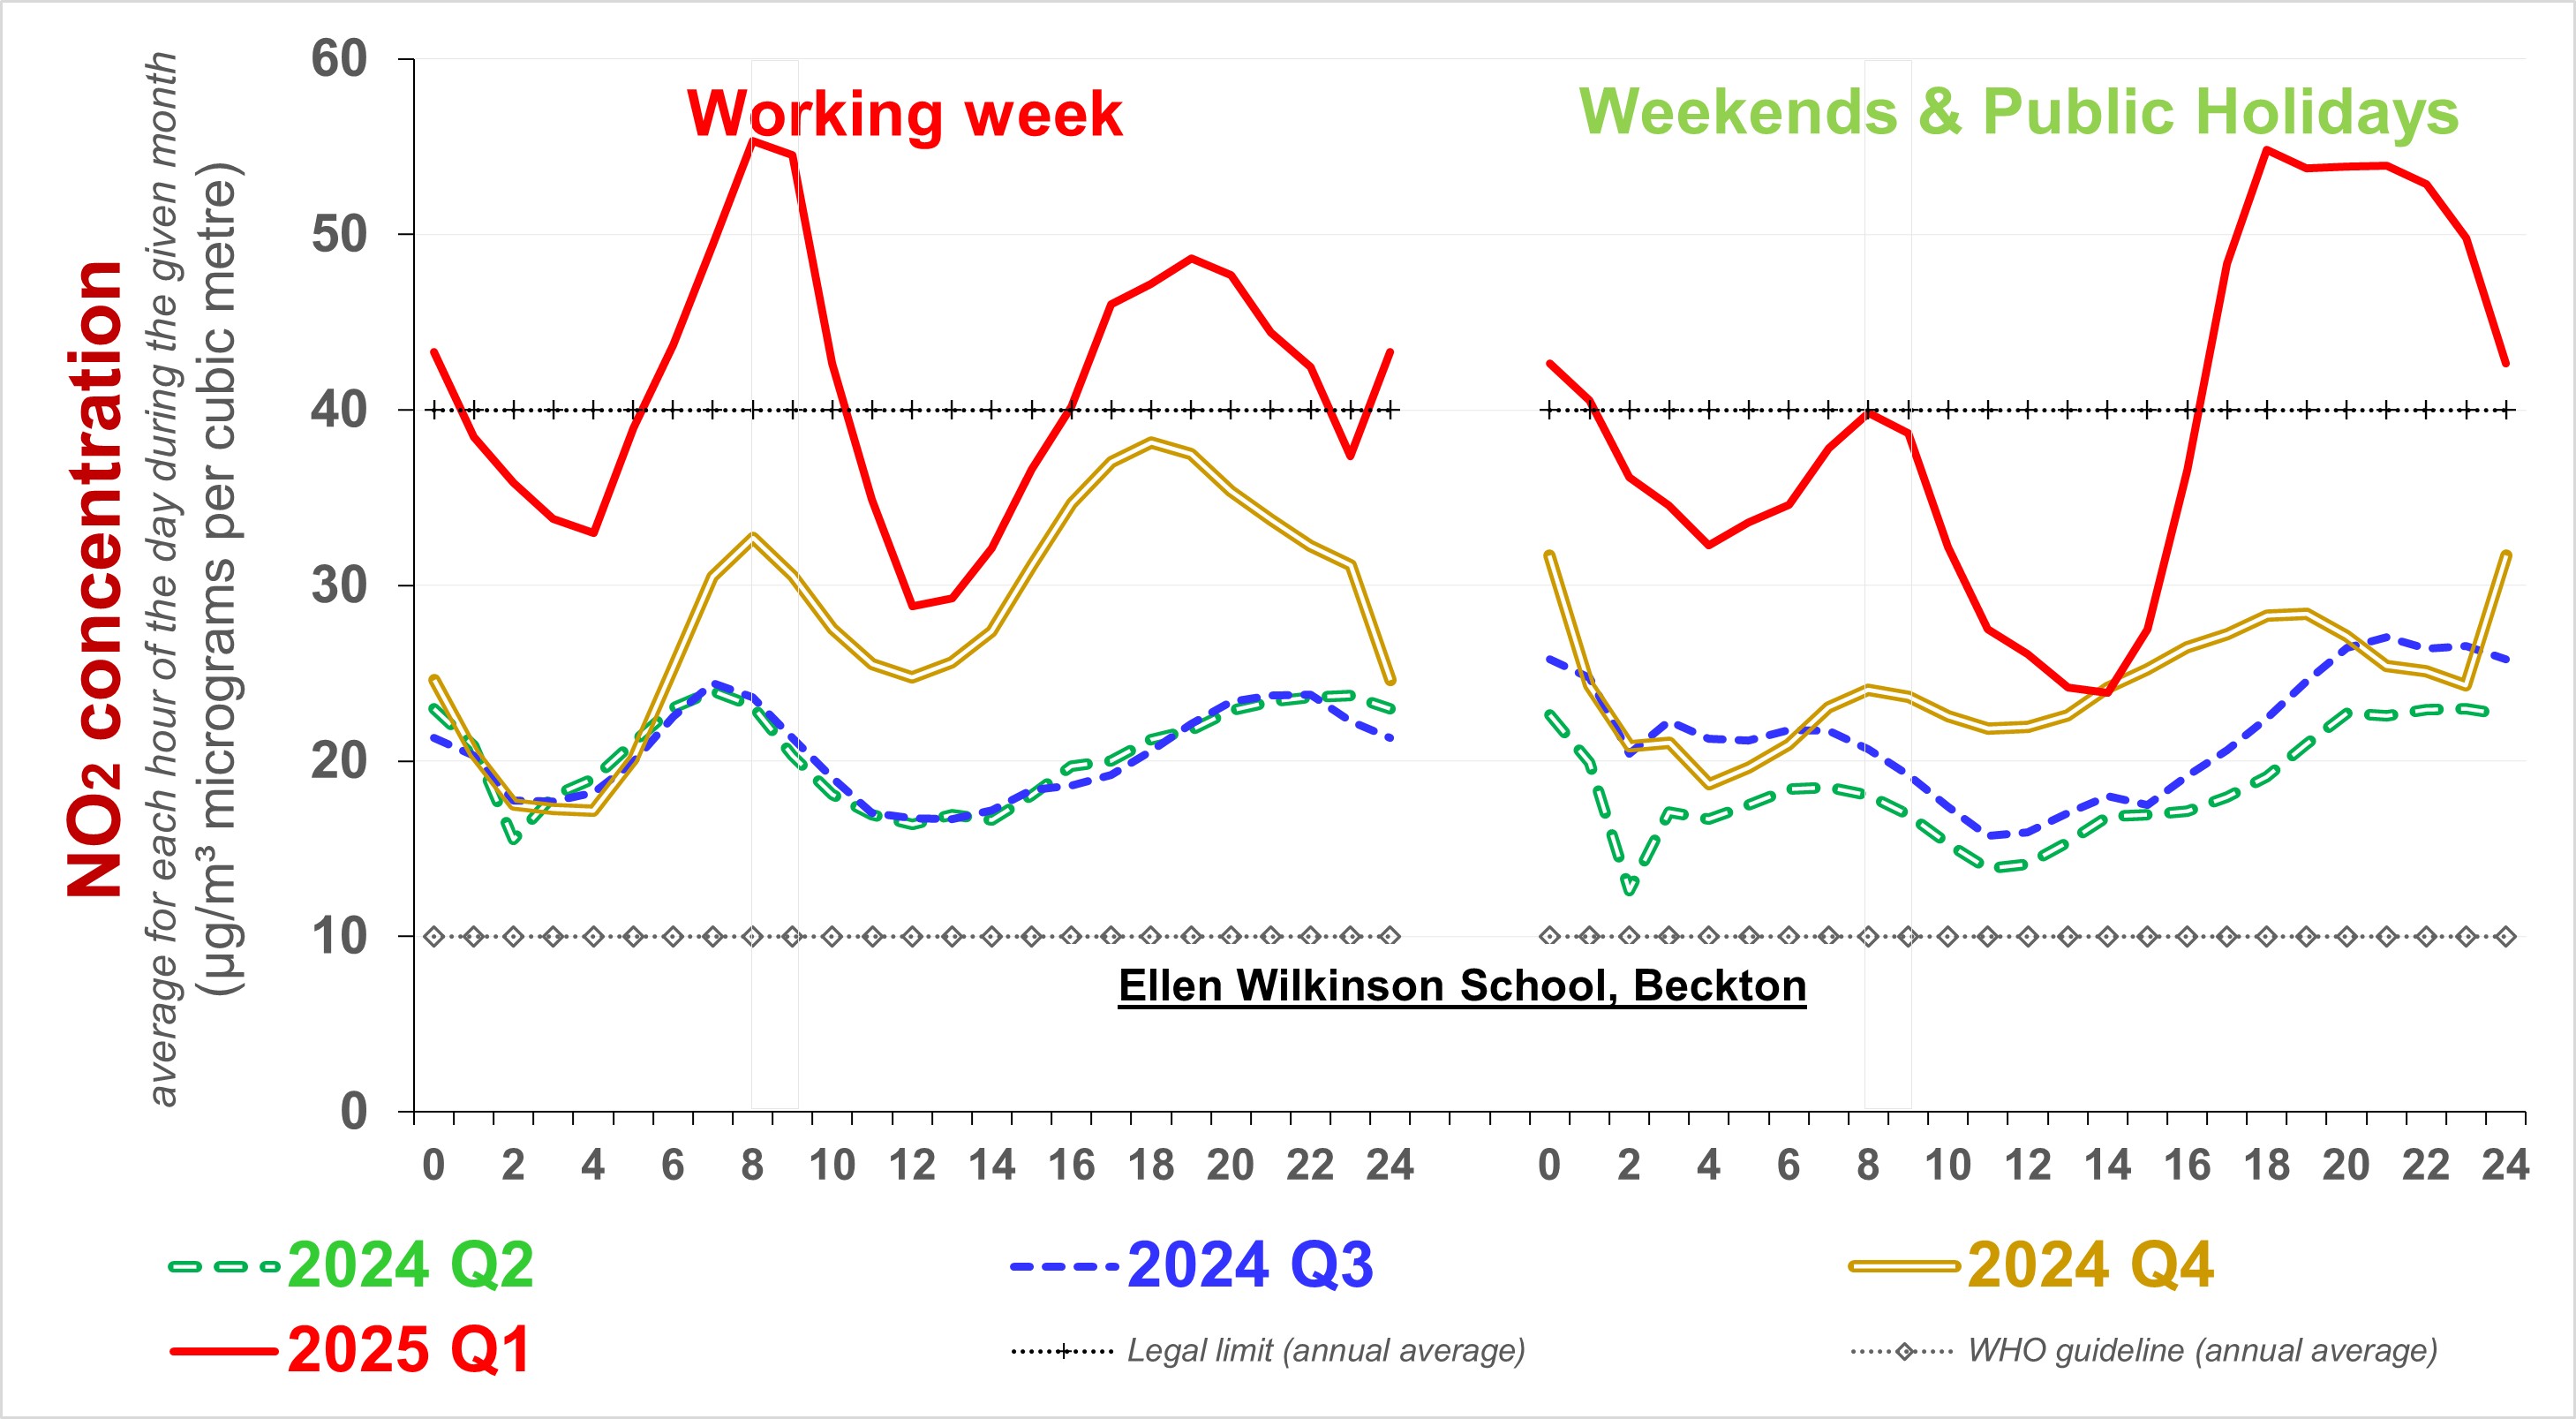 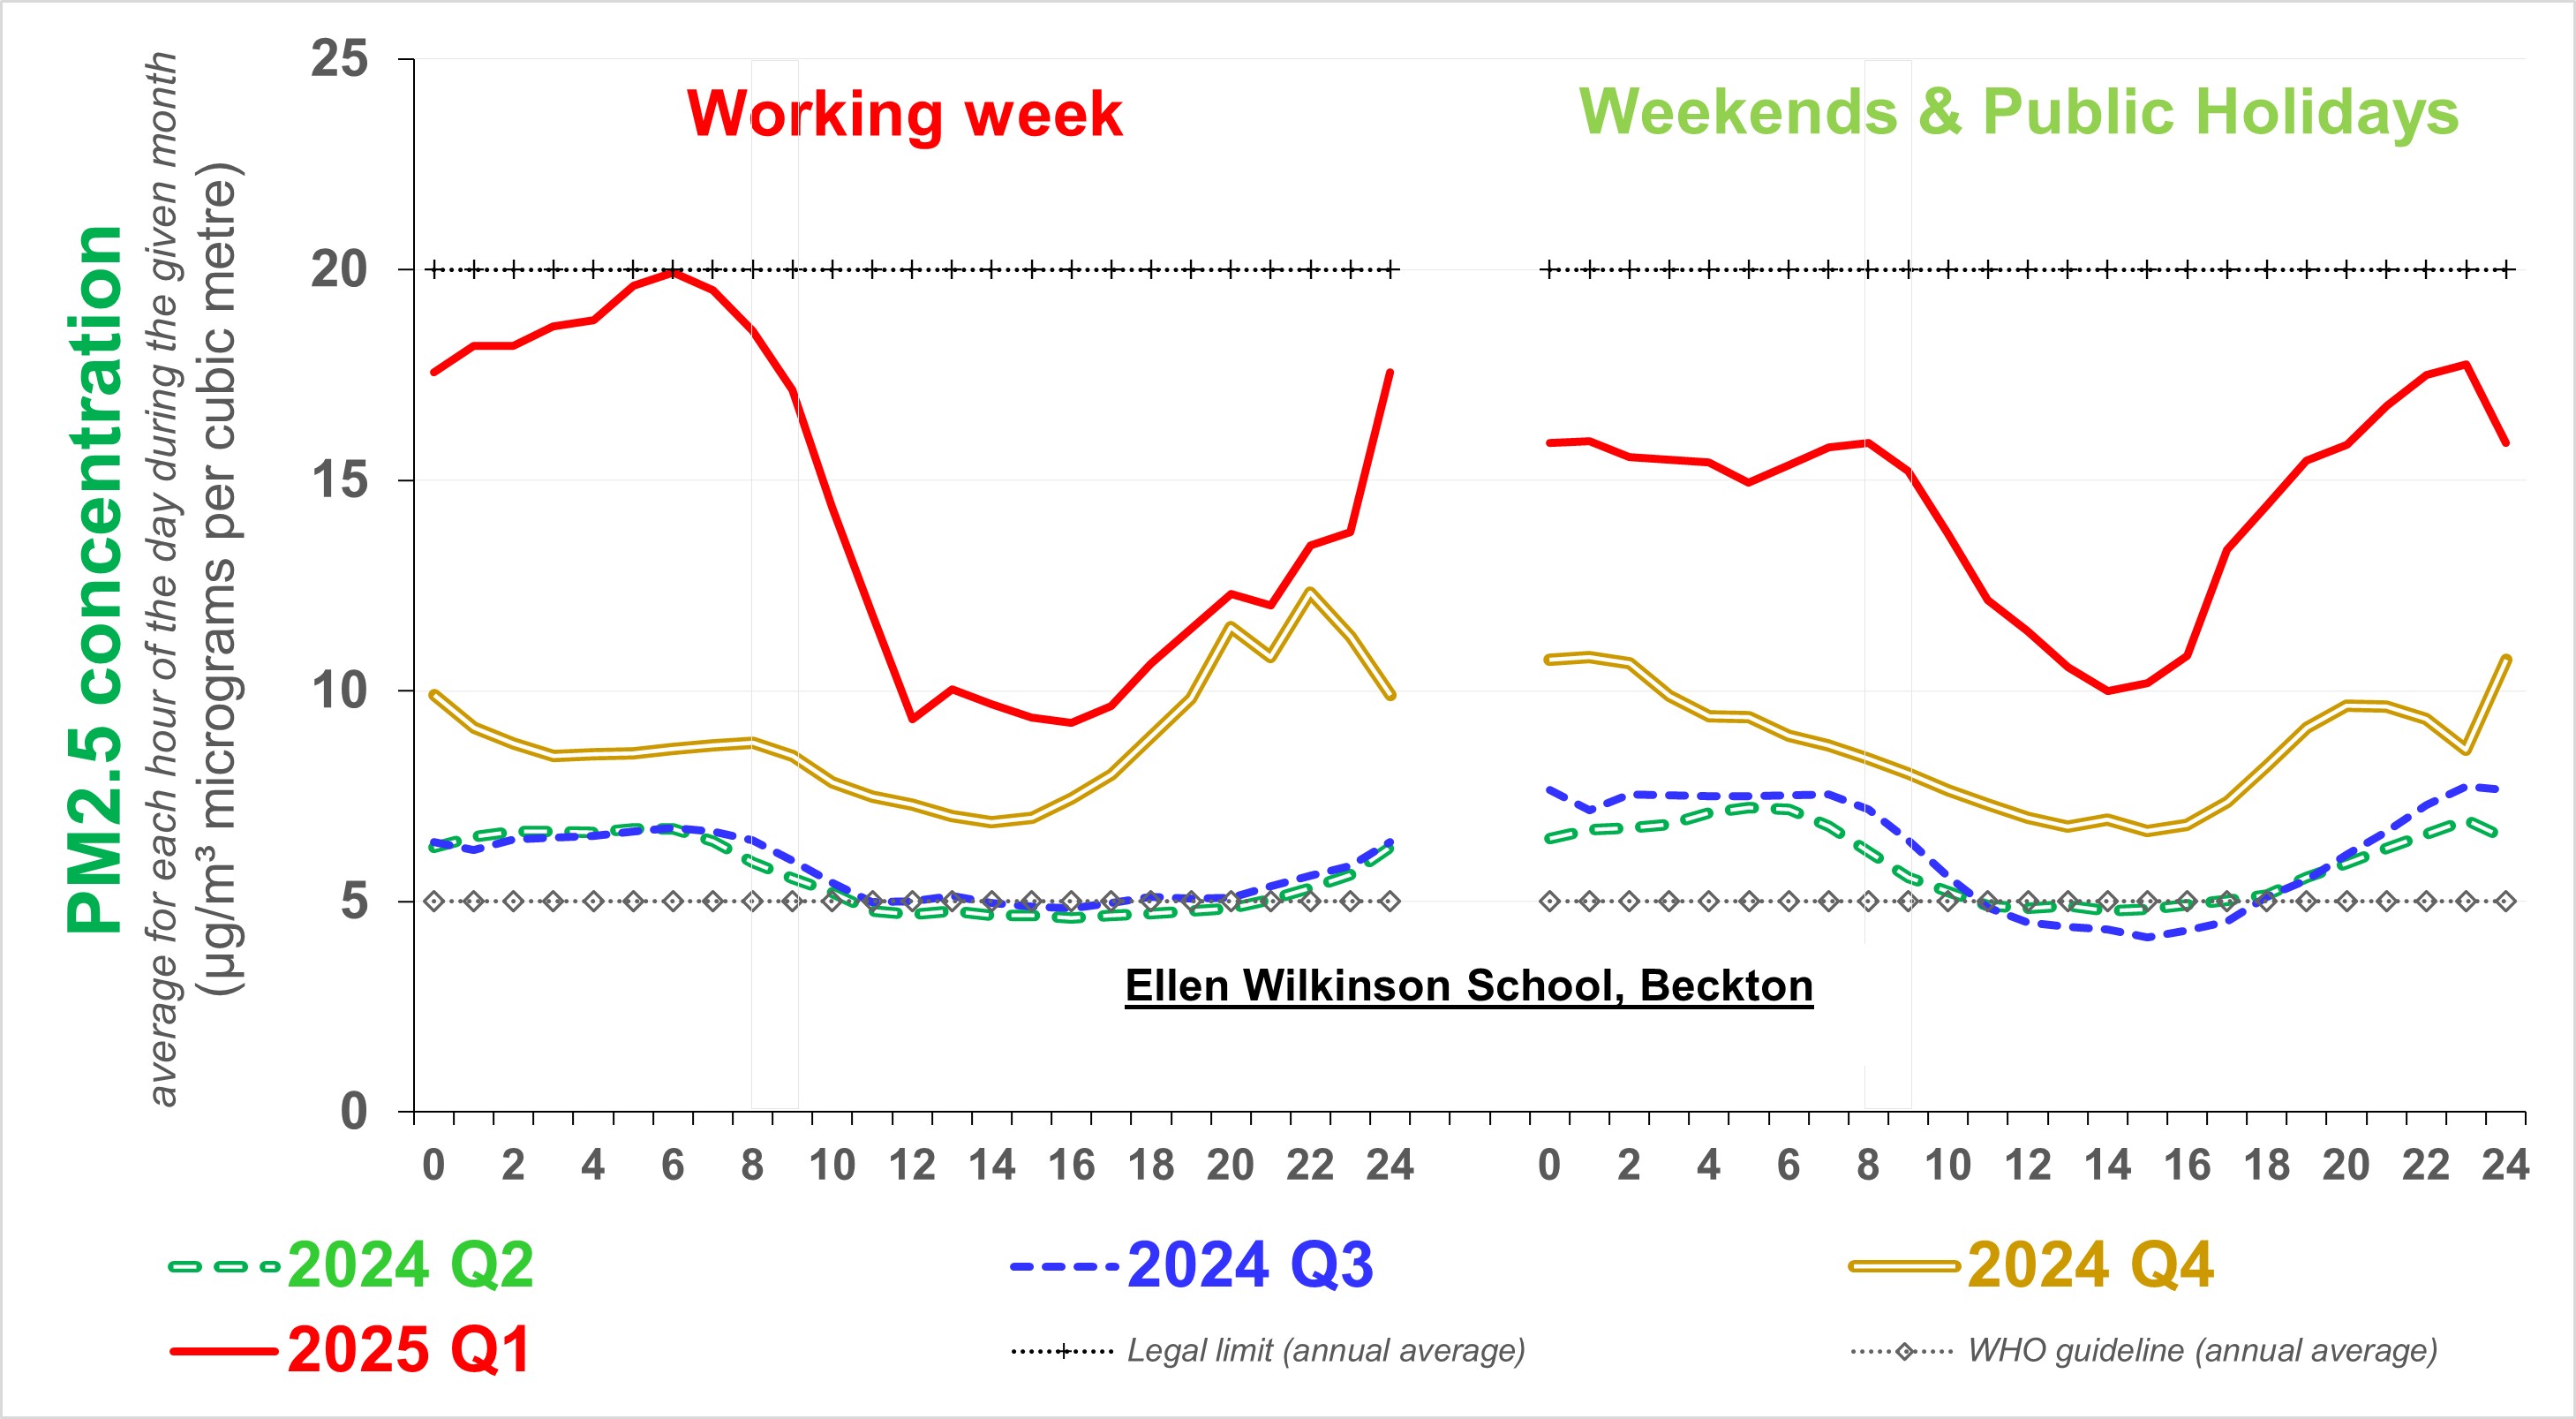 Remarks: Clear seasonal and hourly variation for NO2; reassuringly low PM2.5. |
|
For further information, please contact: info@airqualitymatters.uk |
| Back |