|
AIR QUALITY MATTERS |
|
Manchester and neighbourhood |
|
|
|
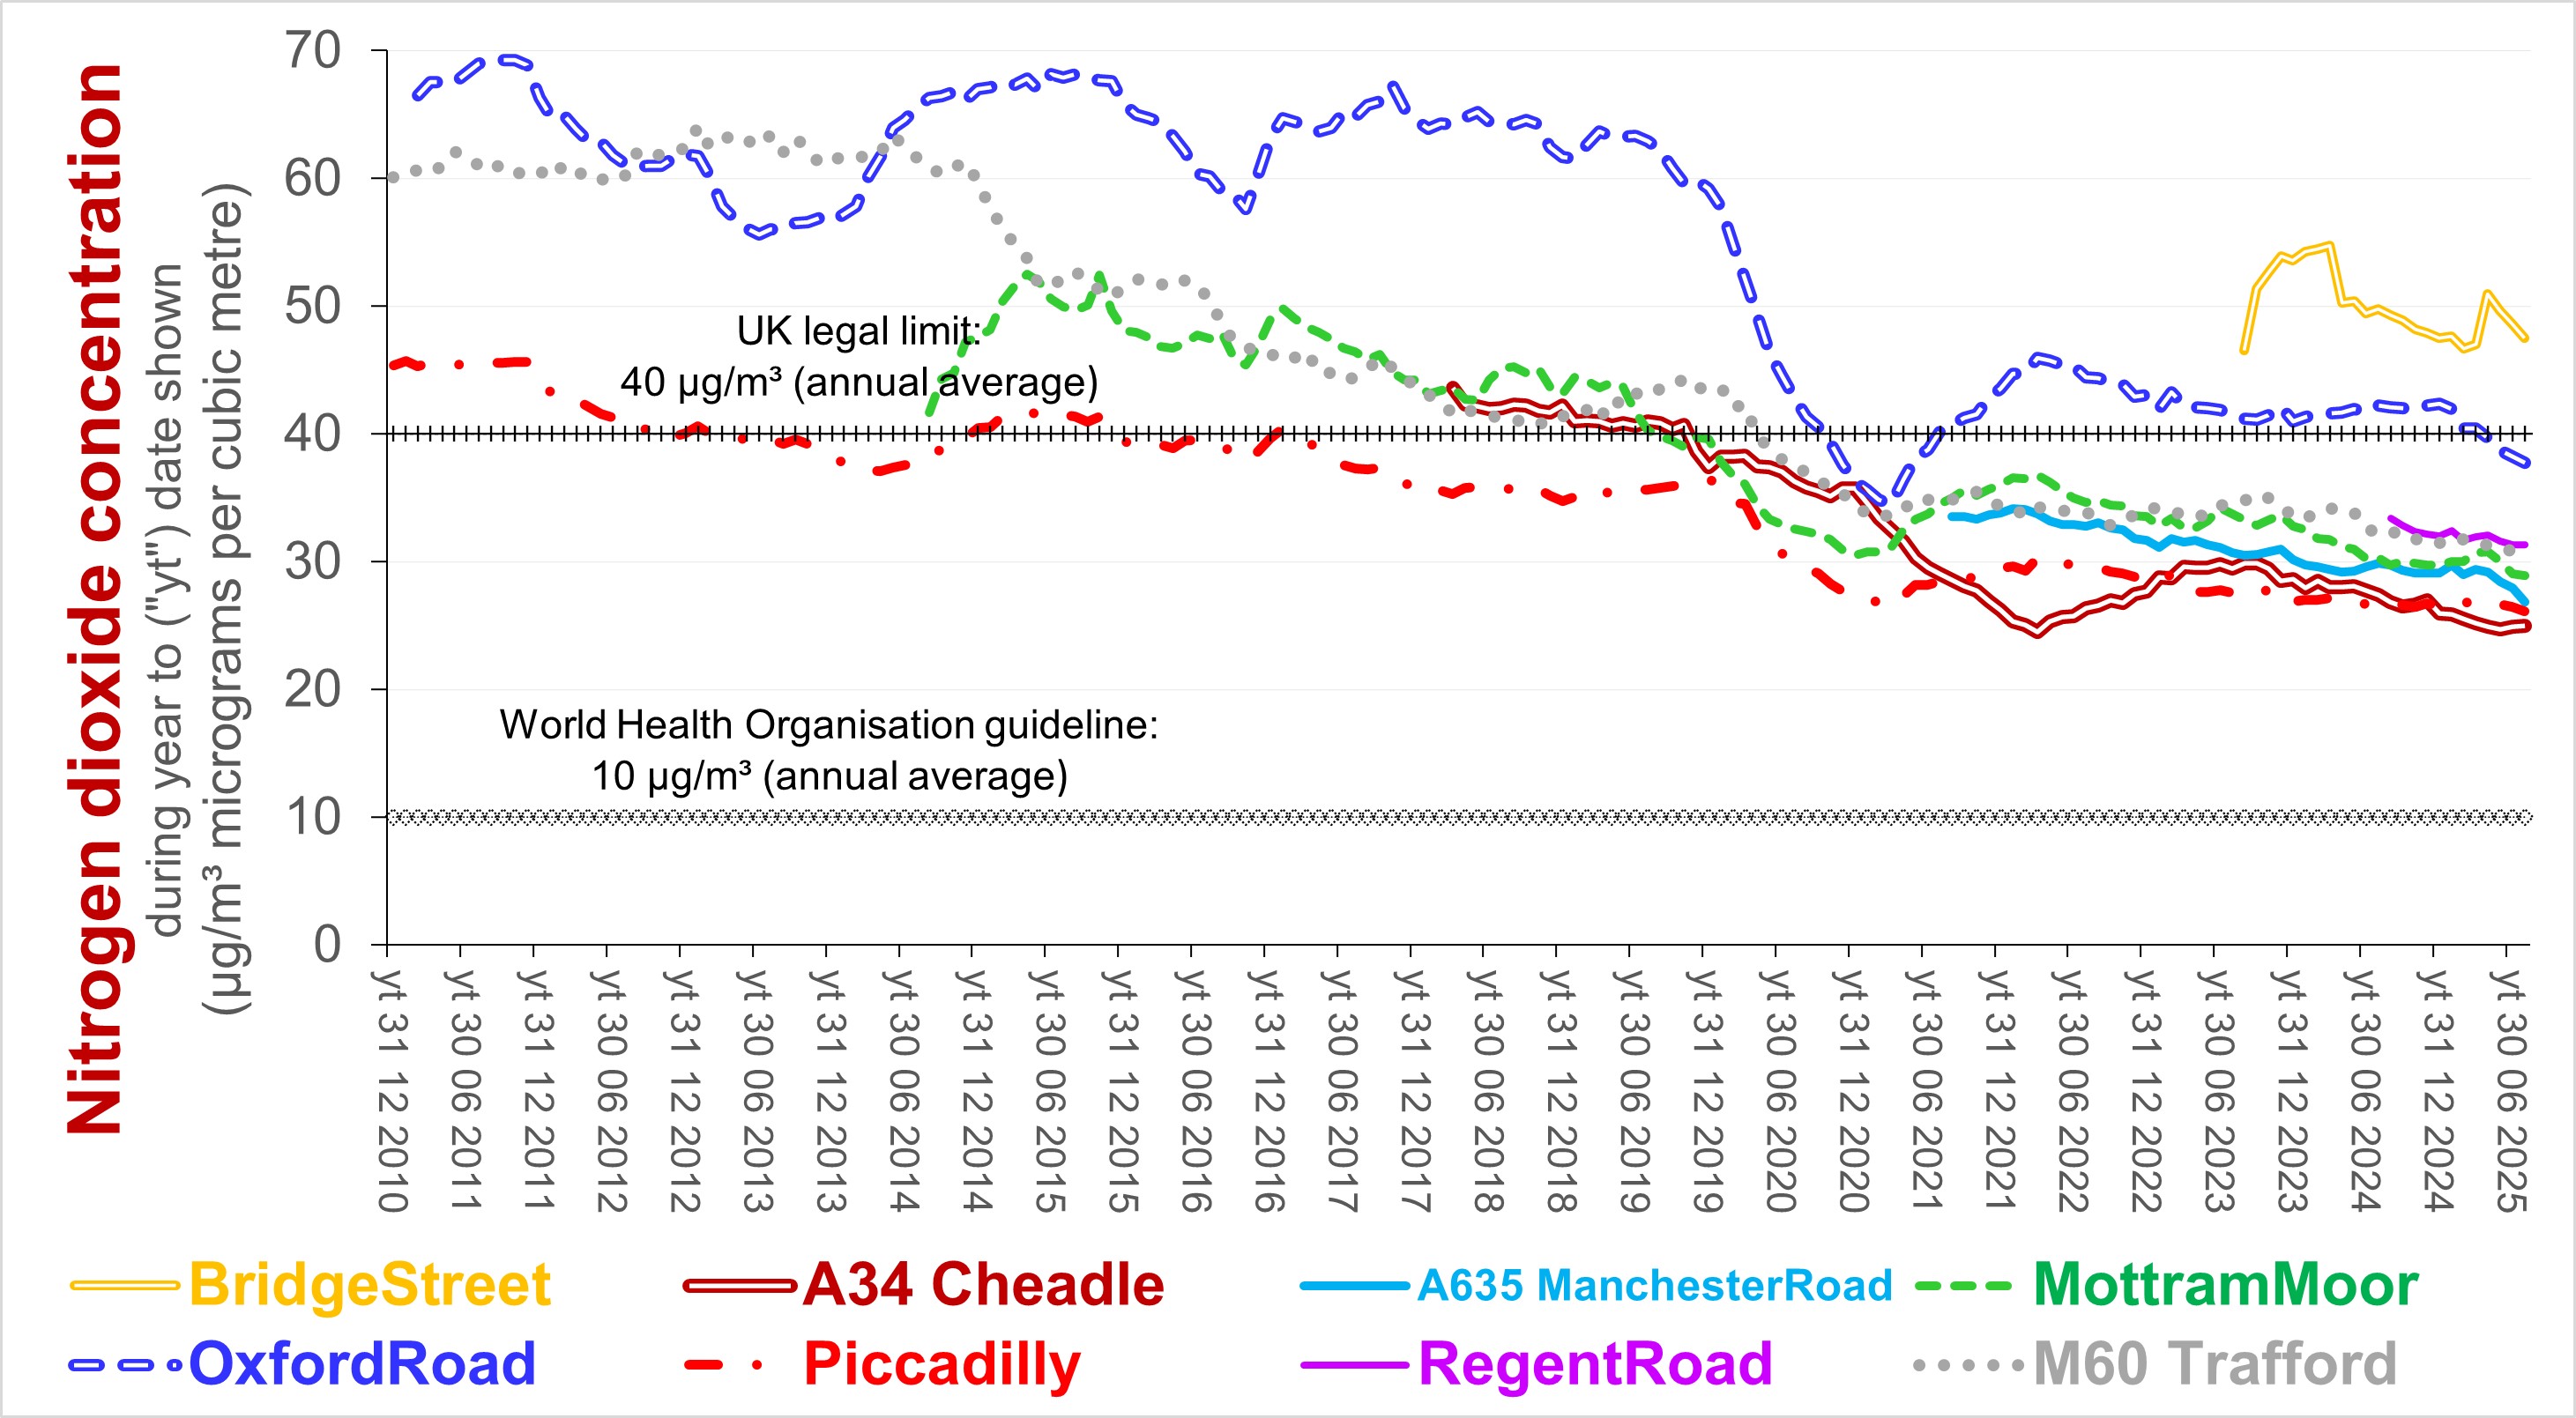
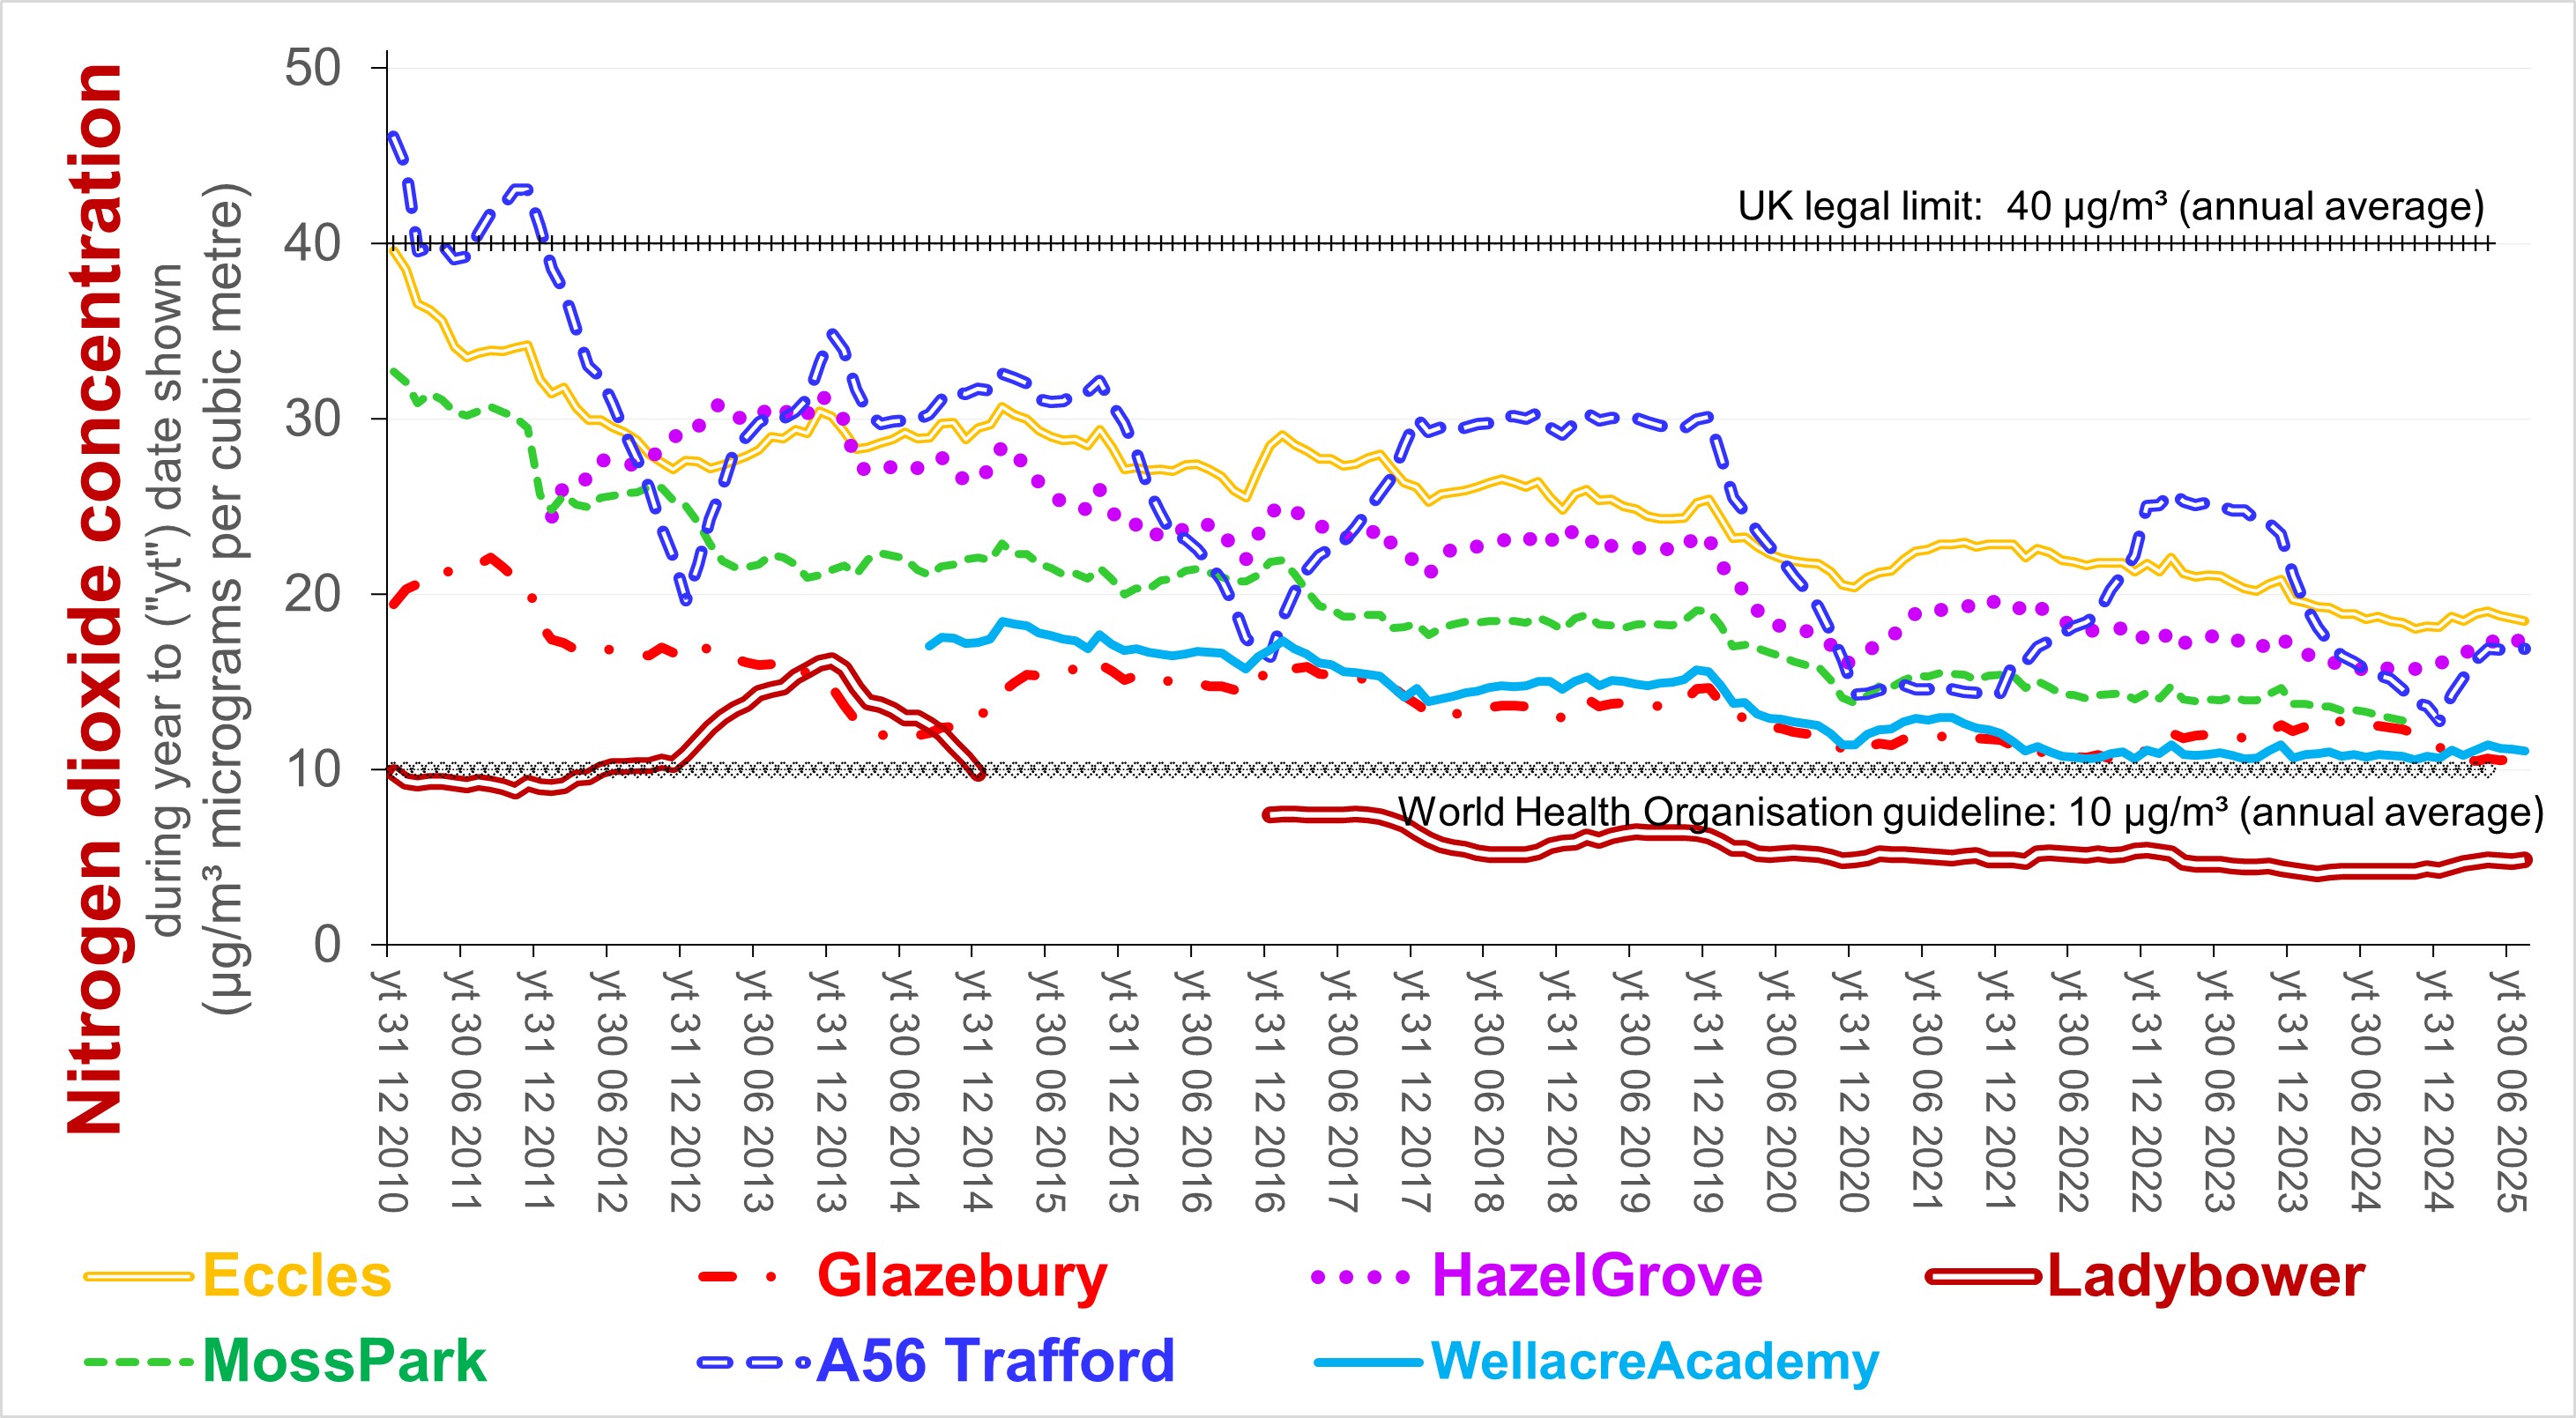
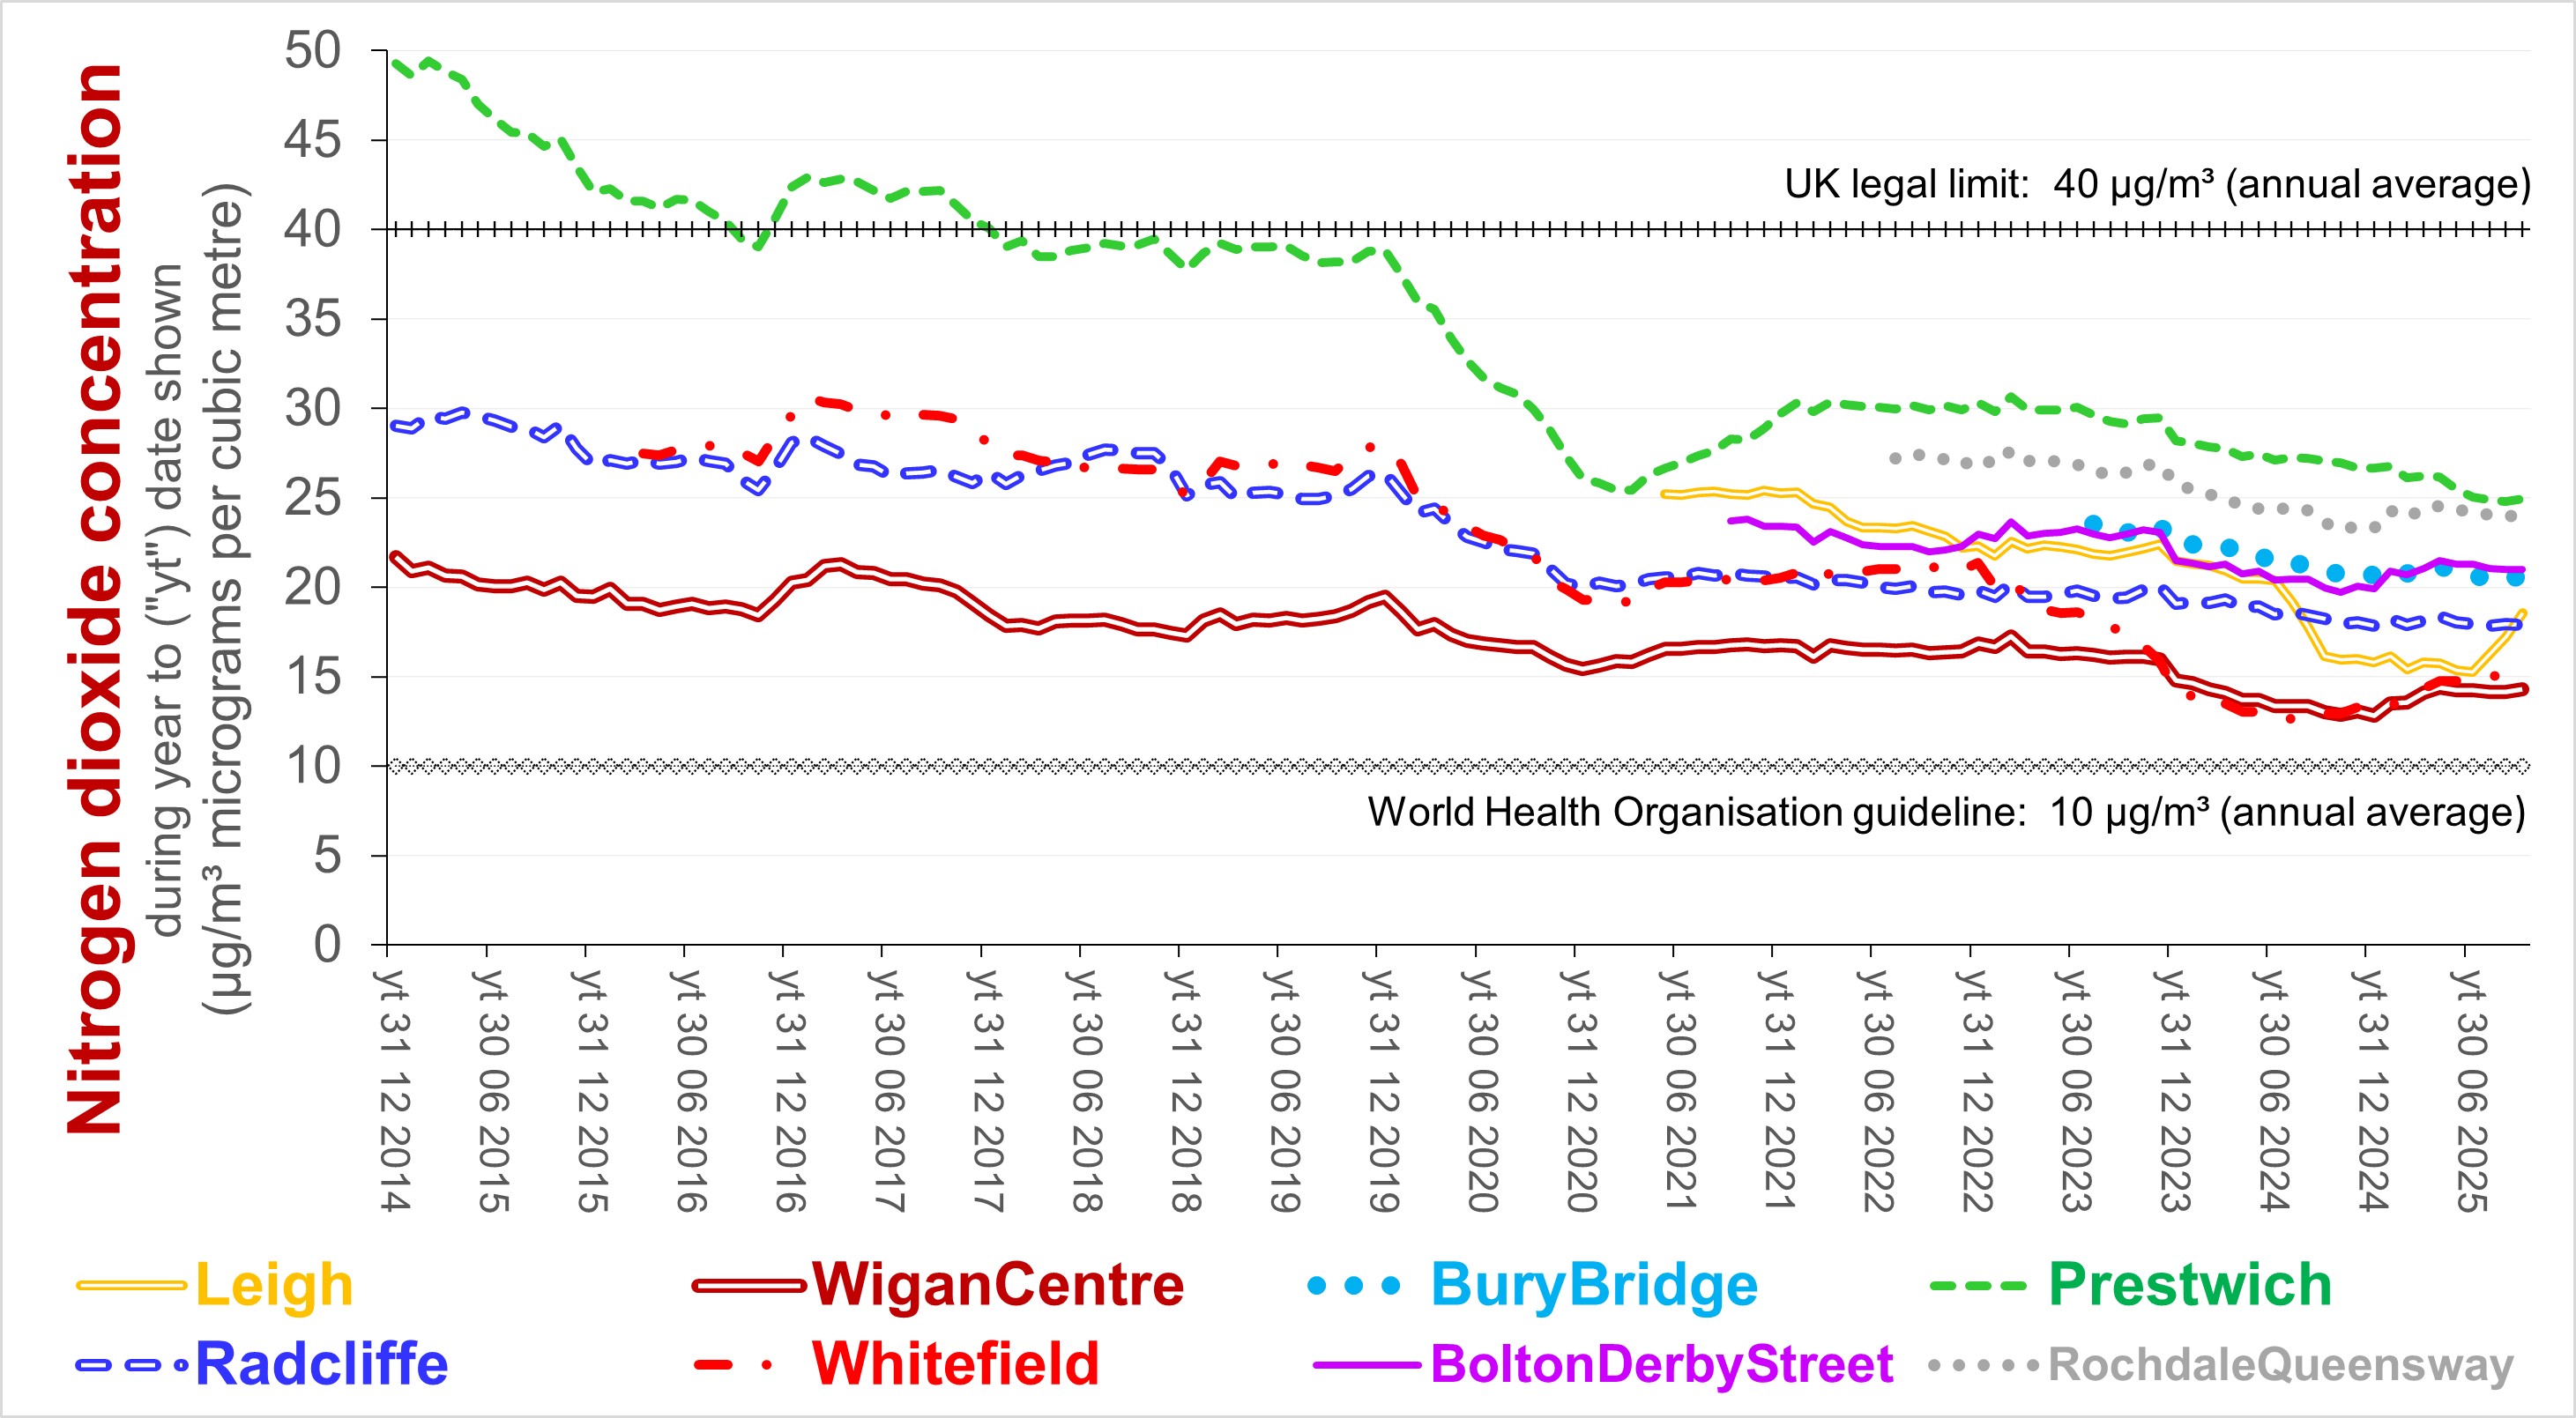
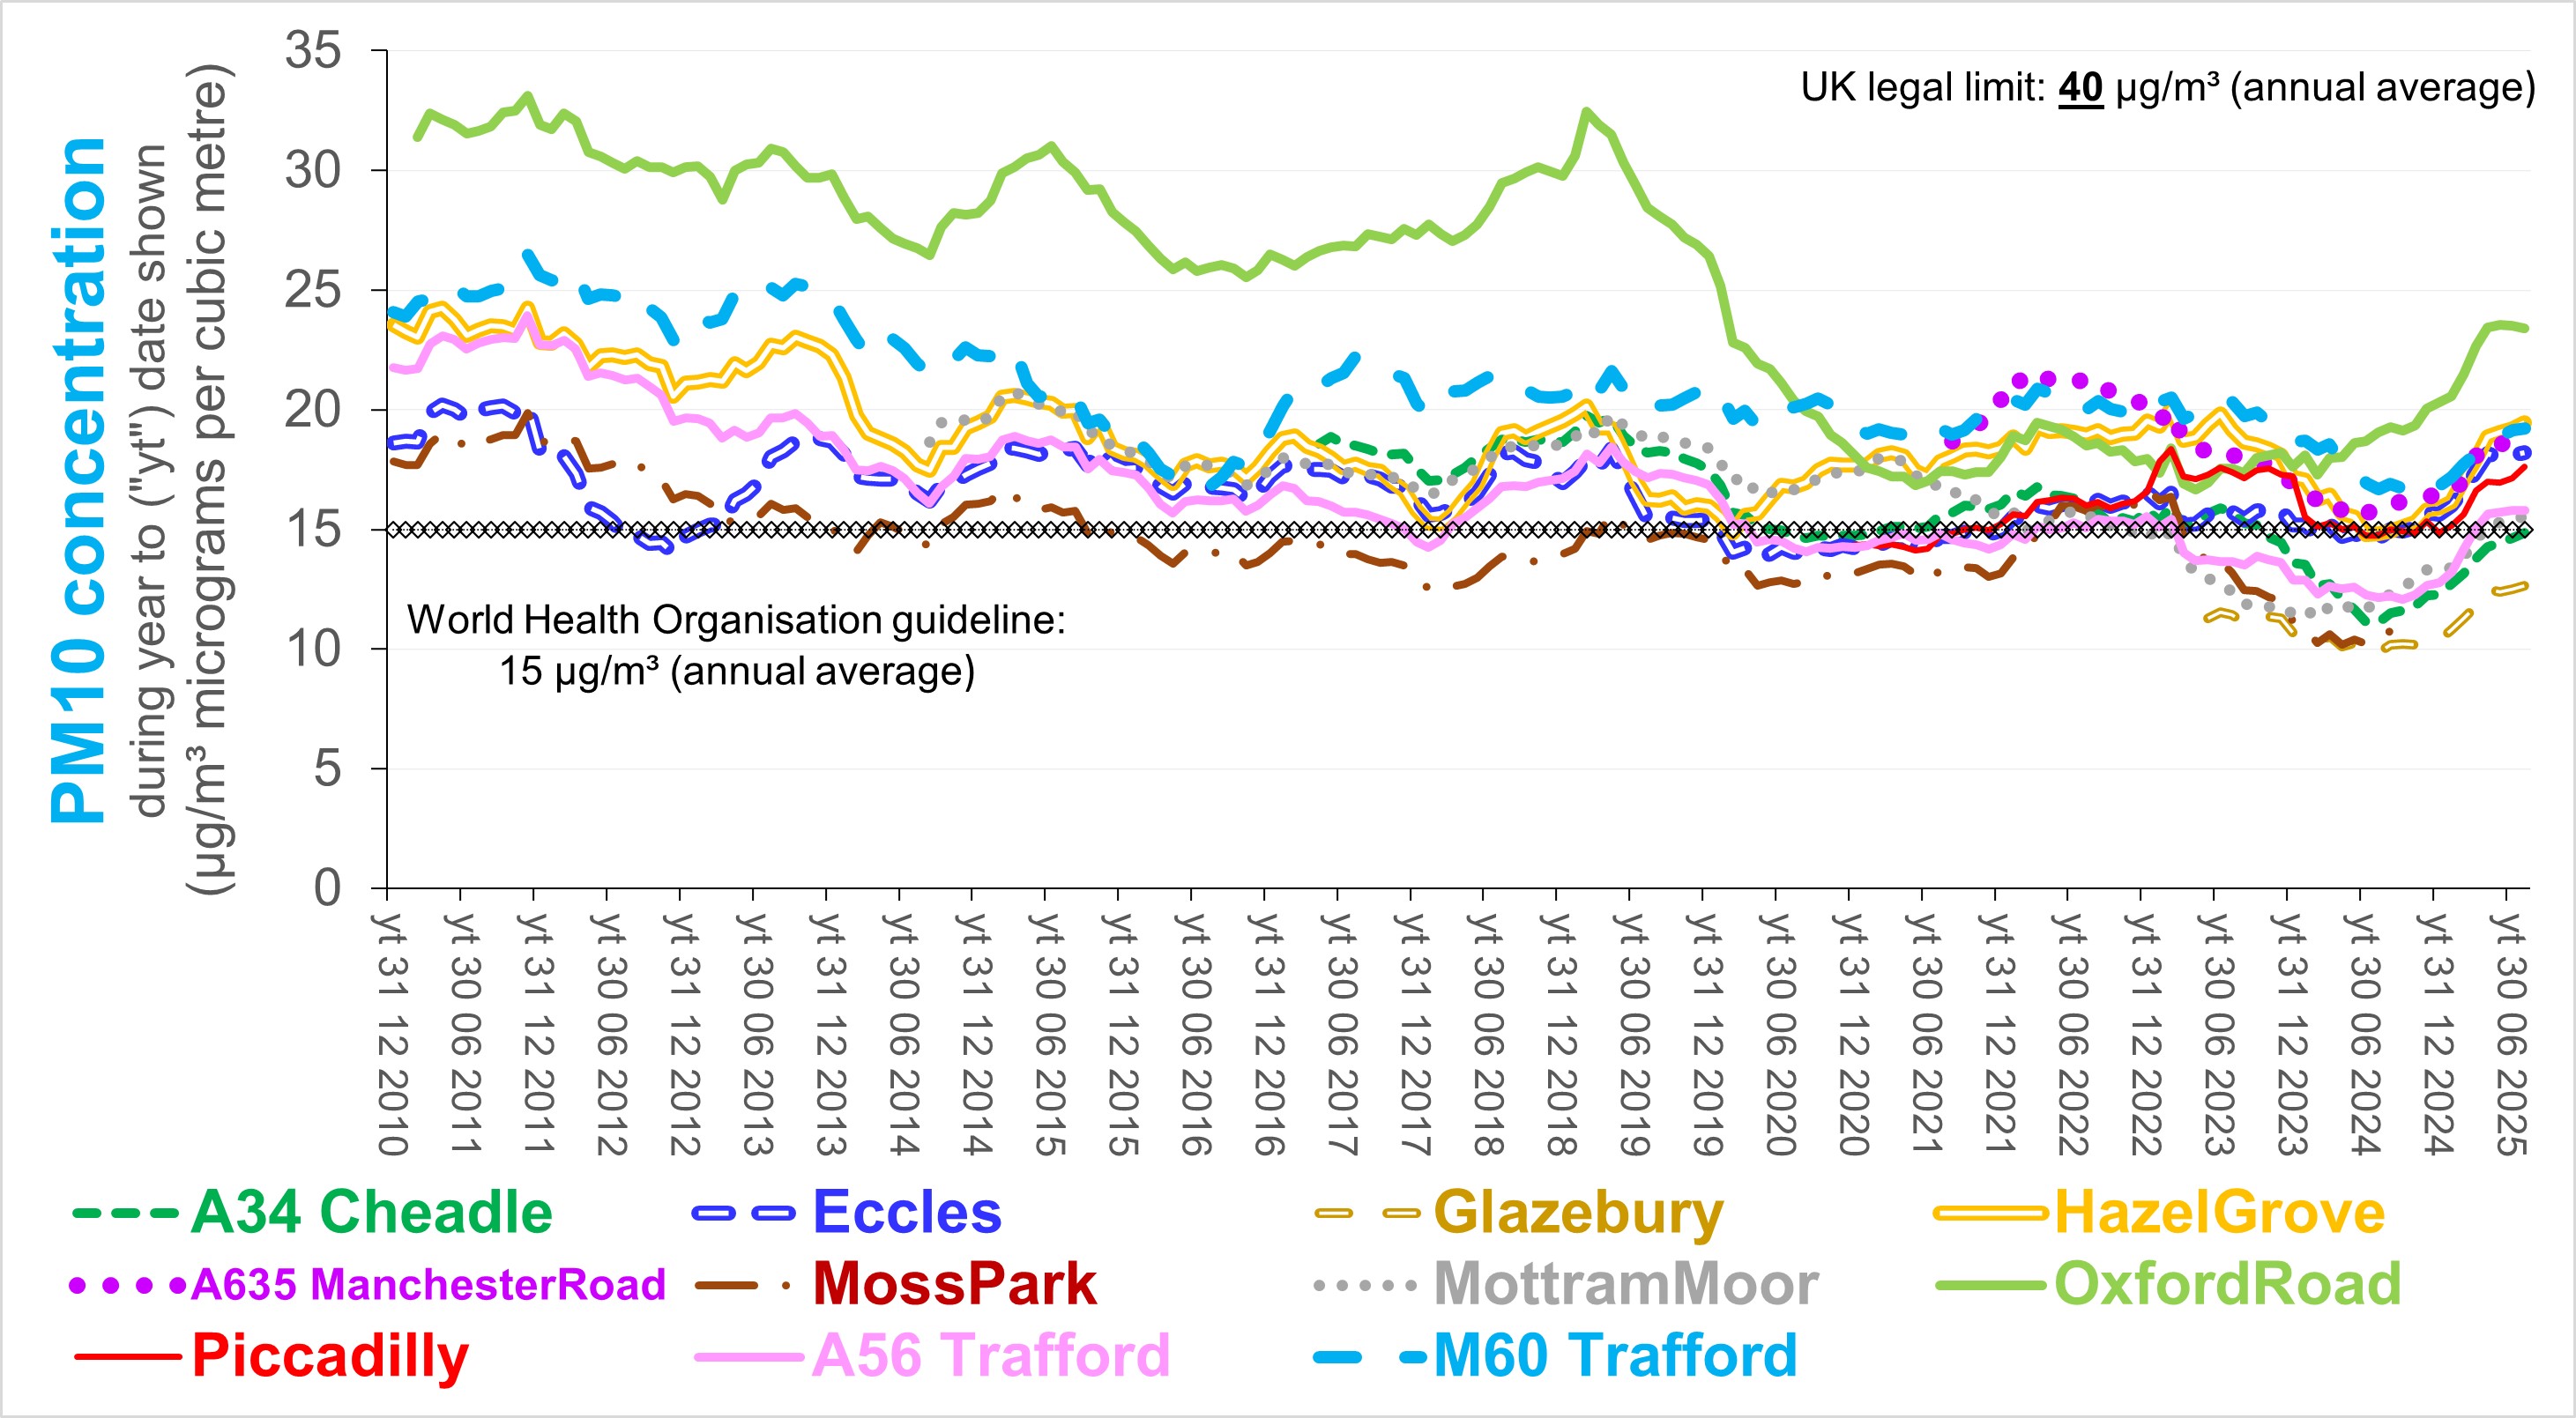
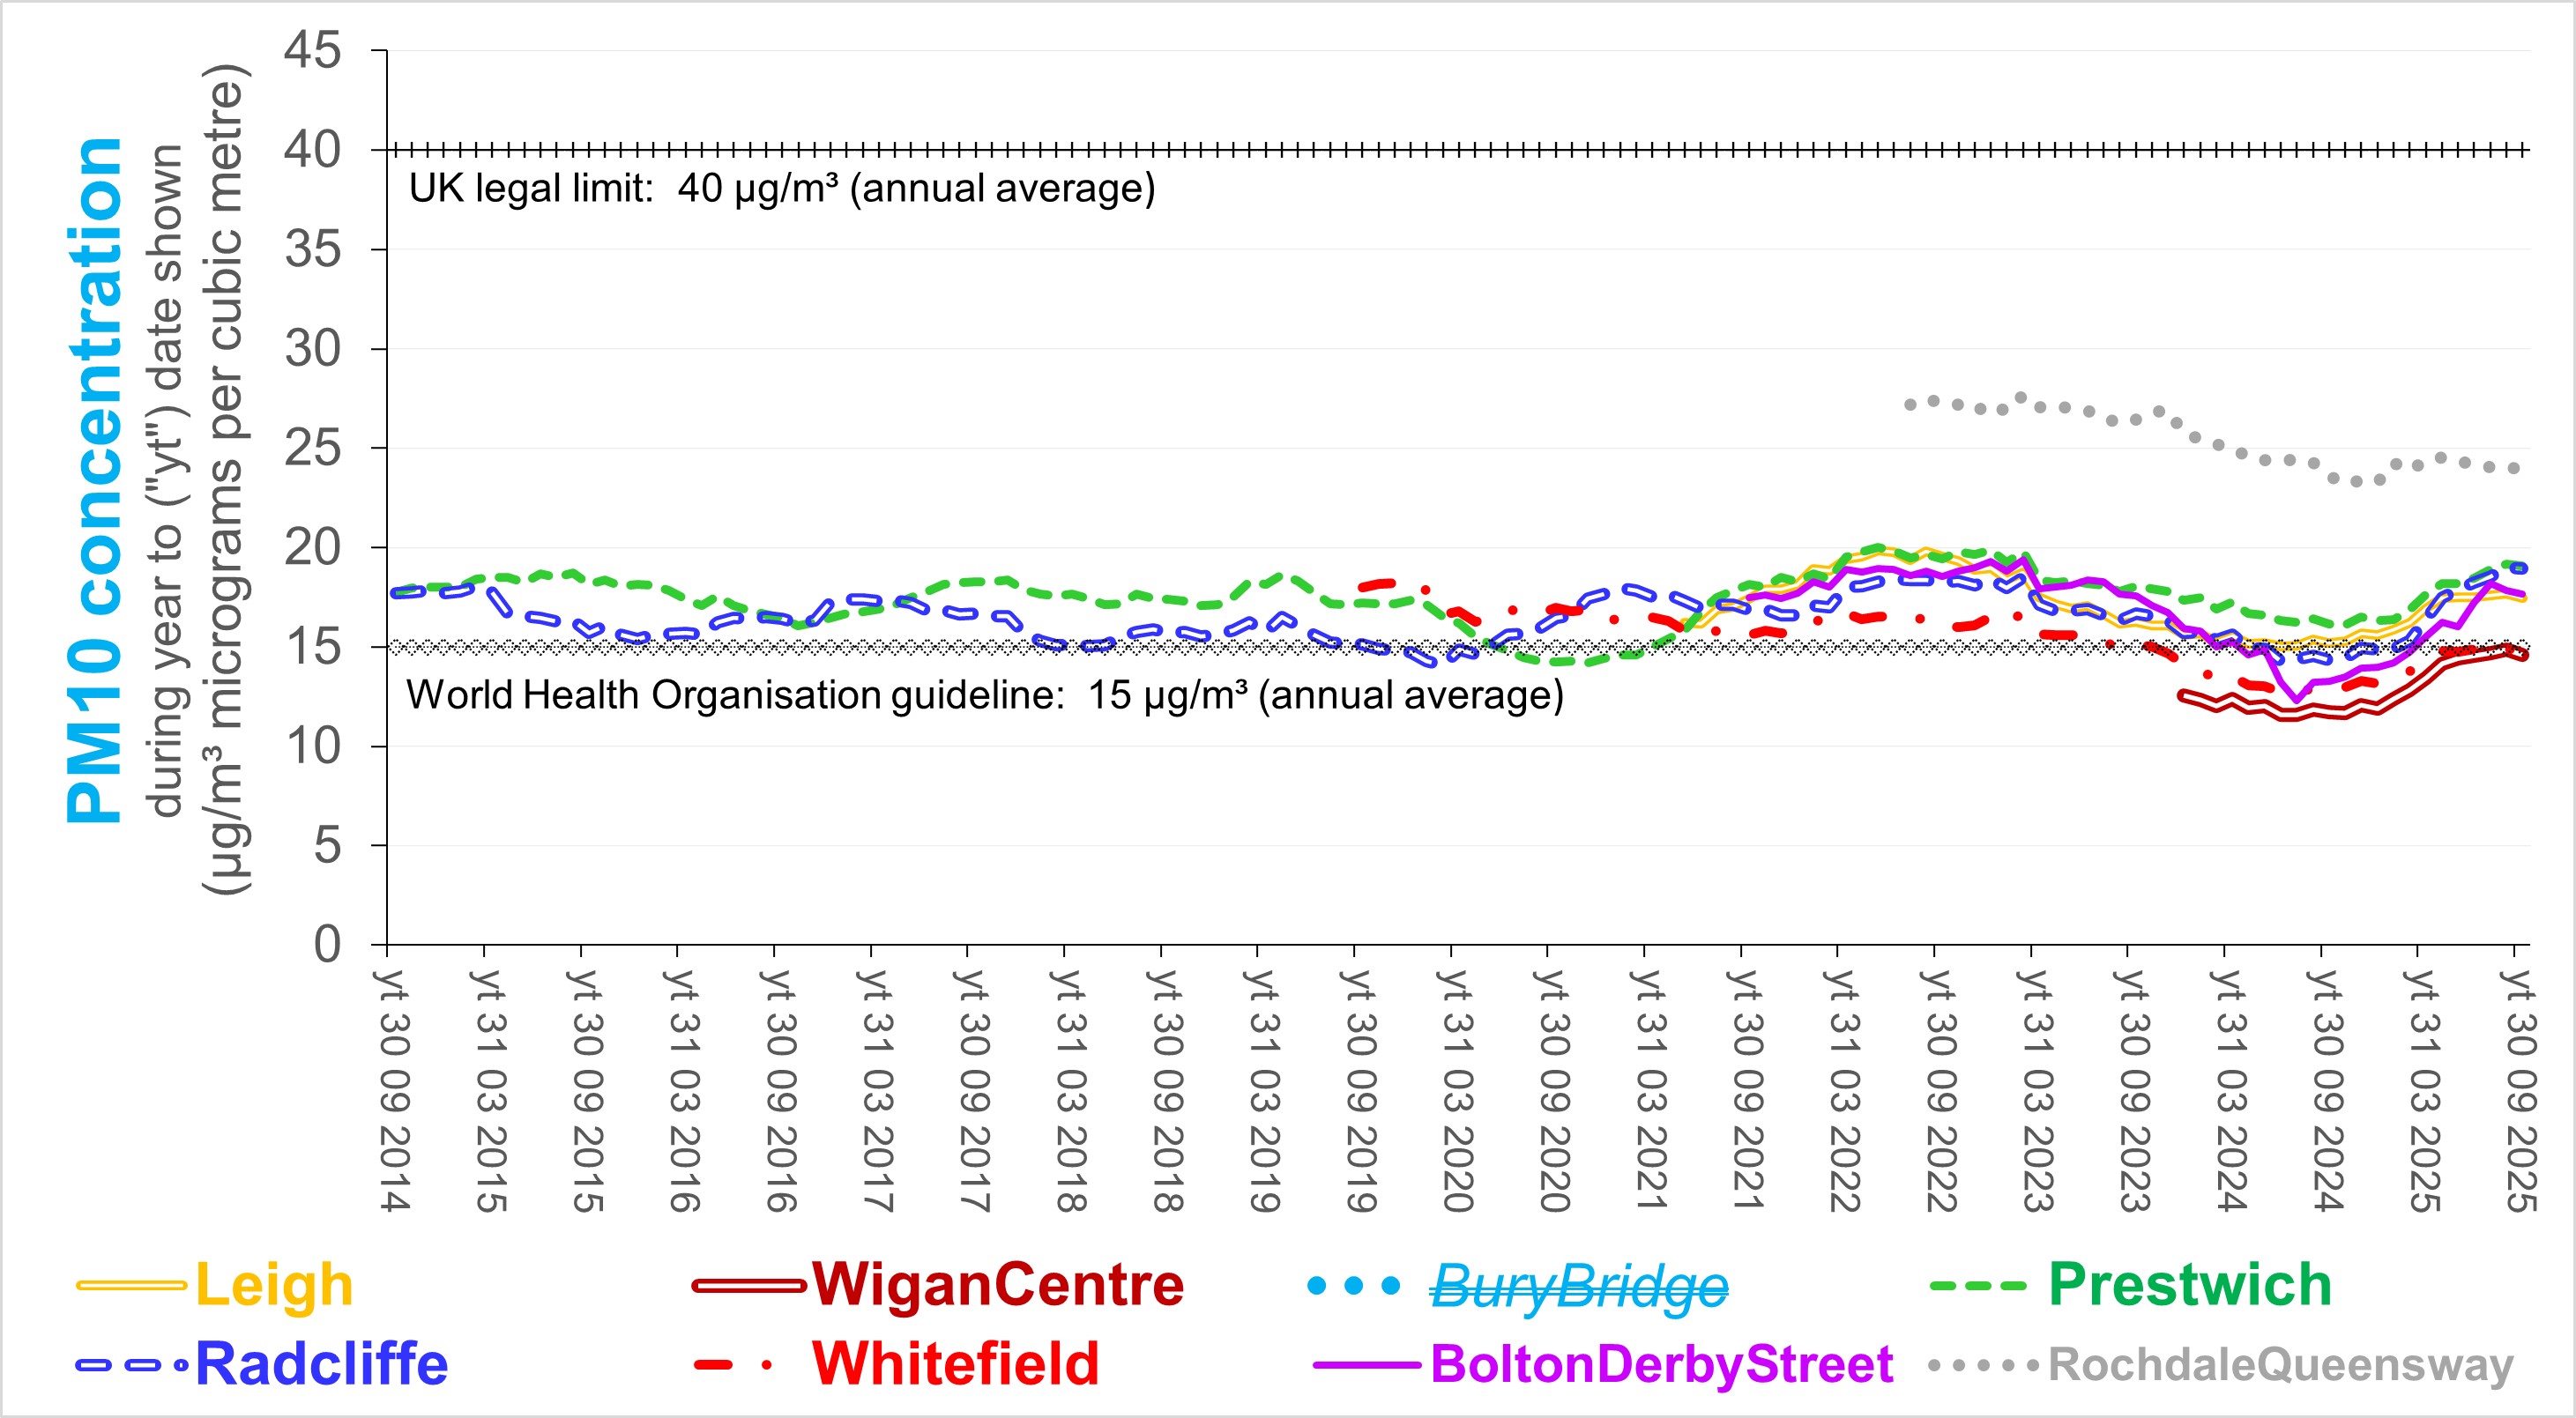
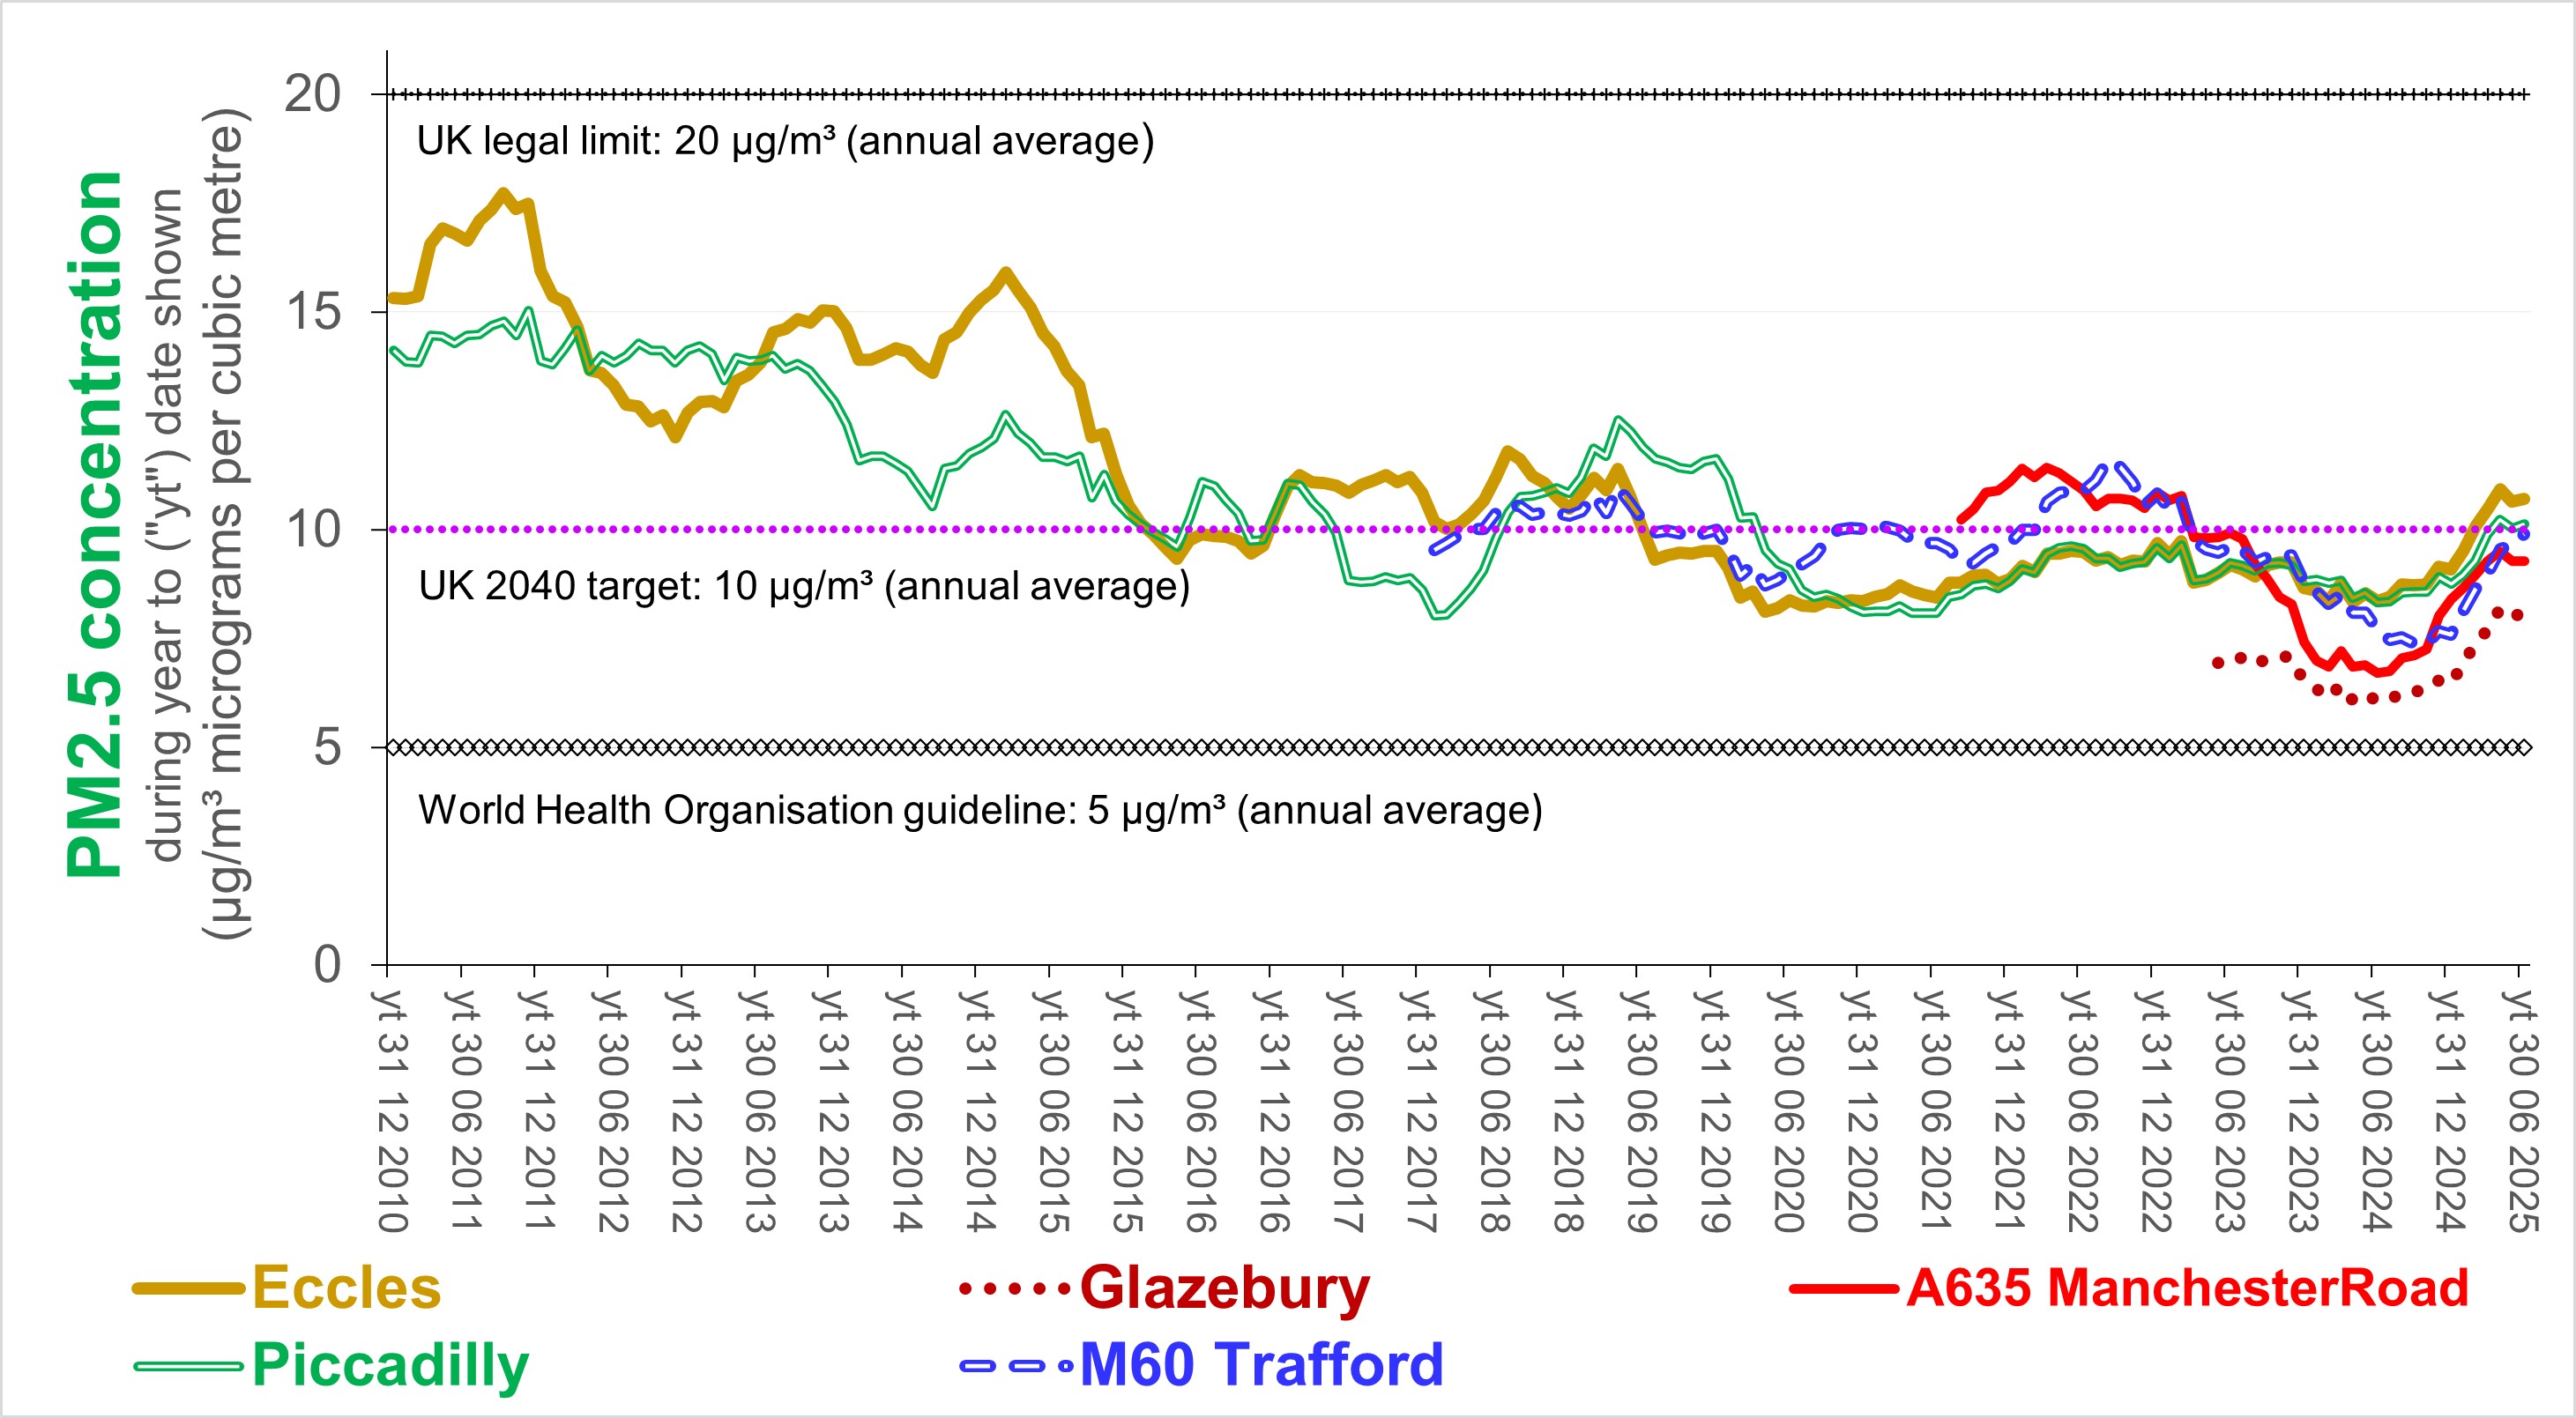
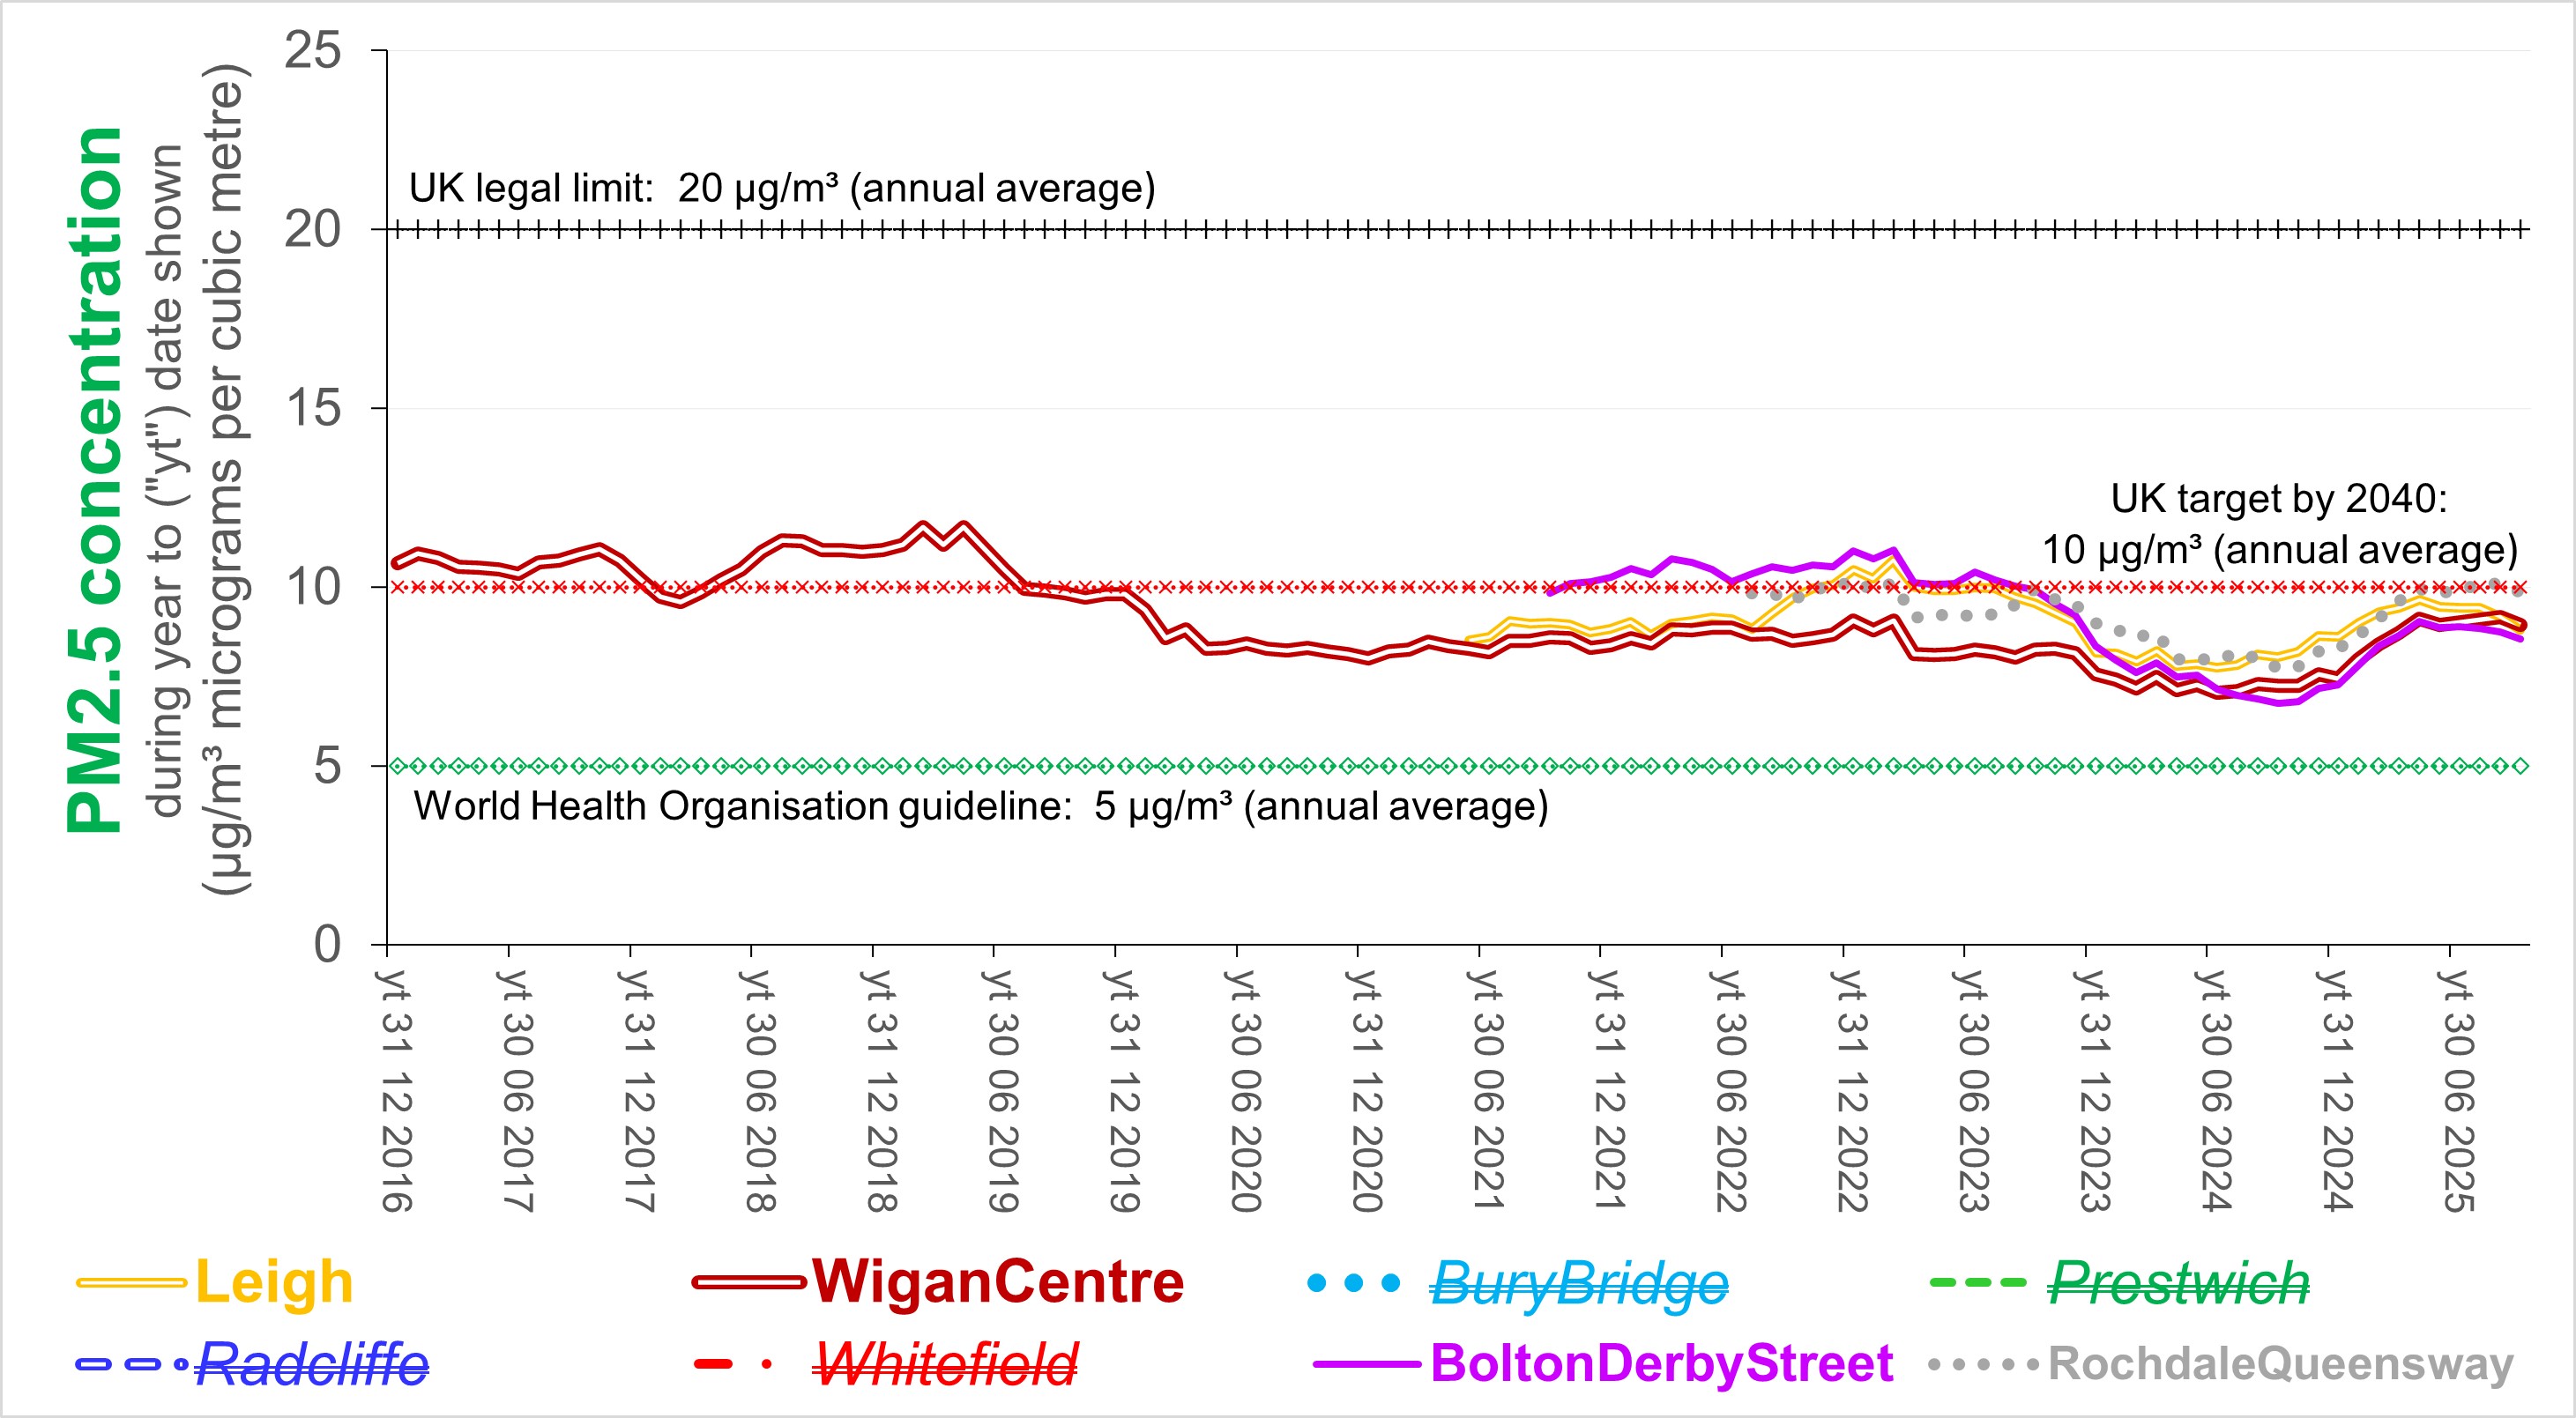
The following charts show how the average 12-monthly concentrations of nitrogen dioxidxe (NO2) and particulate matter (PM10 and PM2.5) have changed since 2010 at sites measured for regulatory purposes in the City of Manchester and neighbouring areas as reported by Air Quality England (data up to 30/09/2025; most sites ratified up to 31/03/2025).
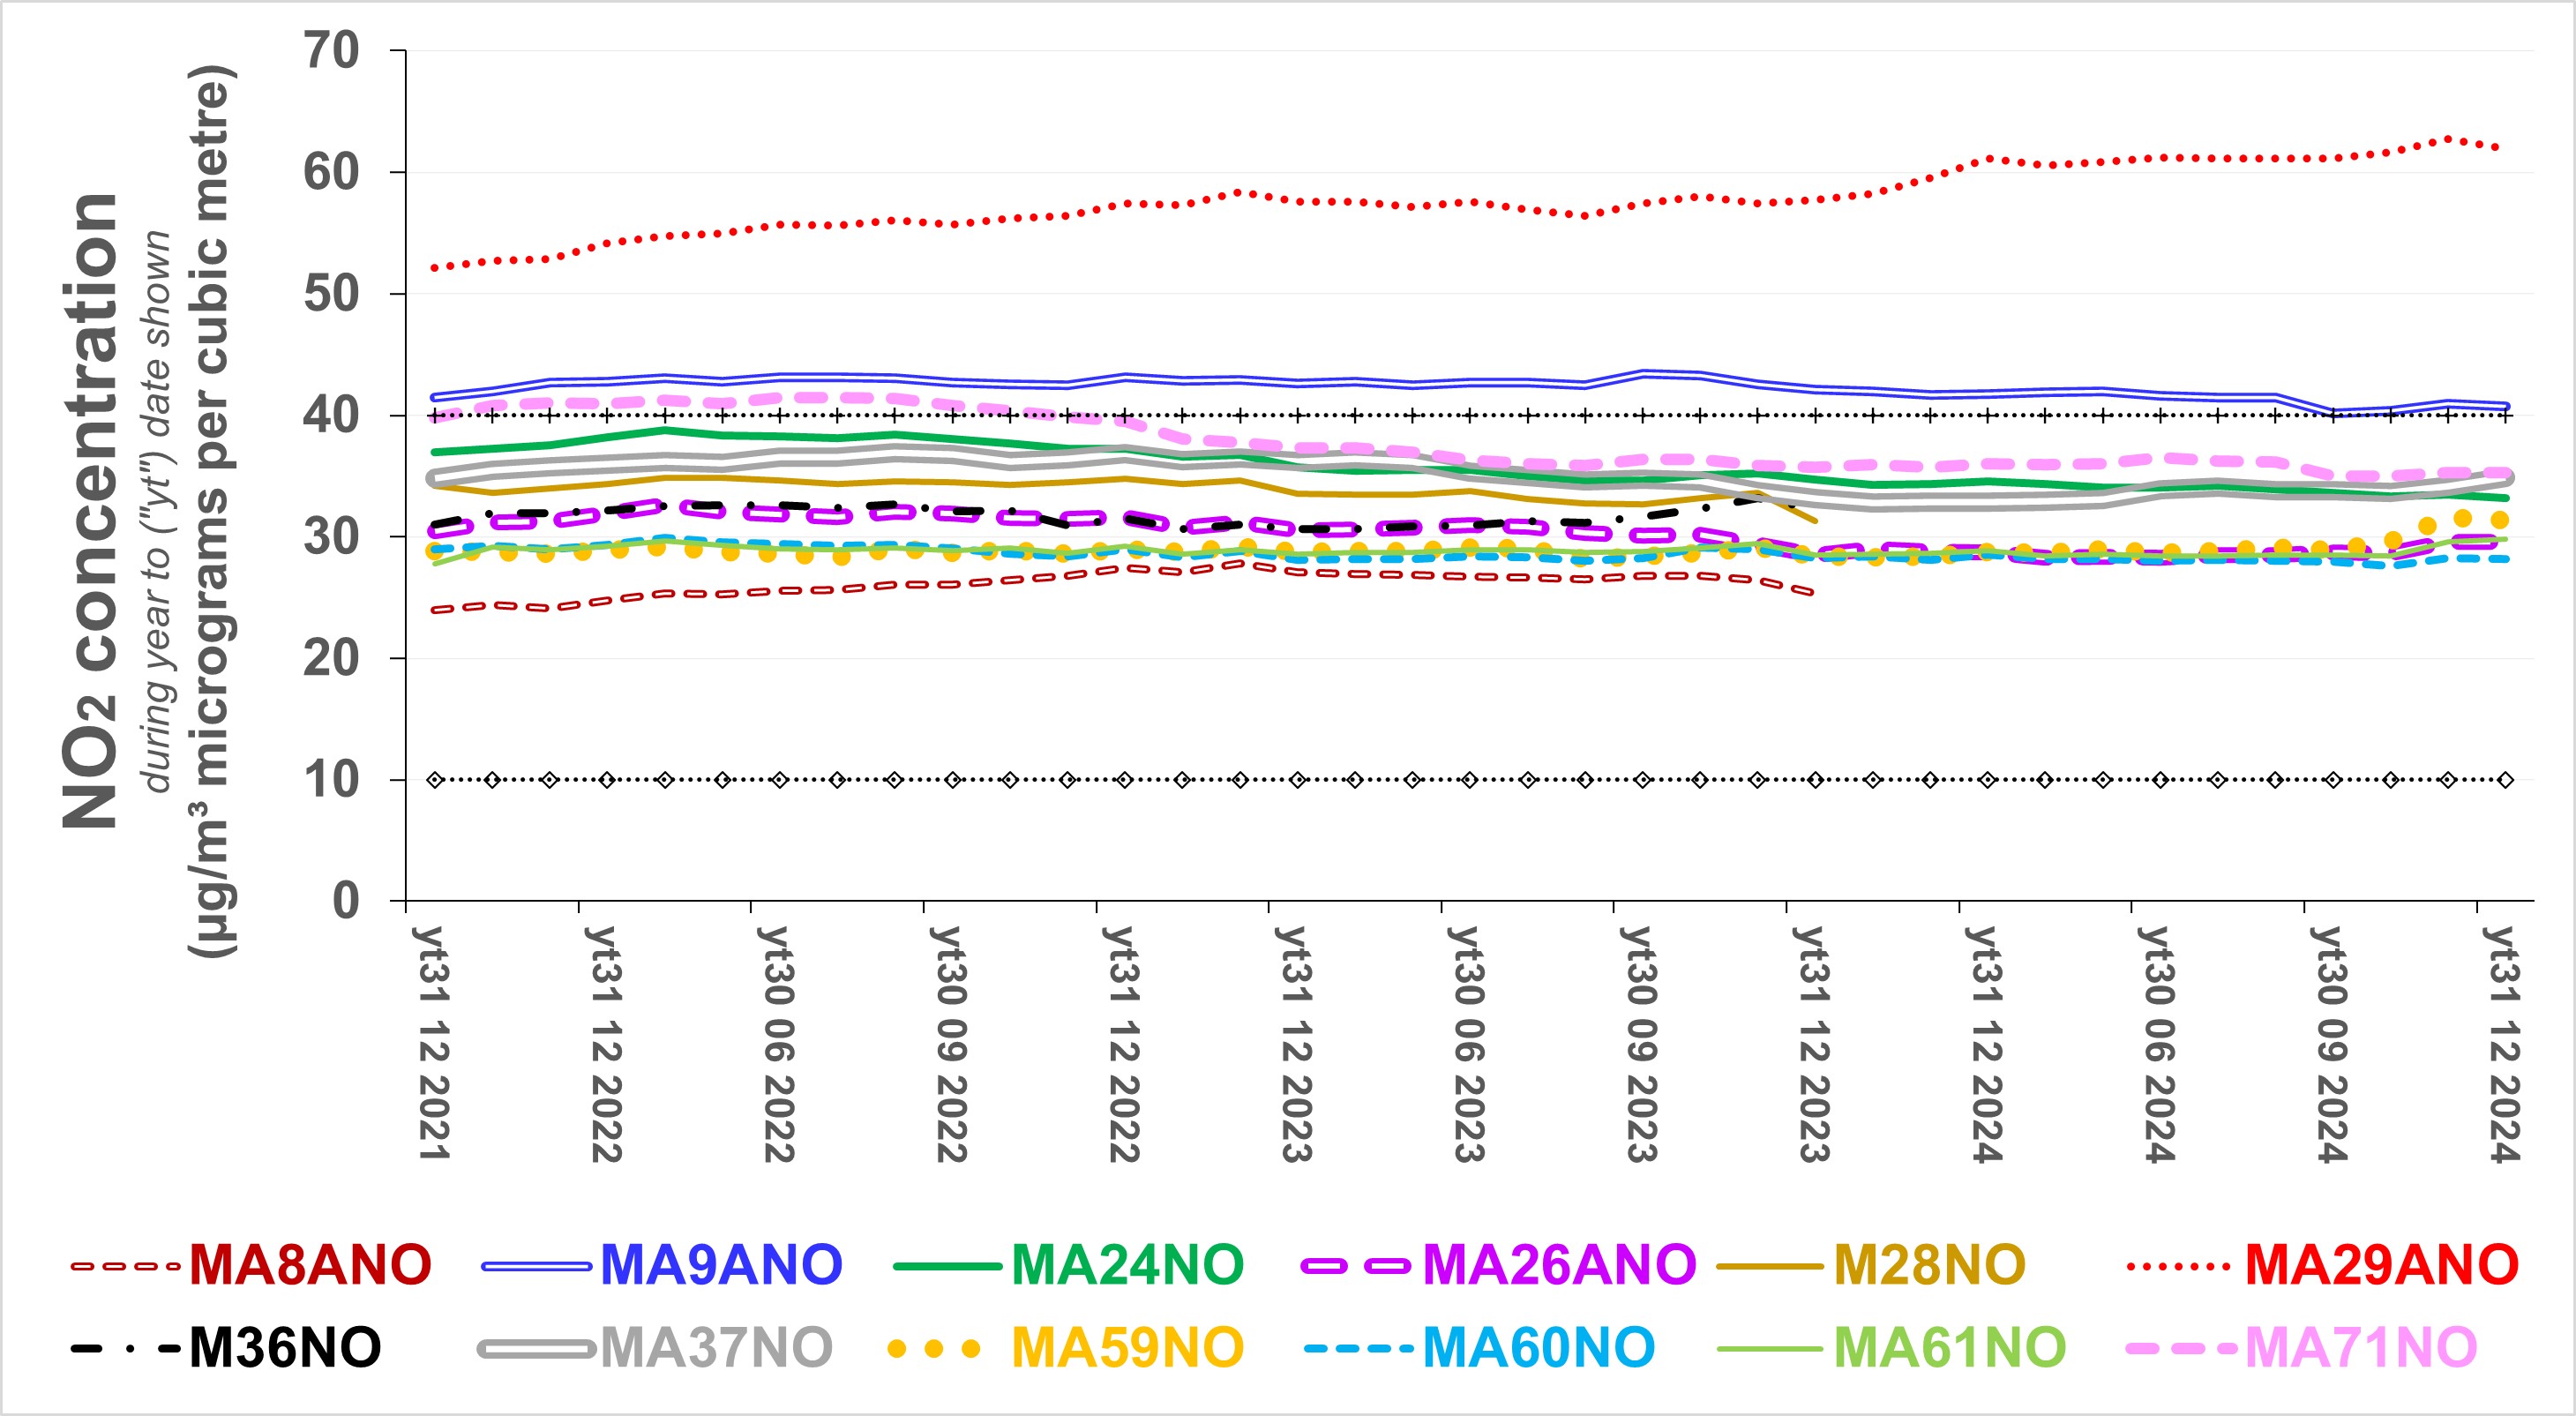
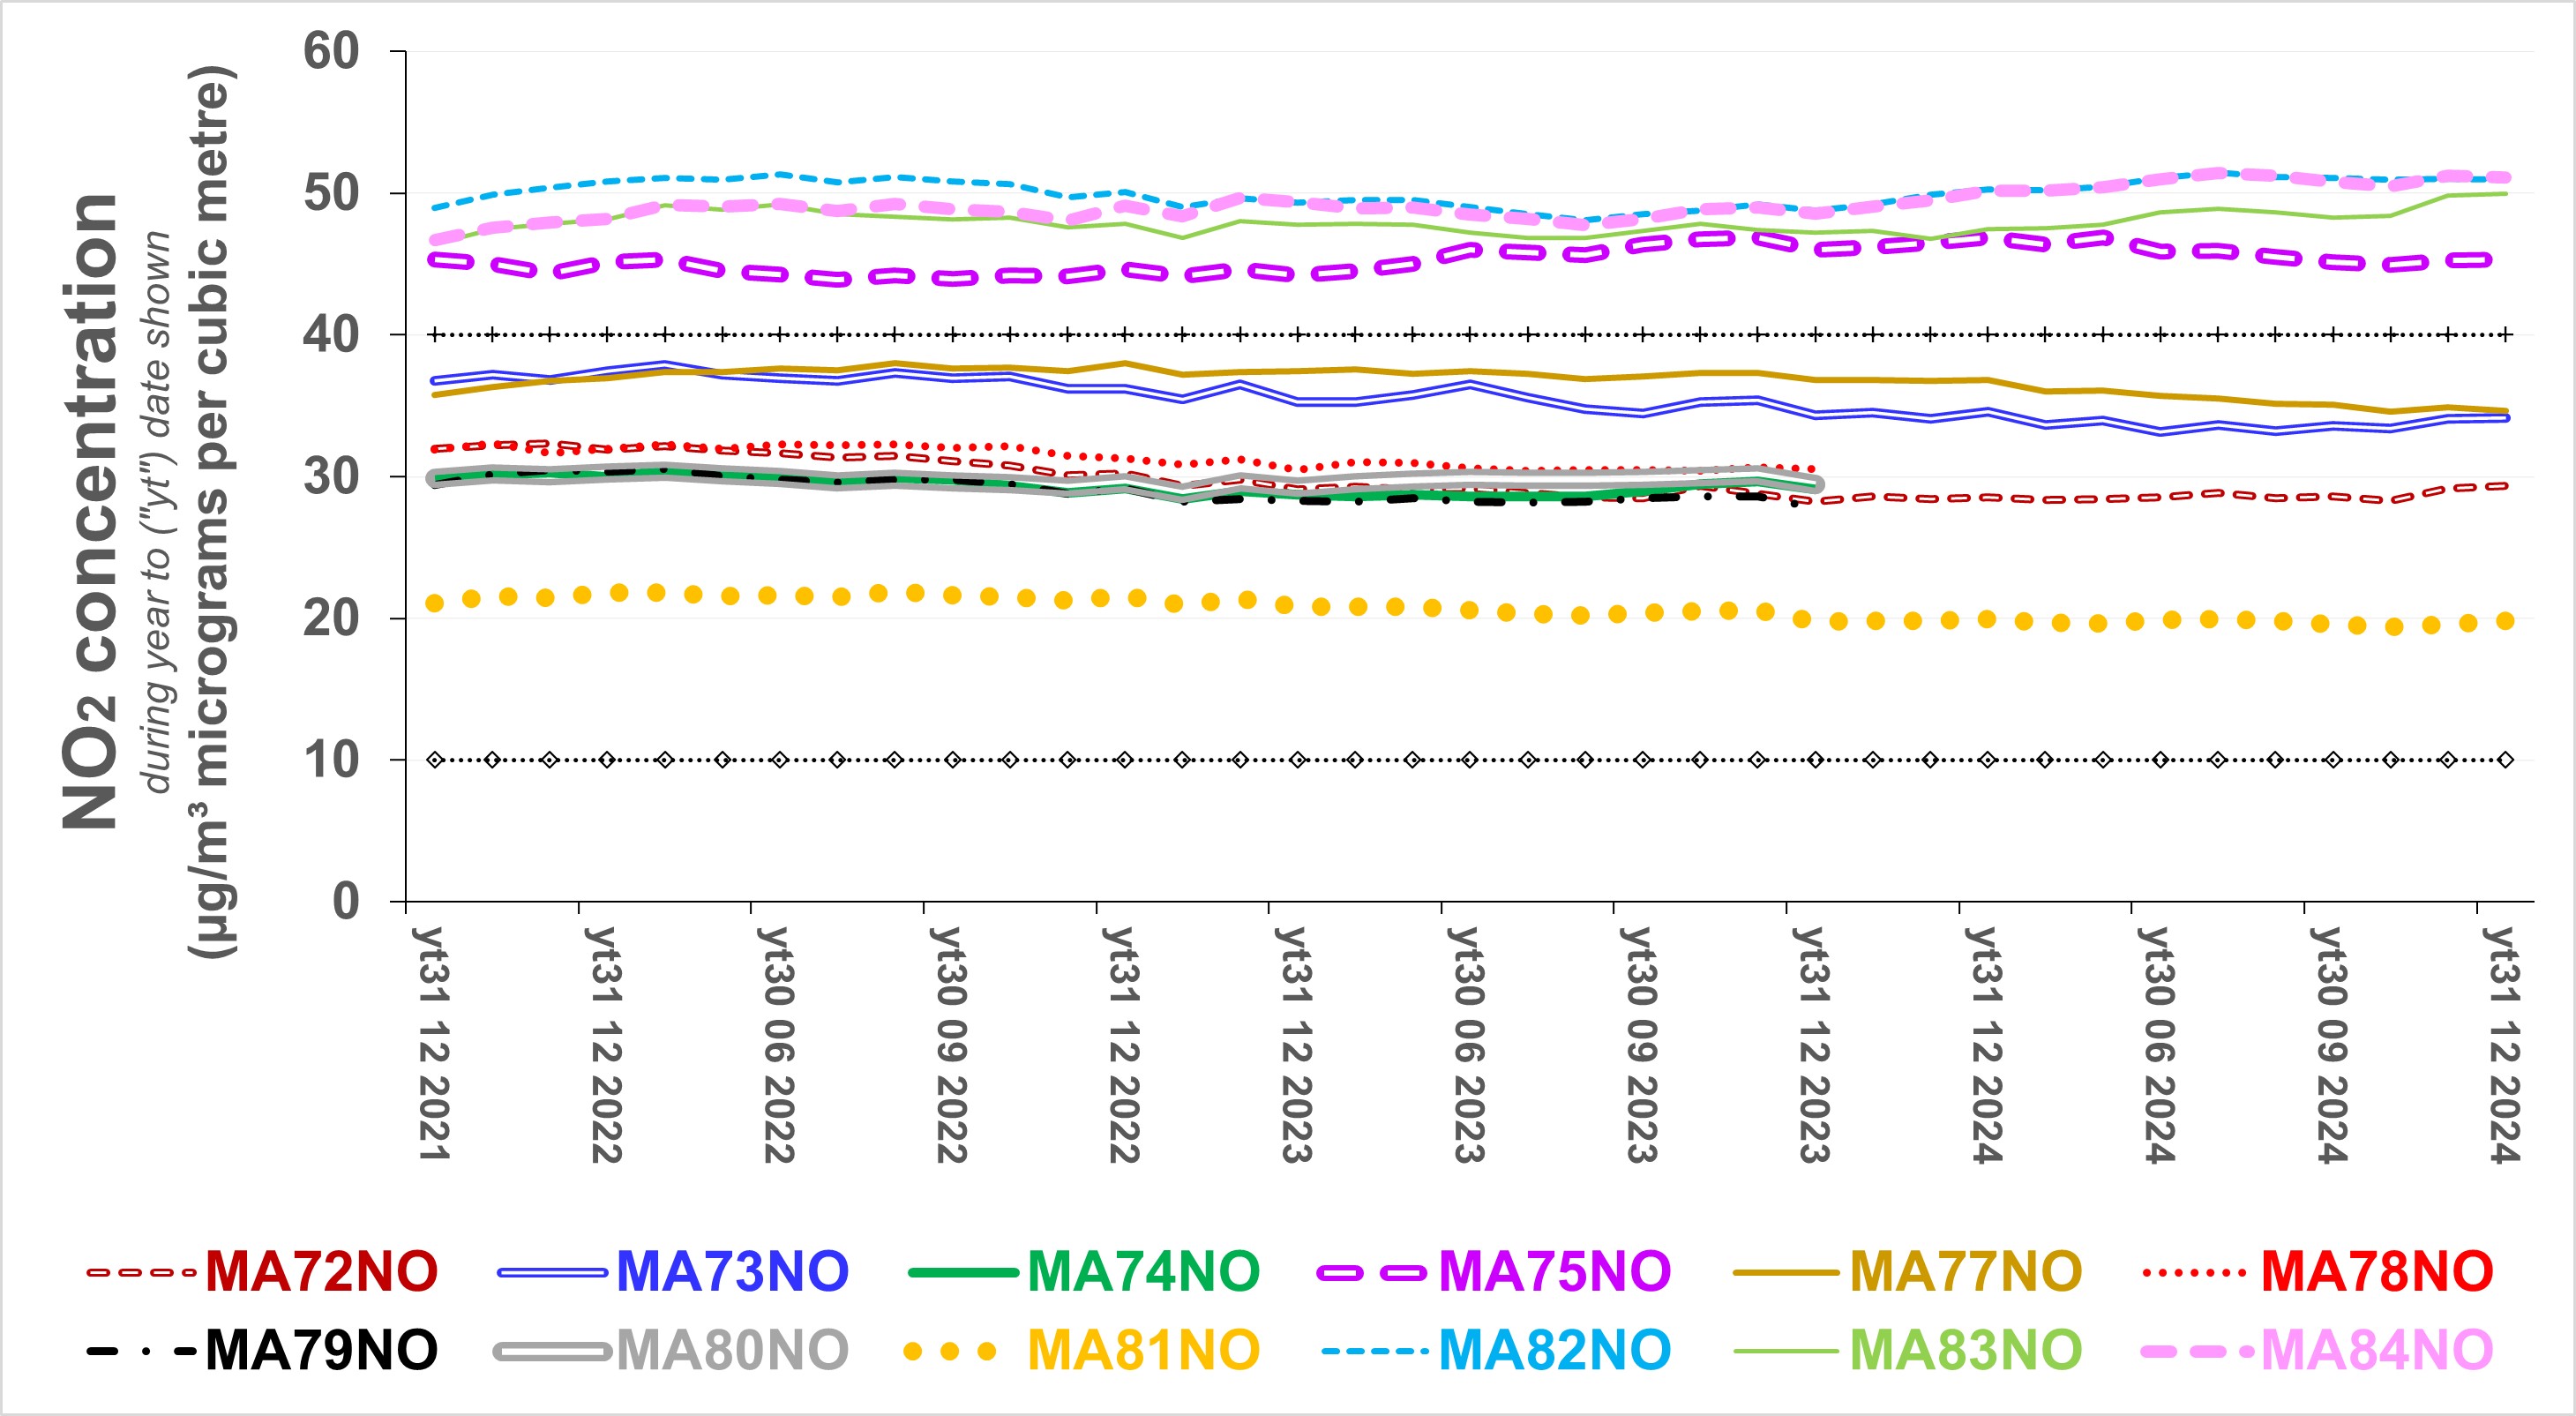
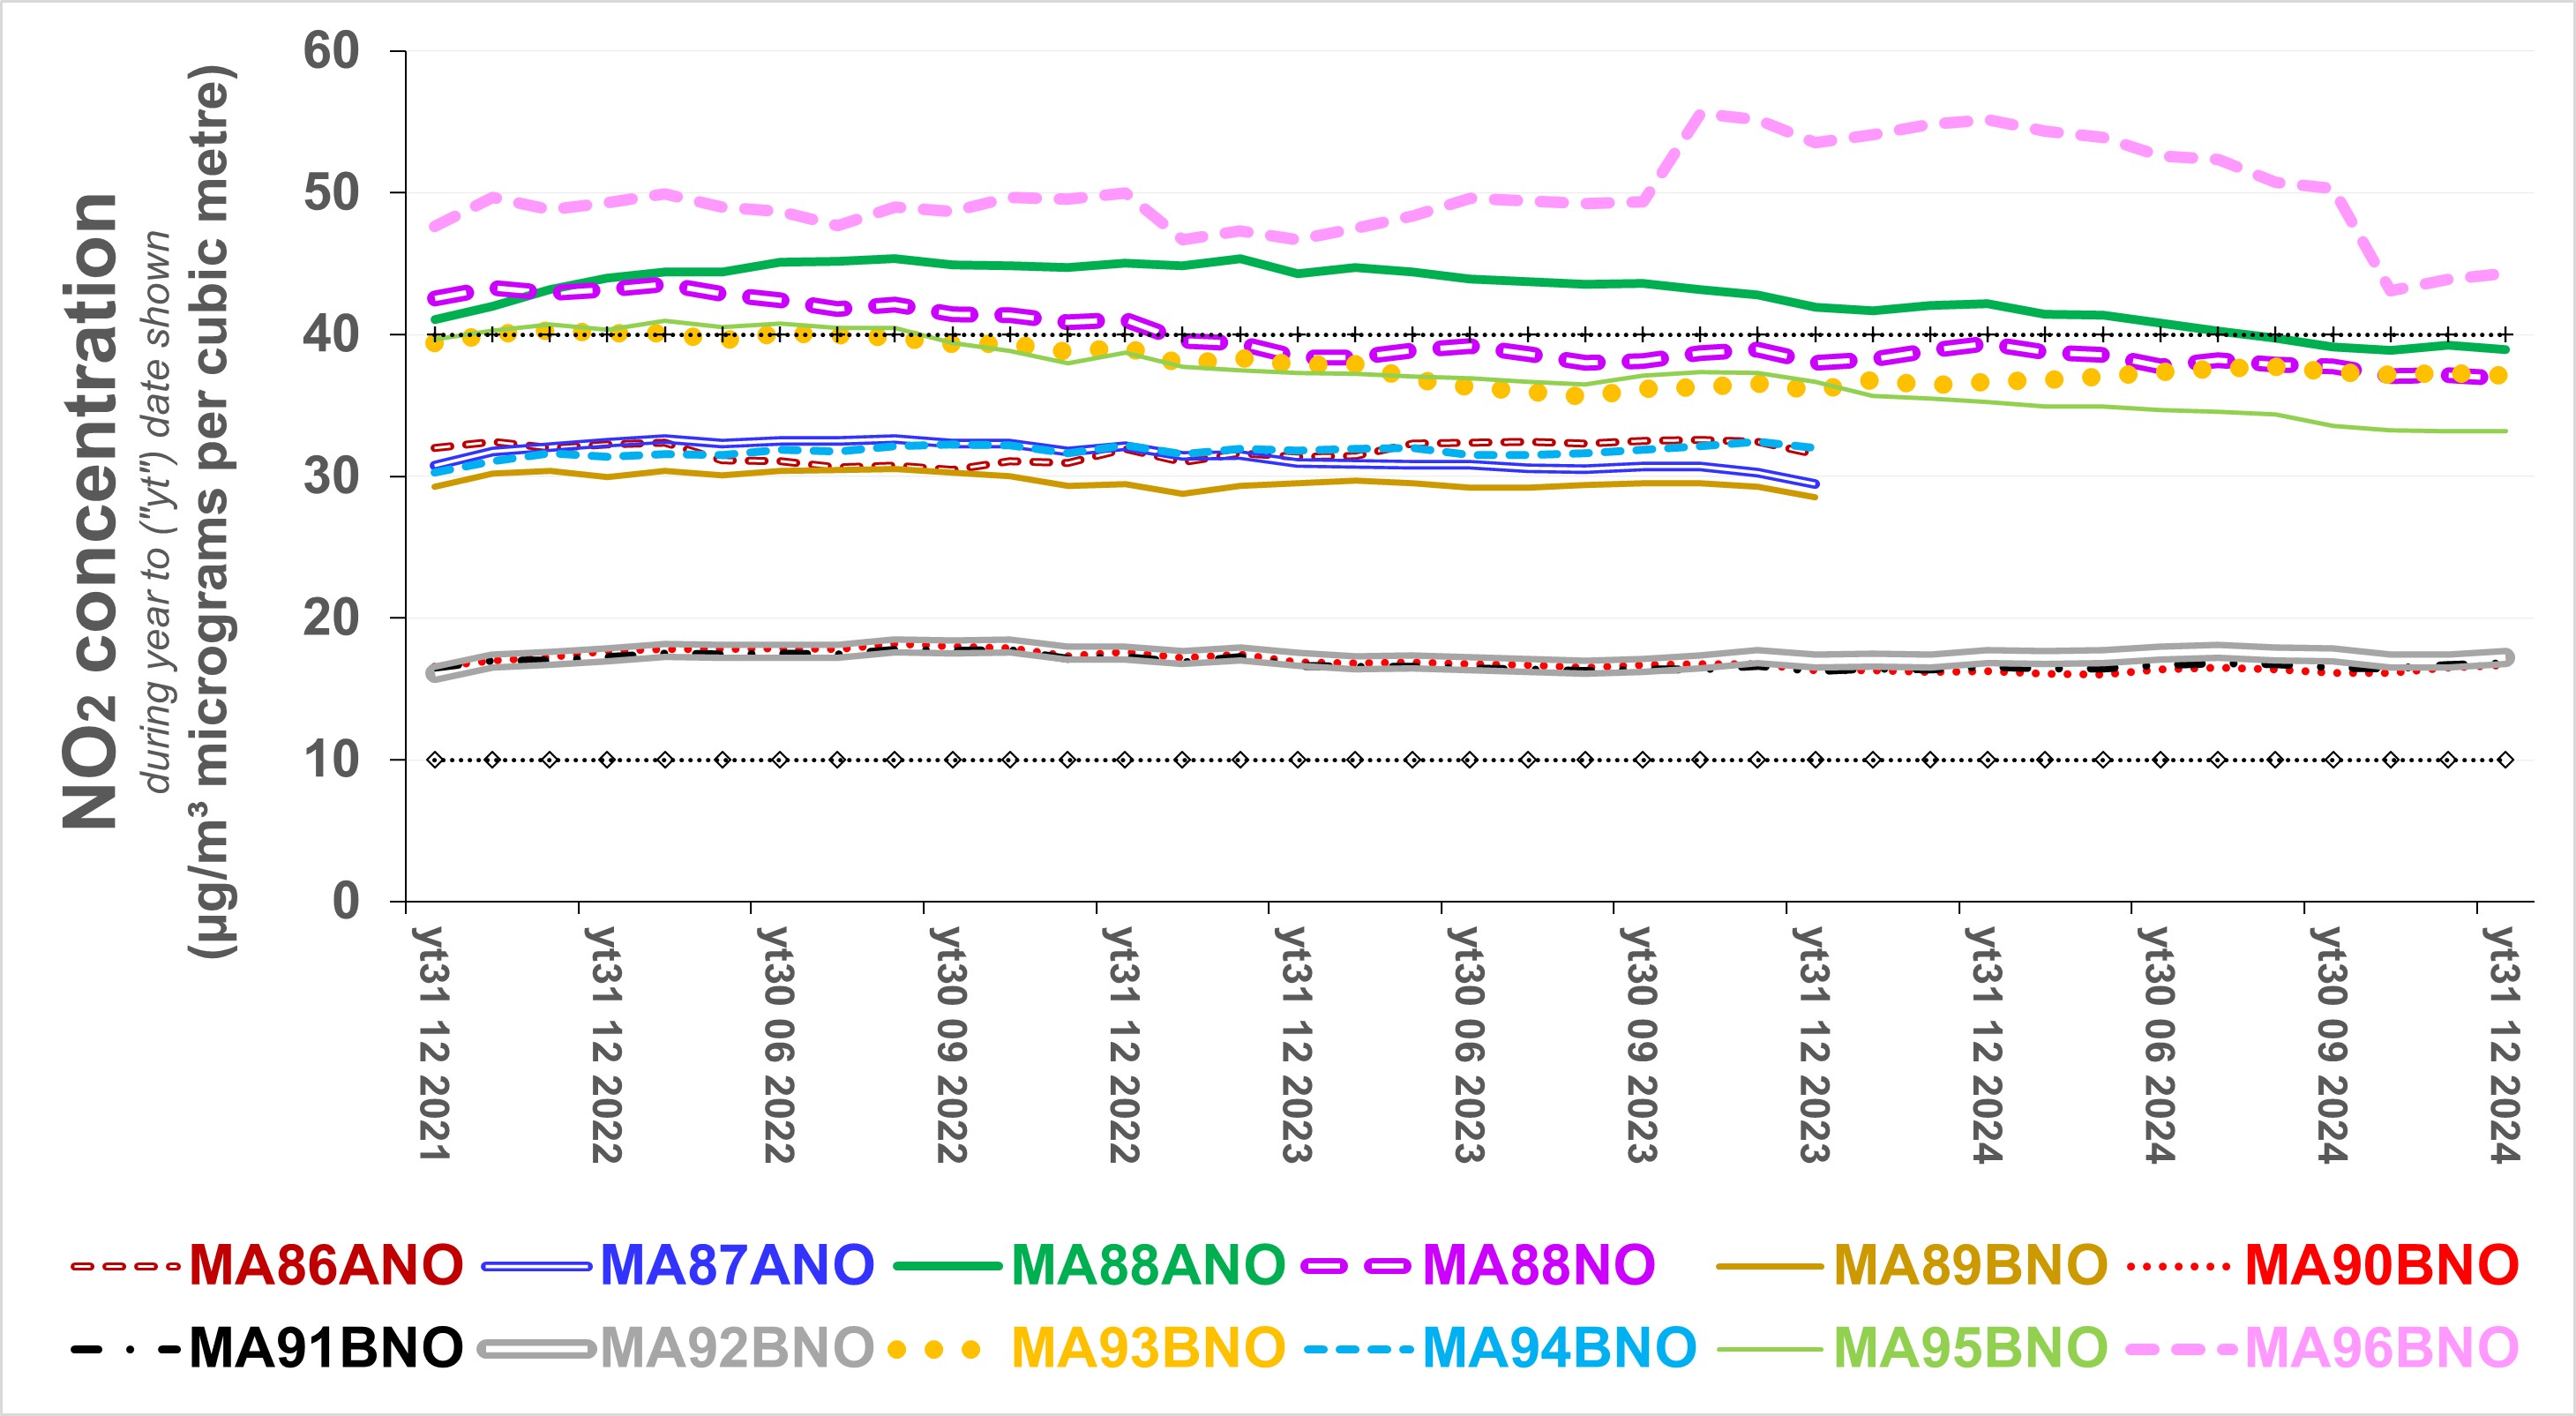
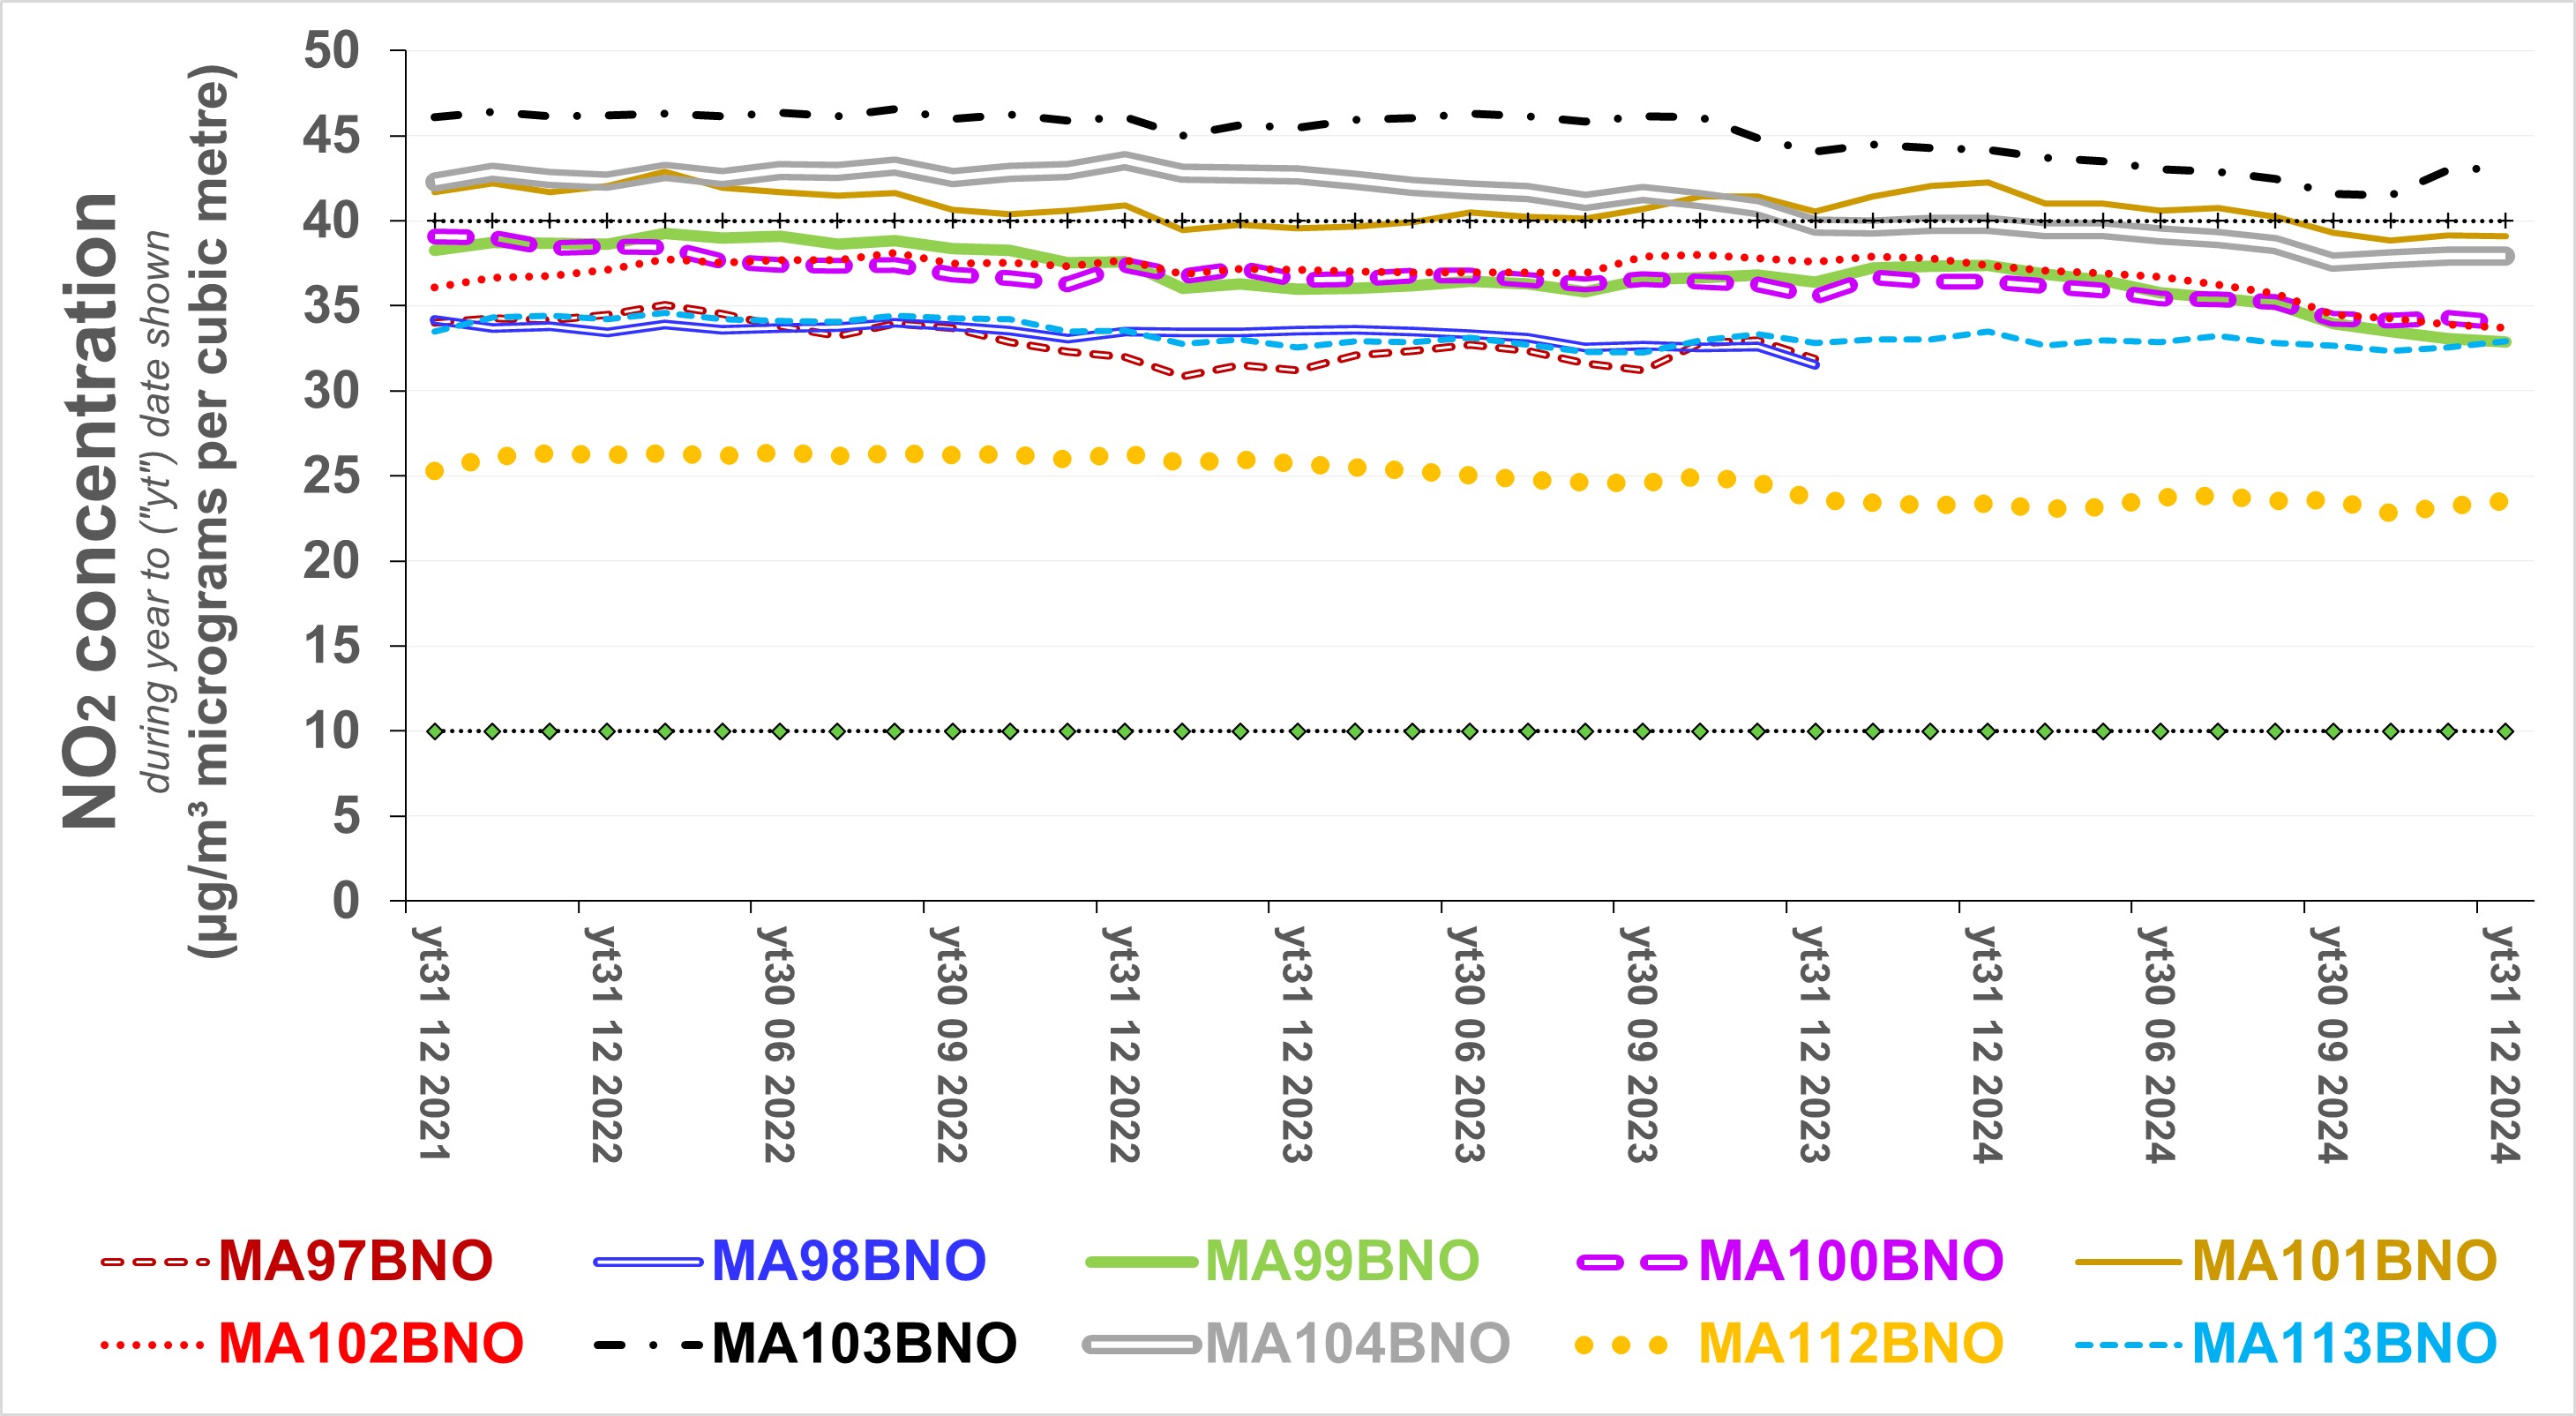
The following charts illustrate trends in nitrogen dioxide
concentrations measured using diffusion tubes for Manchester City
Council. The concentrations are not adjusted for bias and
include estimates where the monthly raw source data is either
missing or anaomalous. Source: Air Quality Annual Status Reports (various years)
Greater Manchester Combined Authority
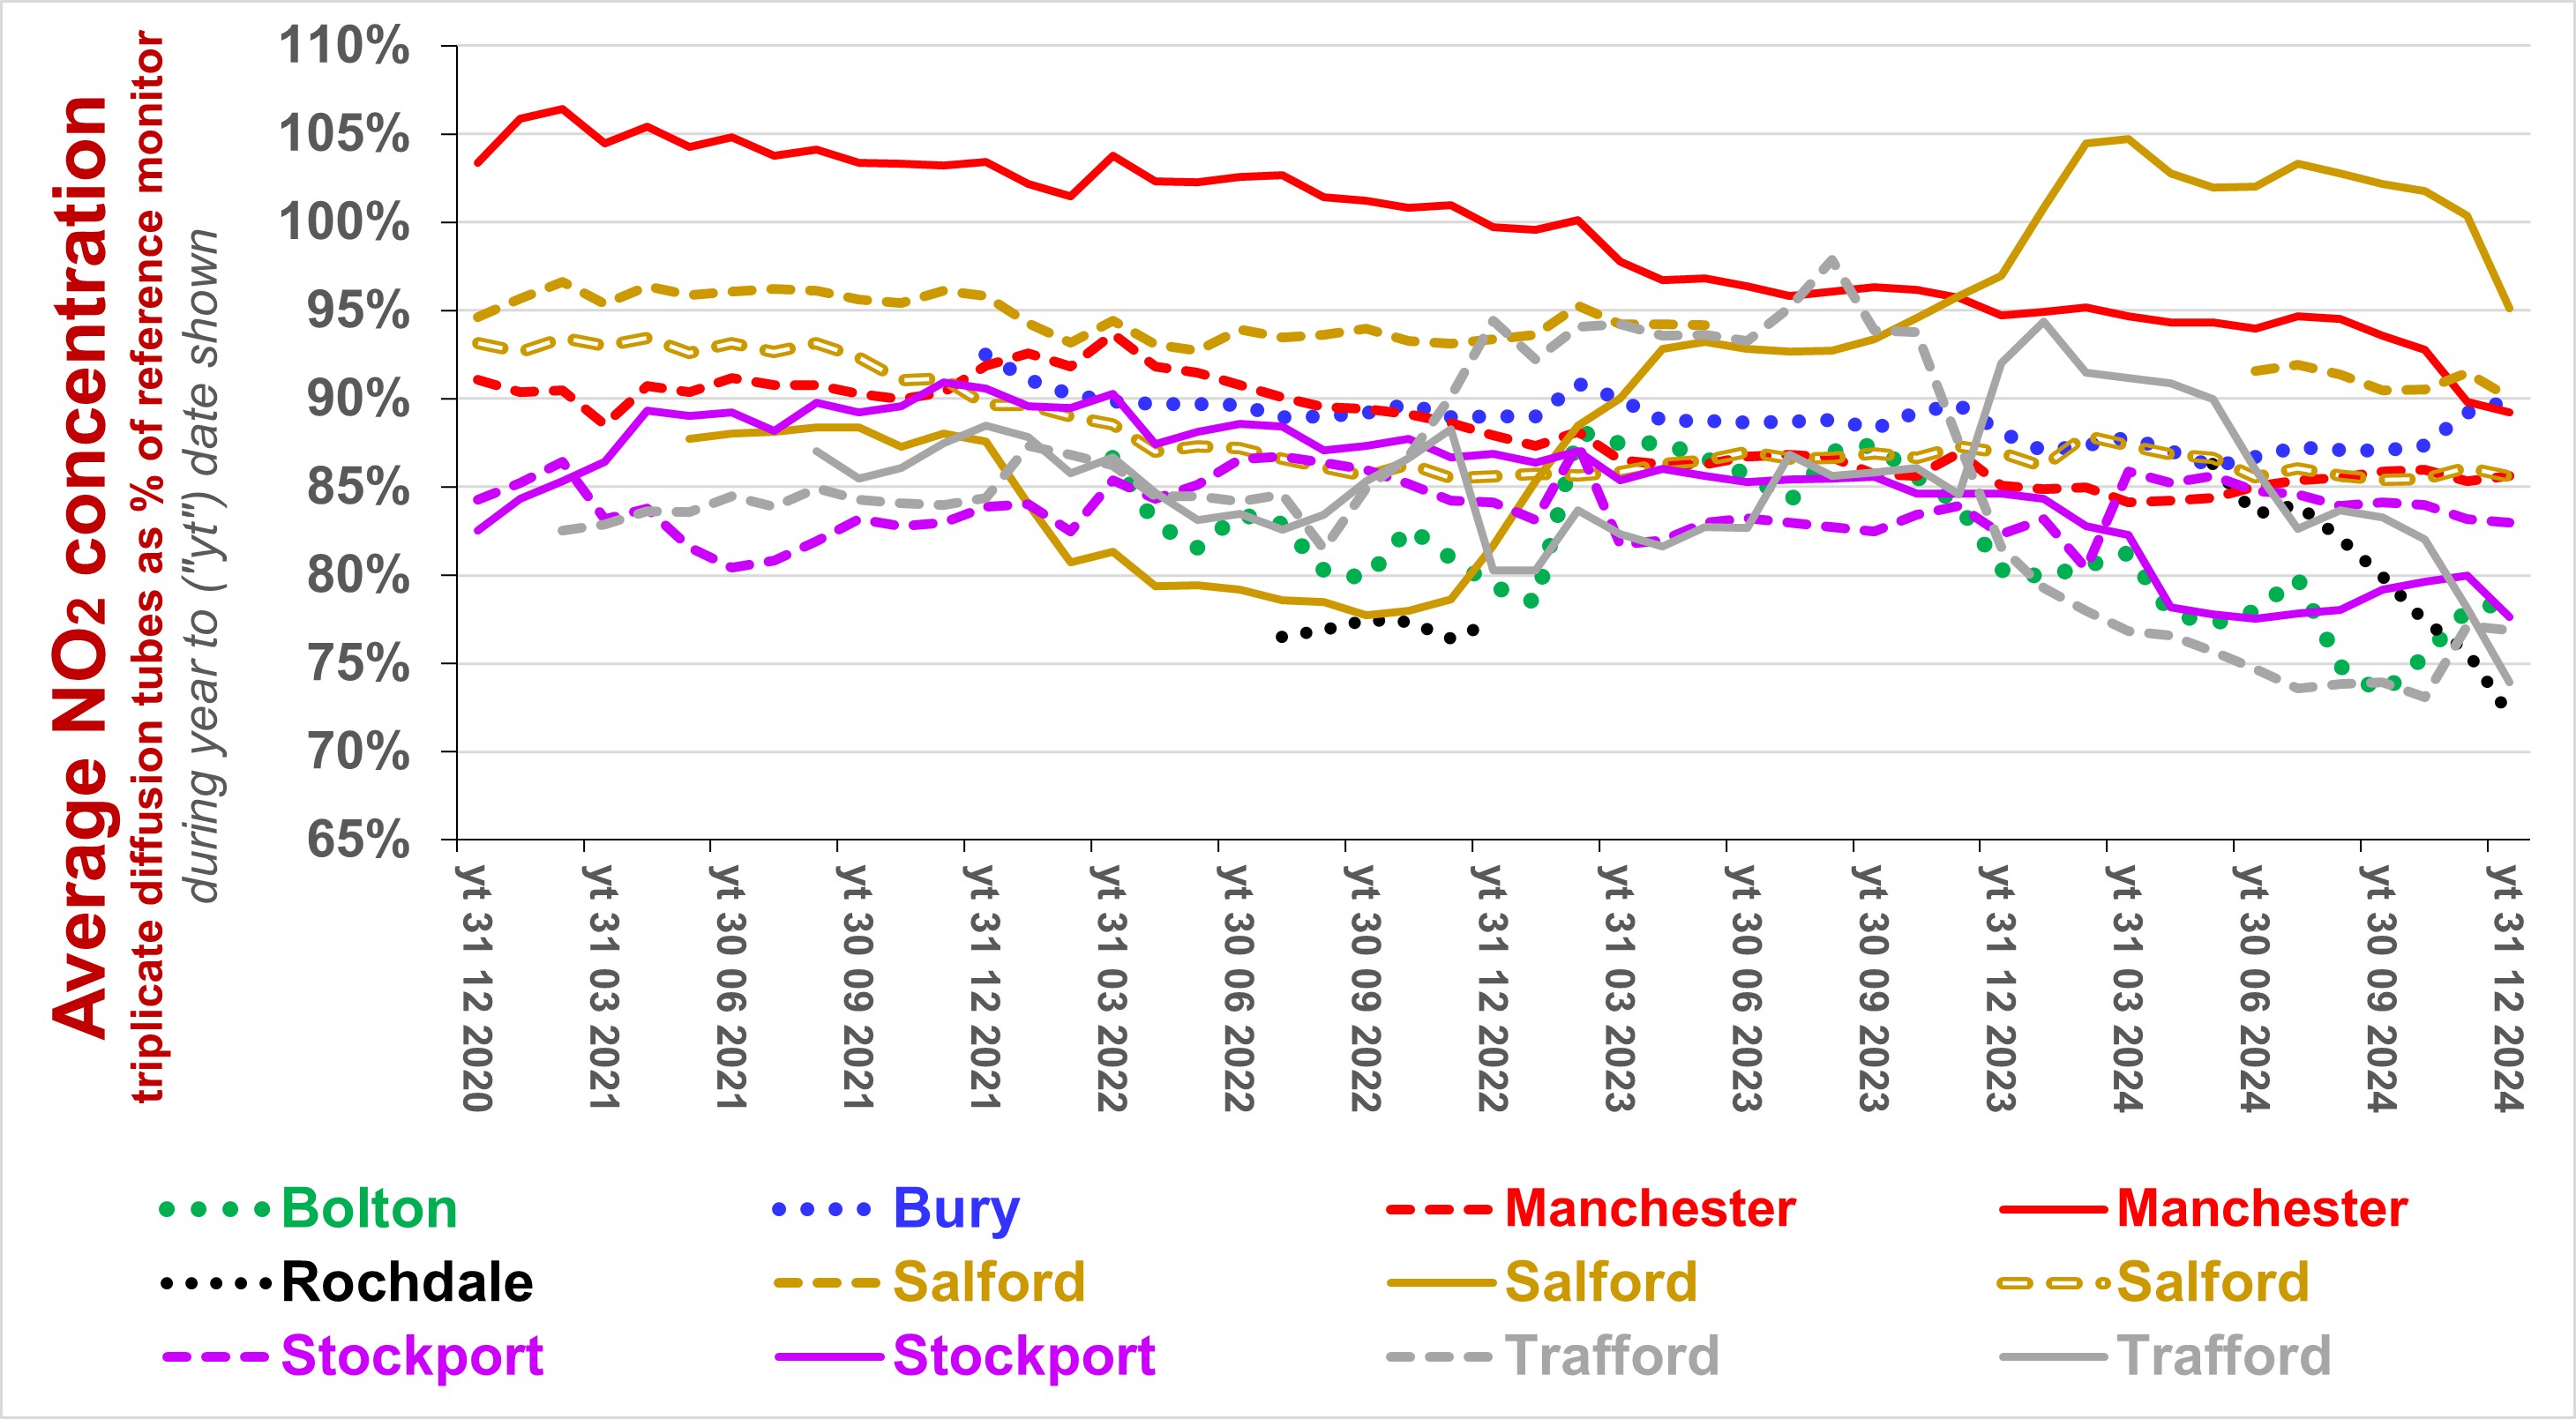
The source adopts (manufacturers
national) annual factors
accepted by DEFRA - of about 0.85 - with which to
multiply those concentrations to adjust for bias (so as to derive
a estimate of the actual concentration). This is consistent
with the following chart which illustrates how the actual bias has
fluctuated during successive periods of 12 months for most of the
sites where diffusion tubes are co-located with reference
monitors.
|
|
For further information, please contact: info@airqualitymatters.uk |
| Back |
|
|