|
AIR QUALITY MATTERS |
|
Borough of Hillingdon |
|
|
|
The following trio of charts illustrate trenda in the concentration of nitrogen dioxide ("NO2") , and particulate matter (both PM10 and PM2.5) as measured by reference monitors. The variation tends to be most evident in locations away from busy urban areas, such as at Haringey's Priory Park South site (shown in the chart below). Source: based on Air Quality England (provisional since early 2023)
|
|
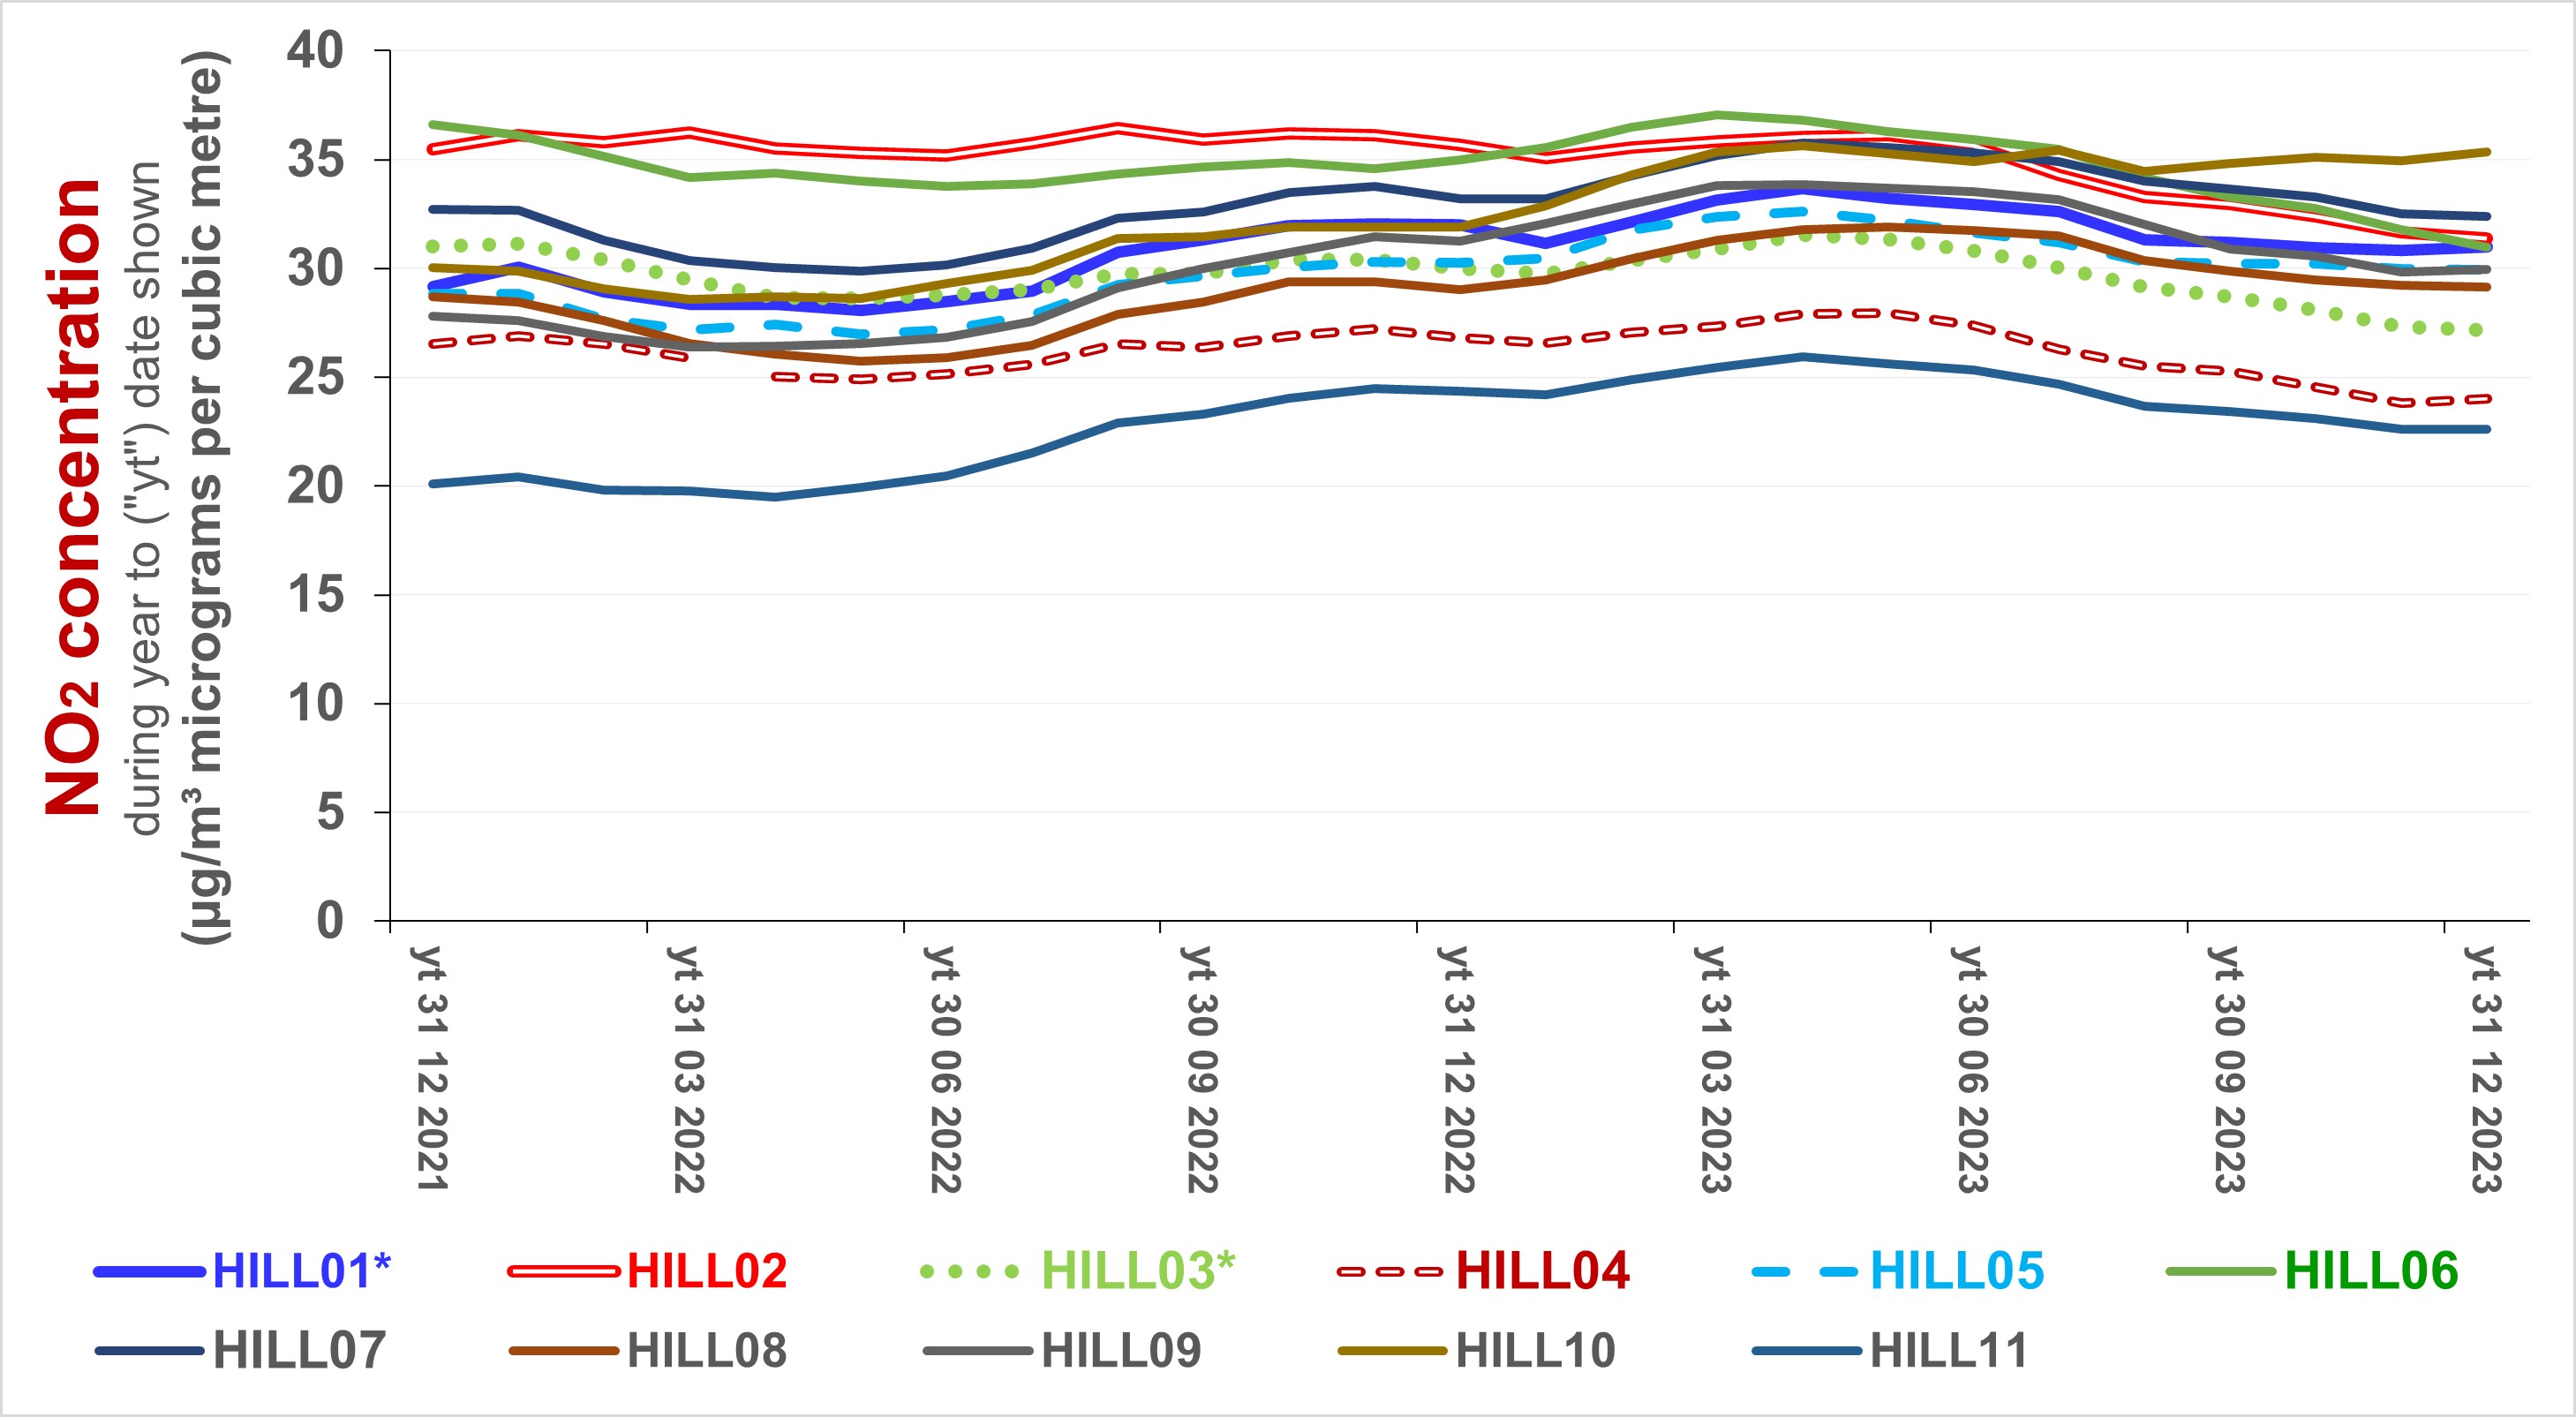
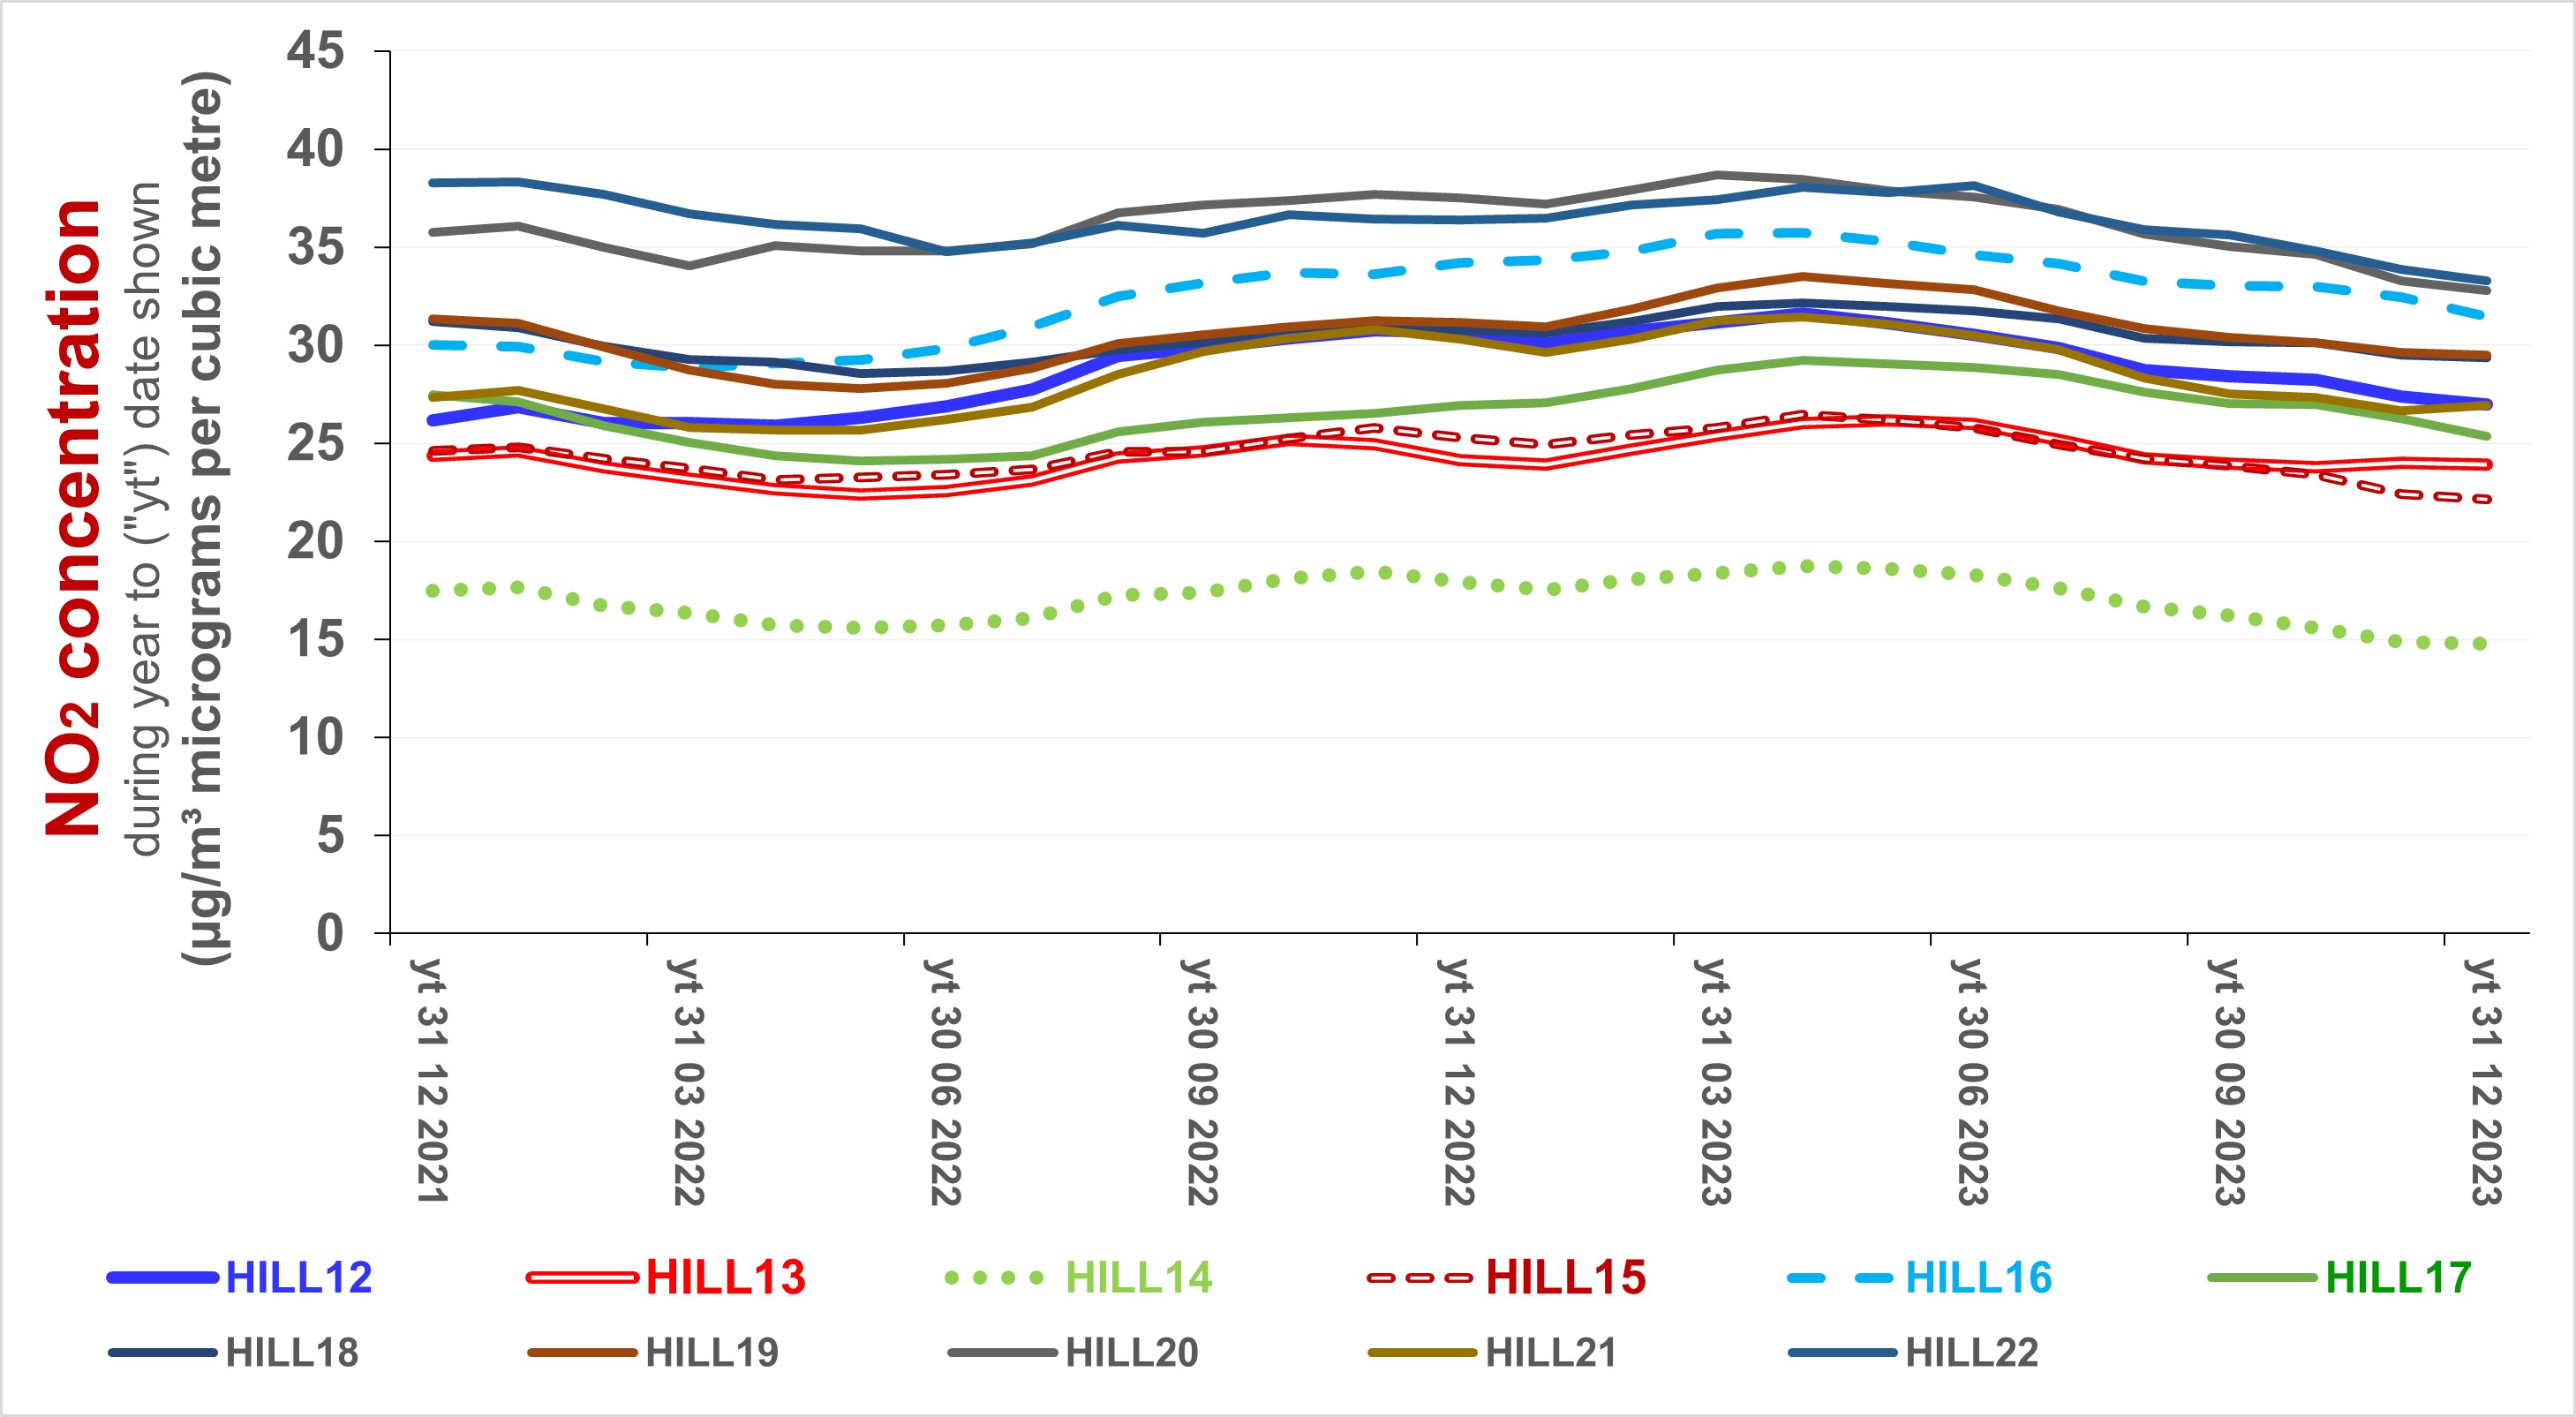
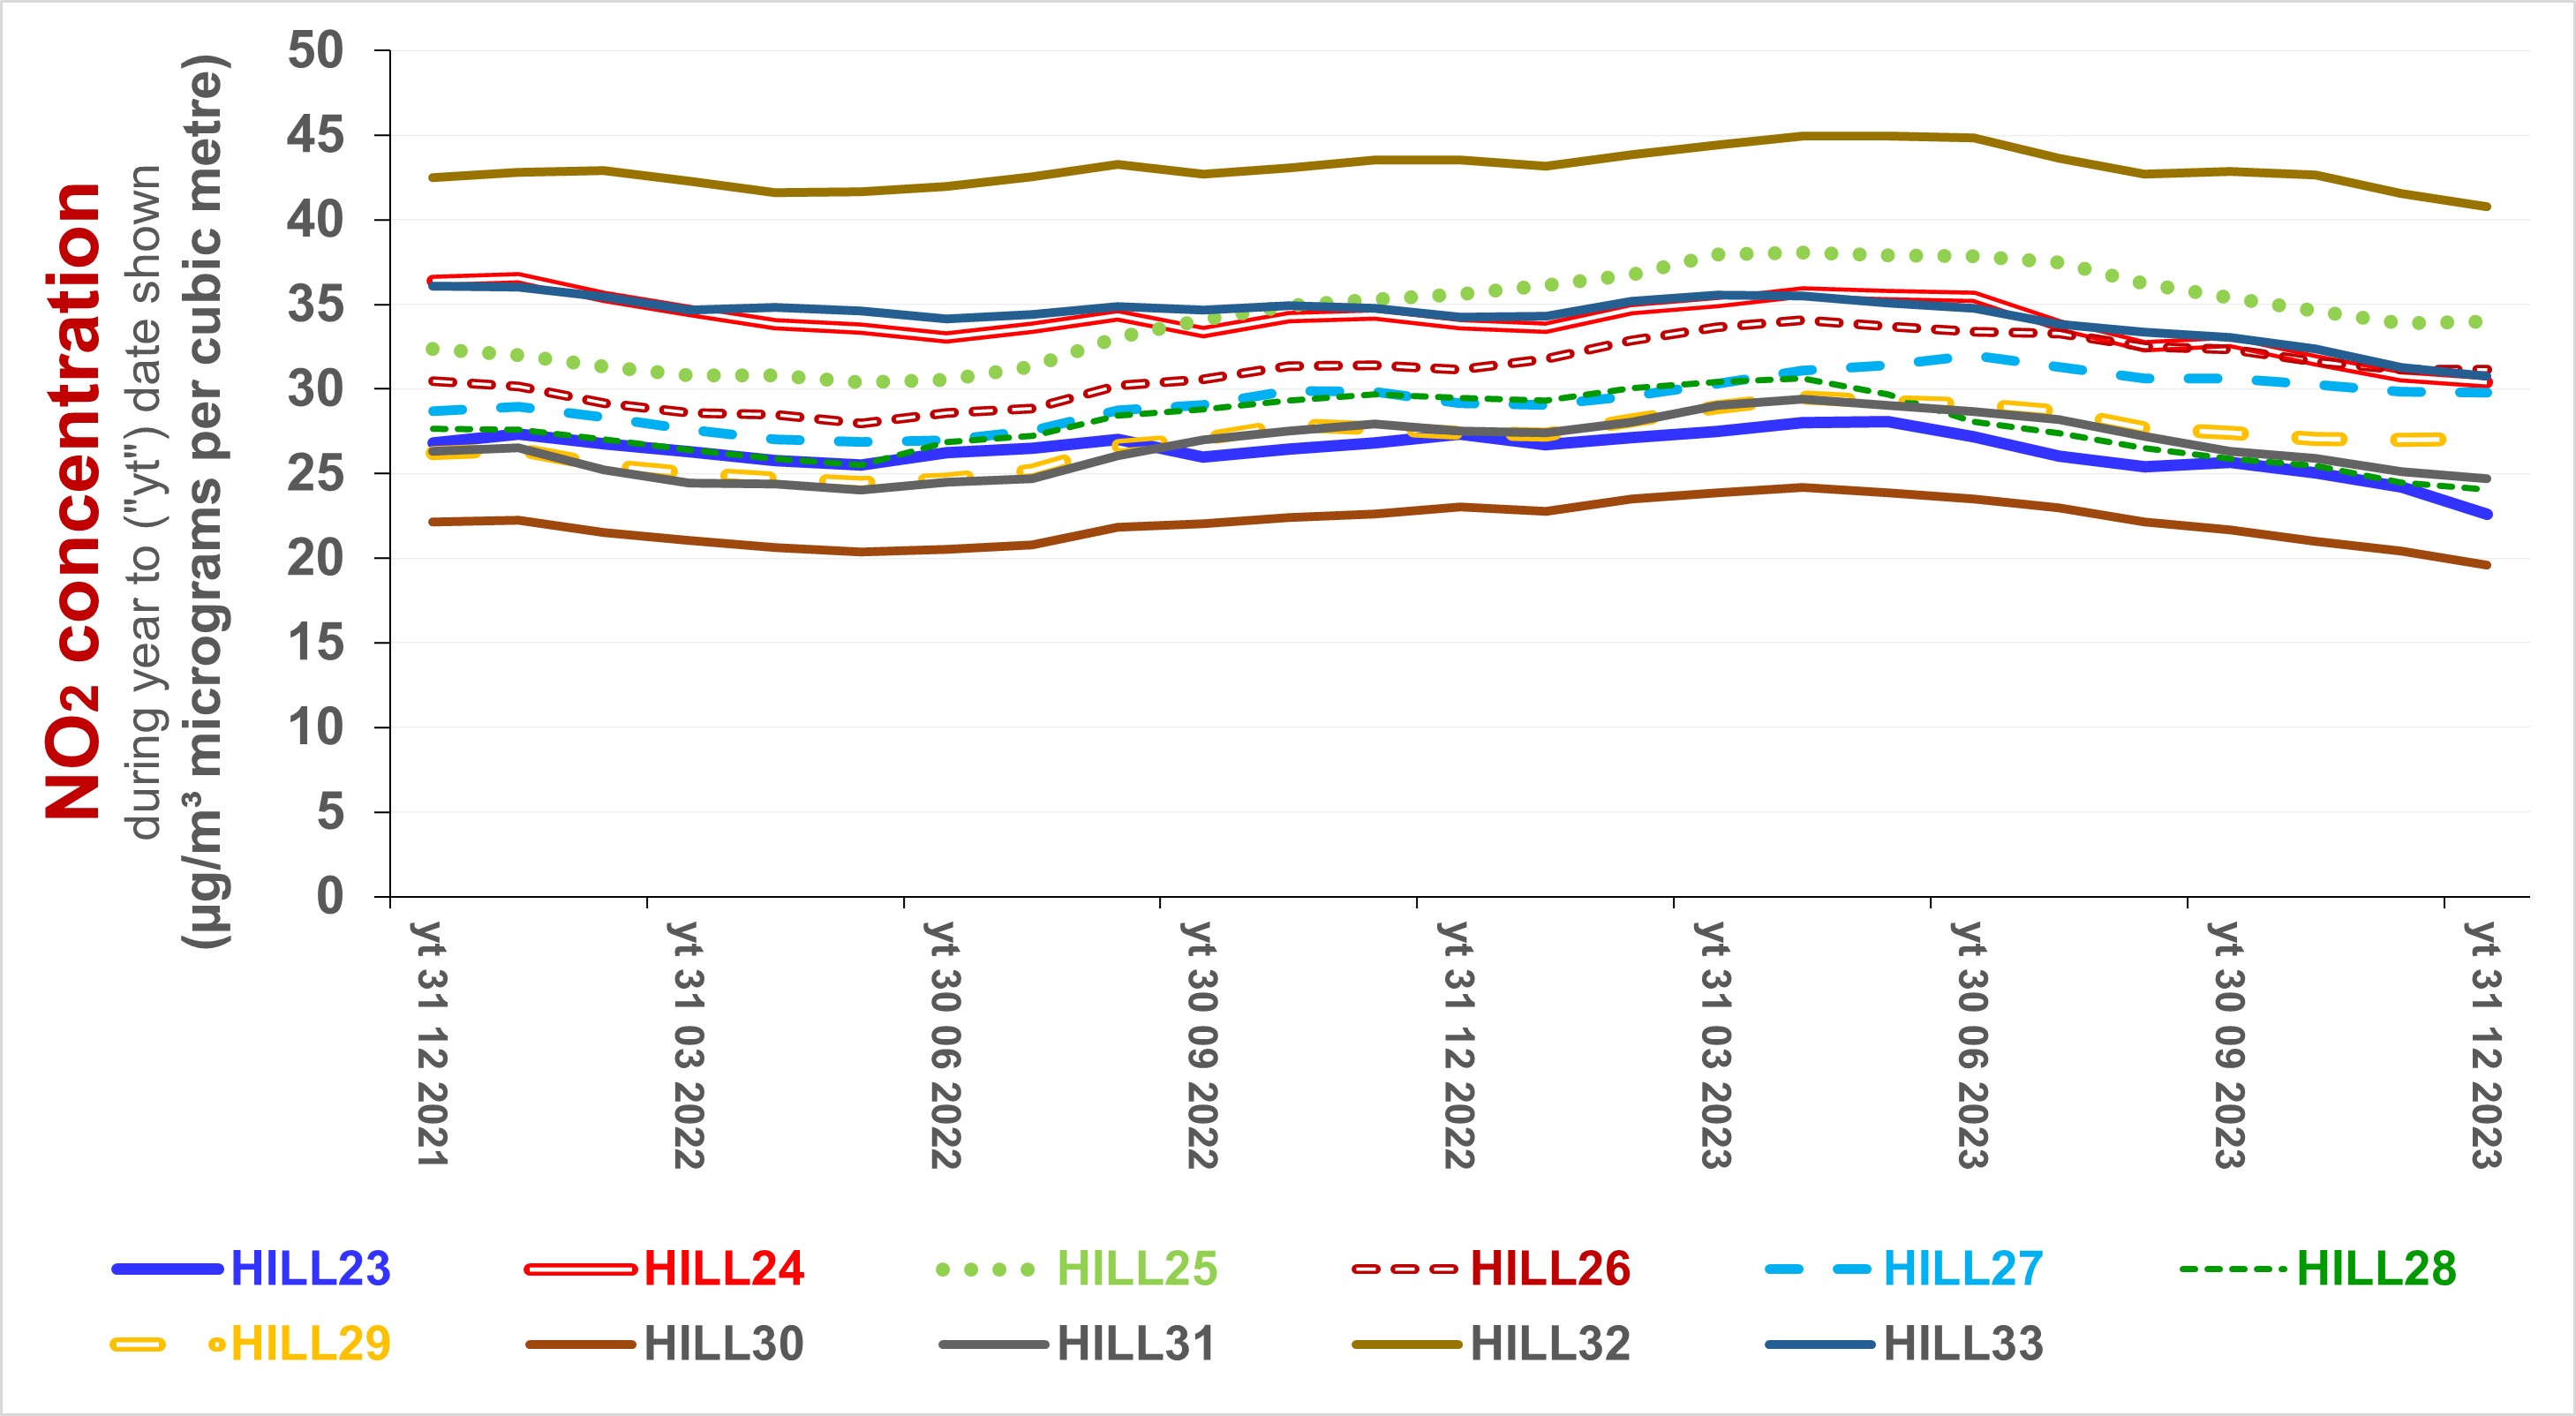
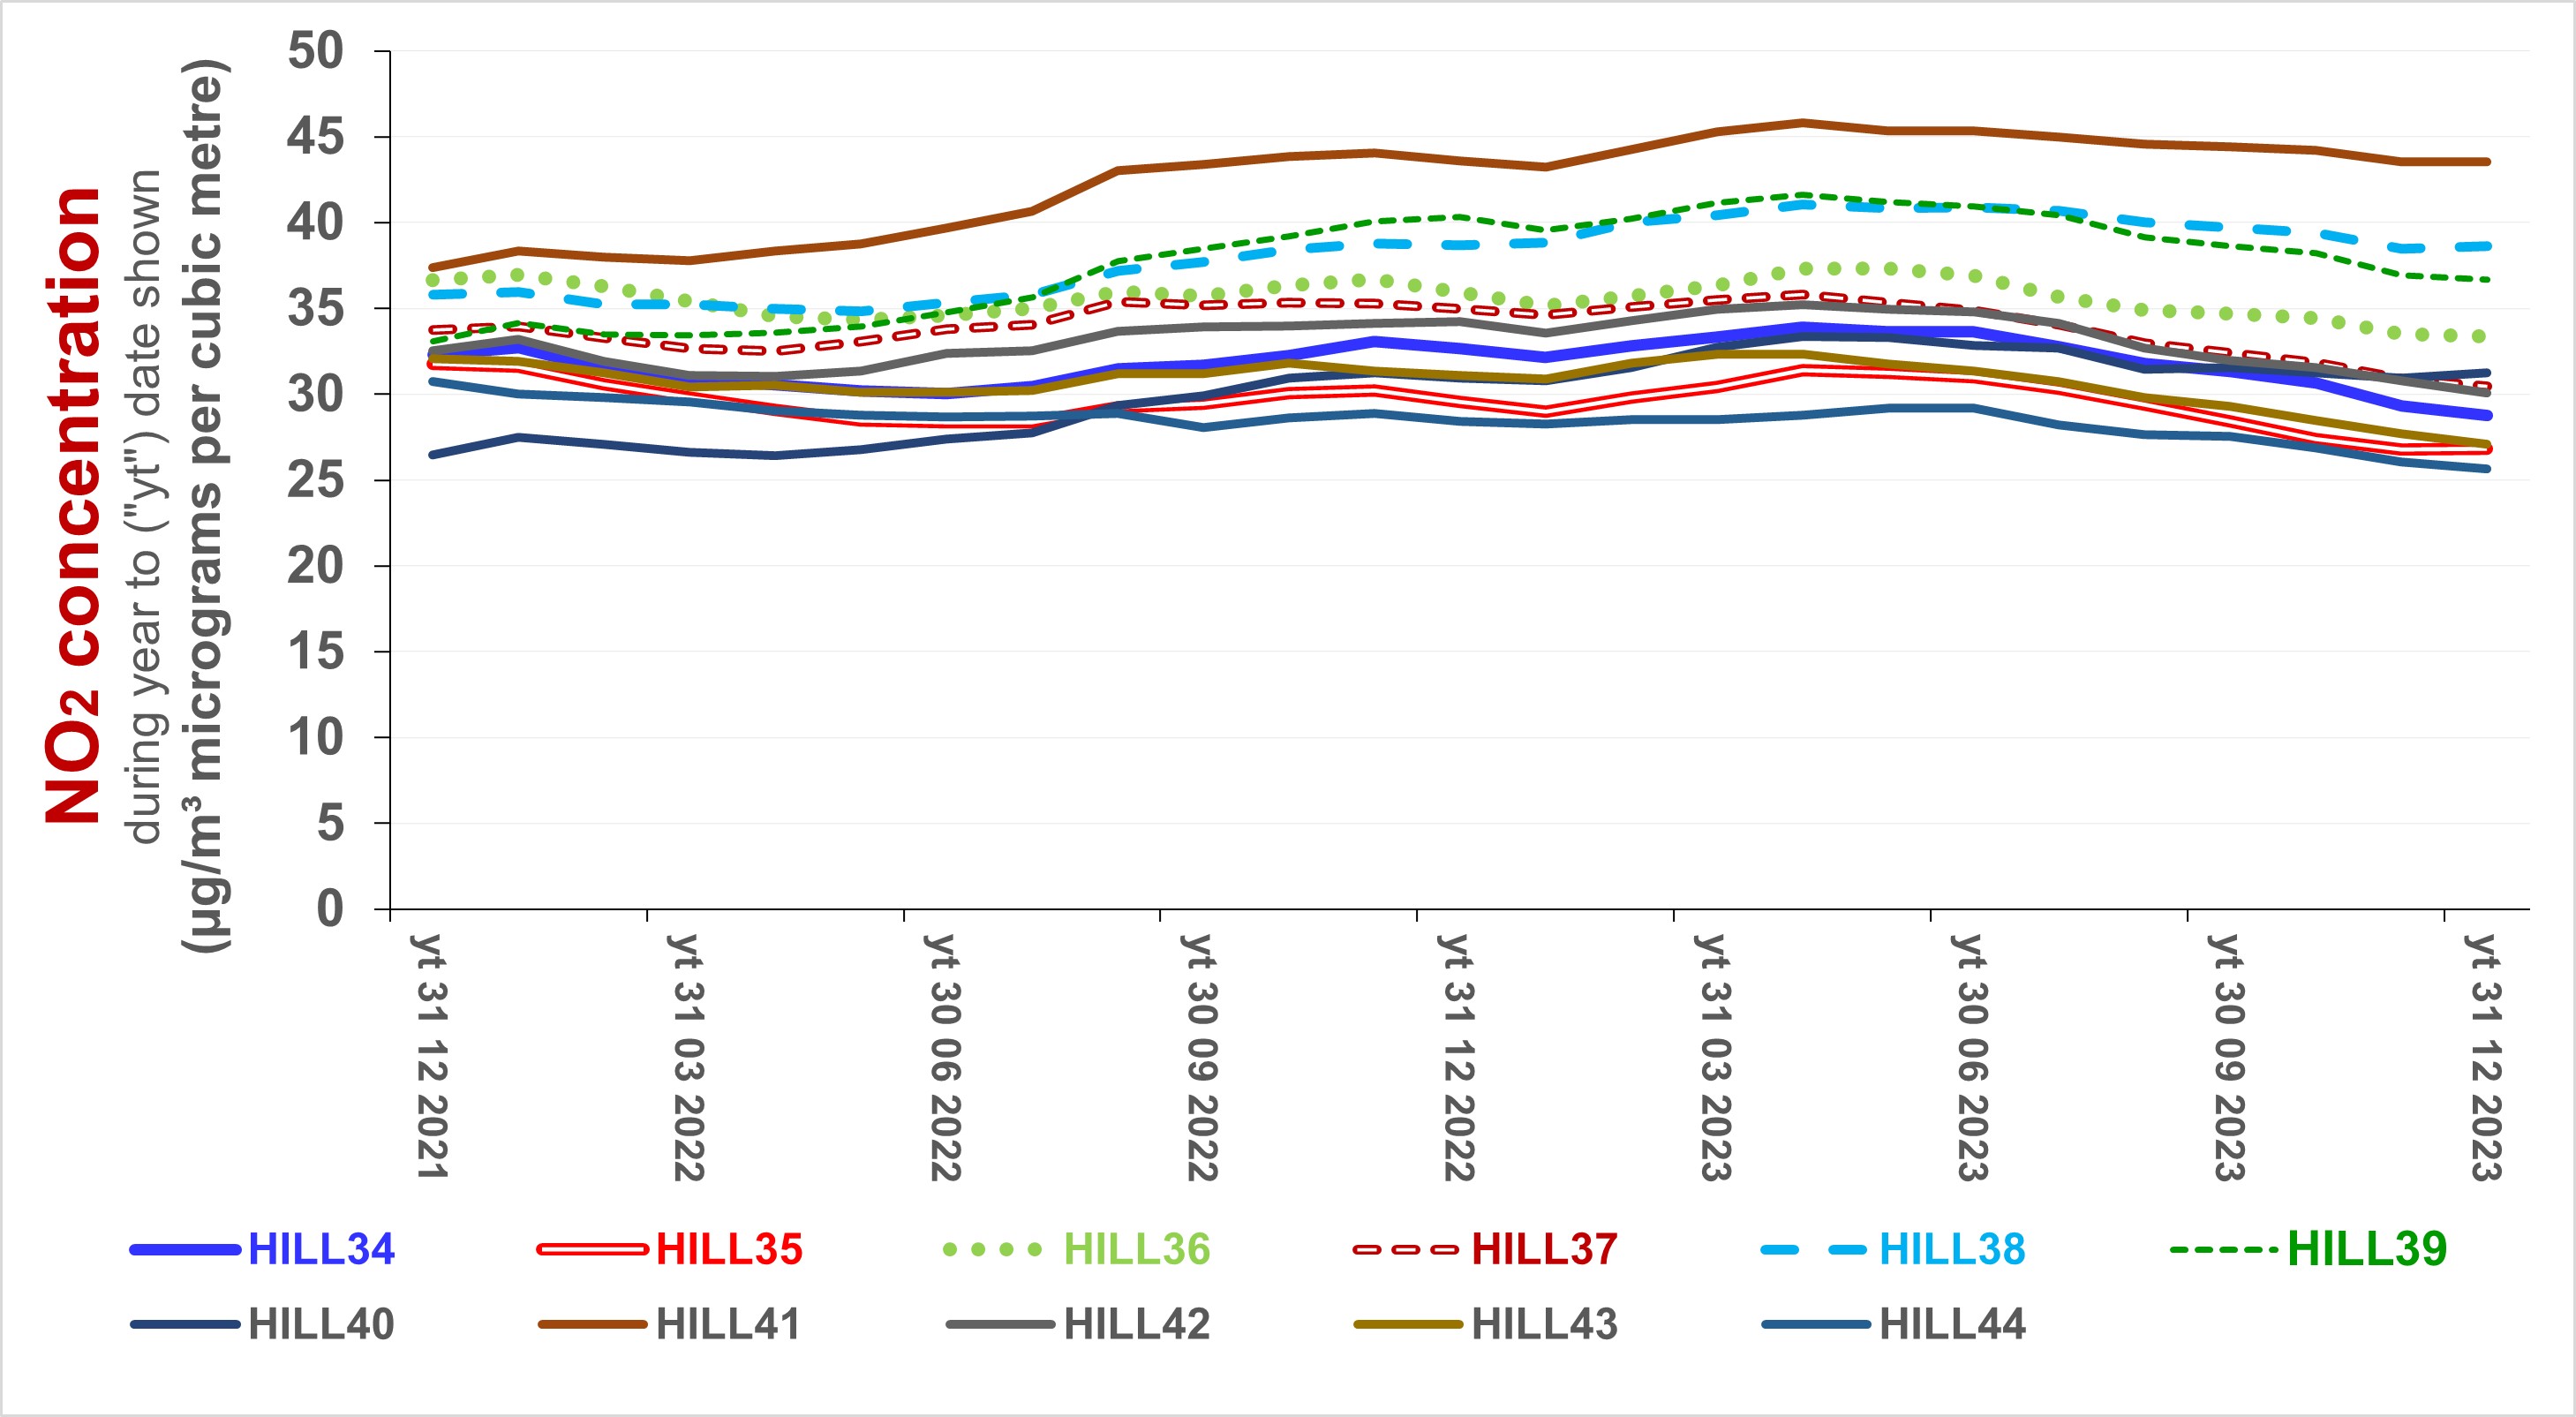
The quartet of charts below illustrate trends in the concentration of nitrogen dioxide as indicated (without adjustment for bias) in the borough's Air Quality Annual Data Reports
|
|
For further information, please contact: info@airqualitymatters.uk |
| Back |