|
AIR QUALITY MATTERS |
|
Borough of Haringey |
|
|
|
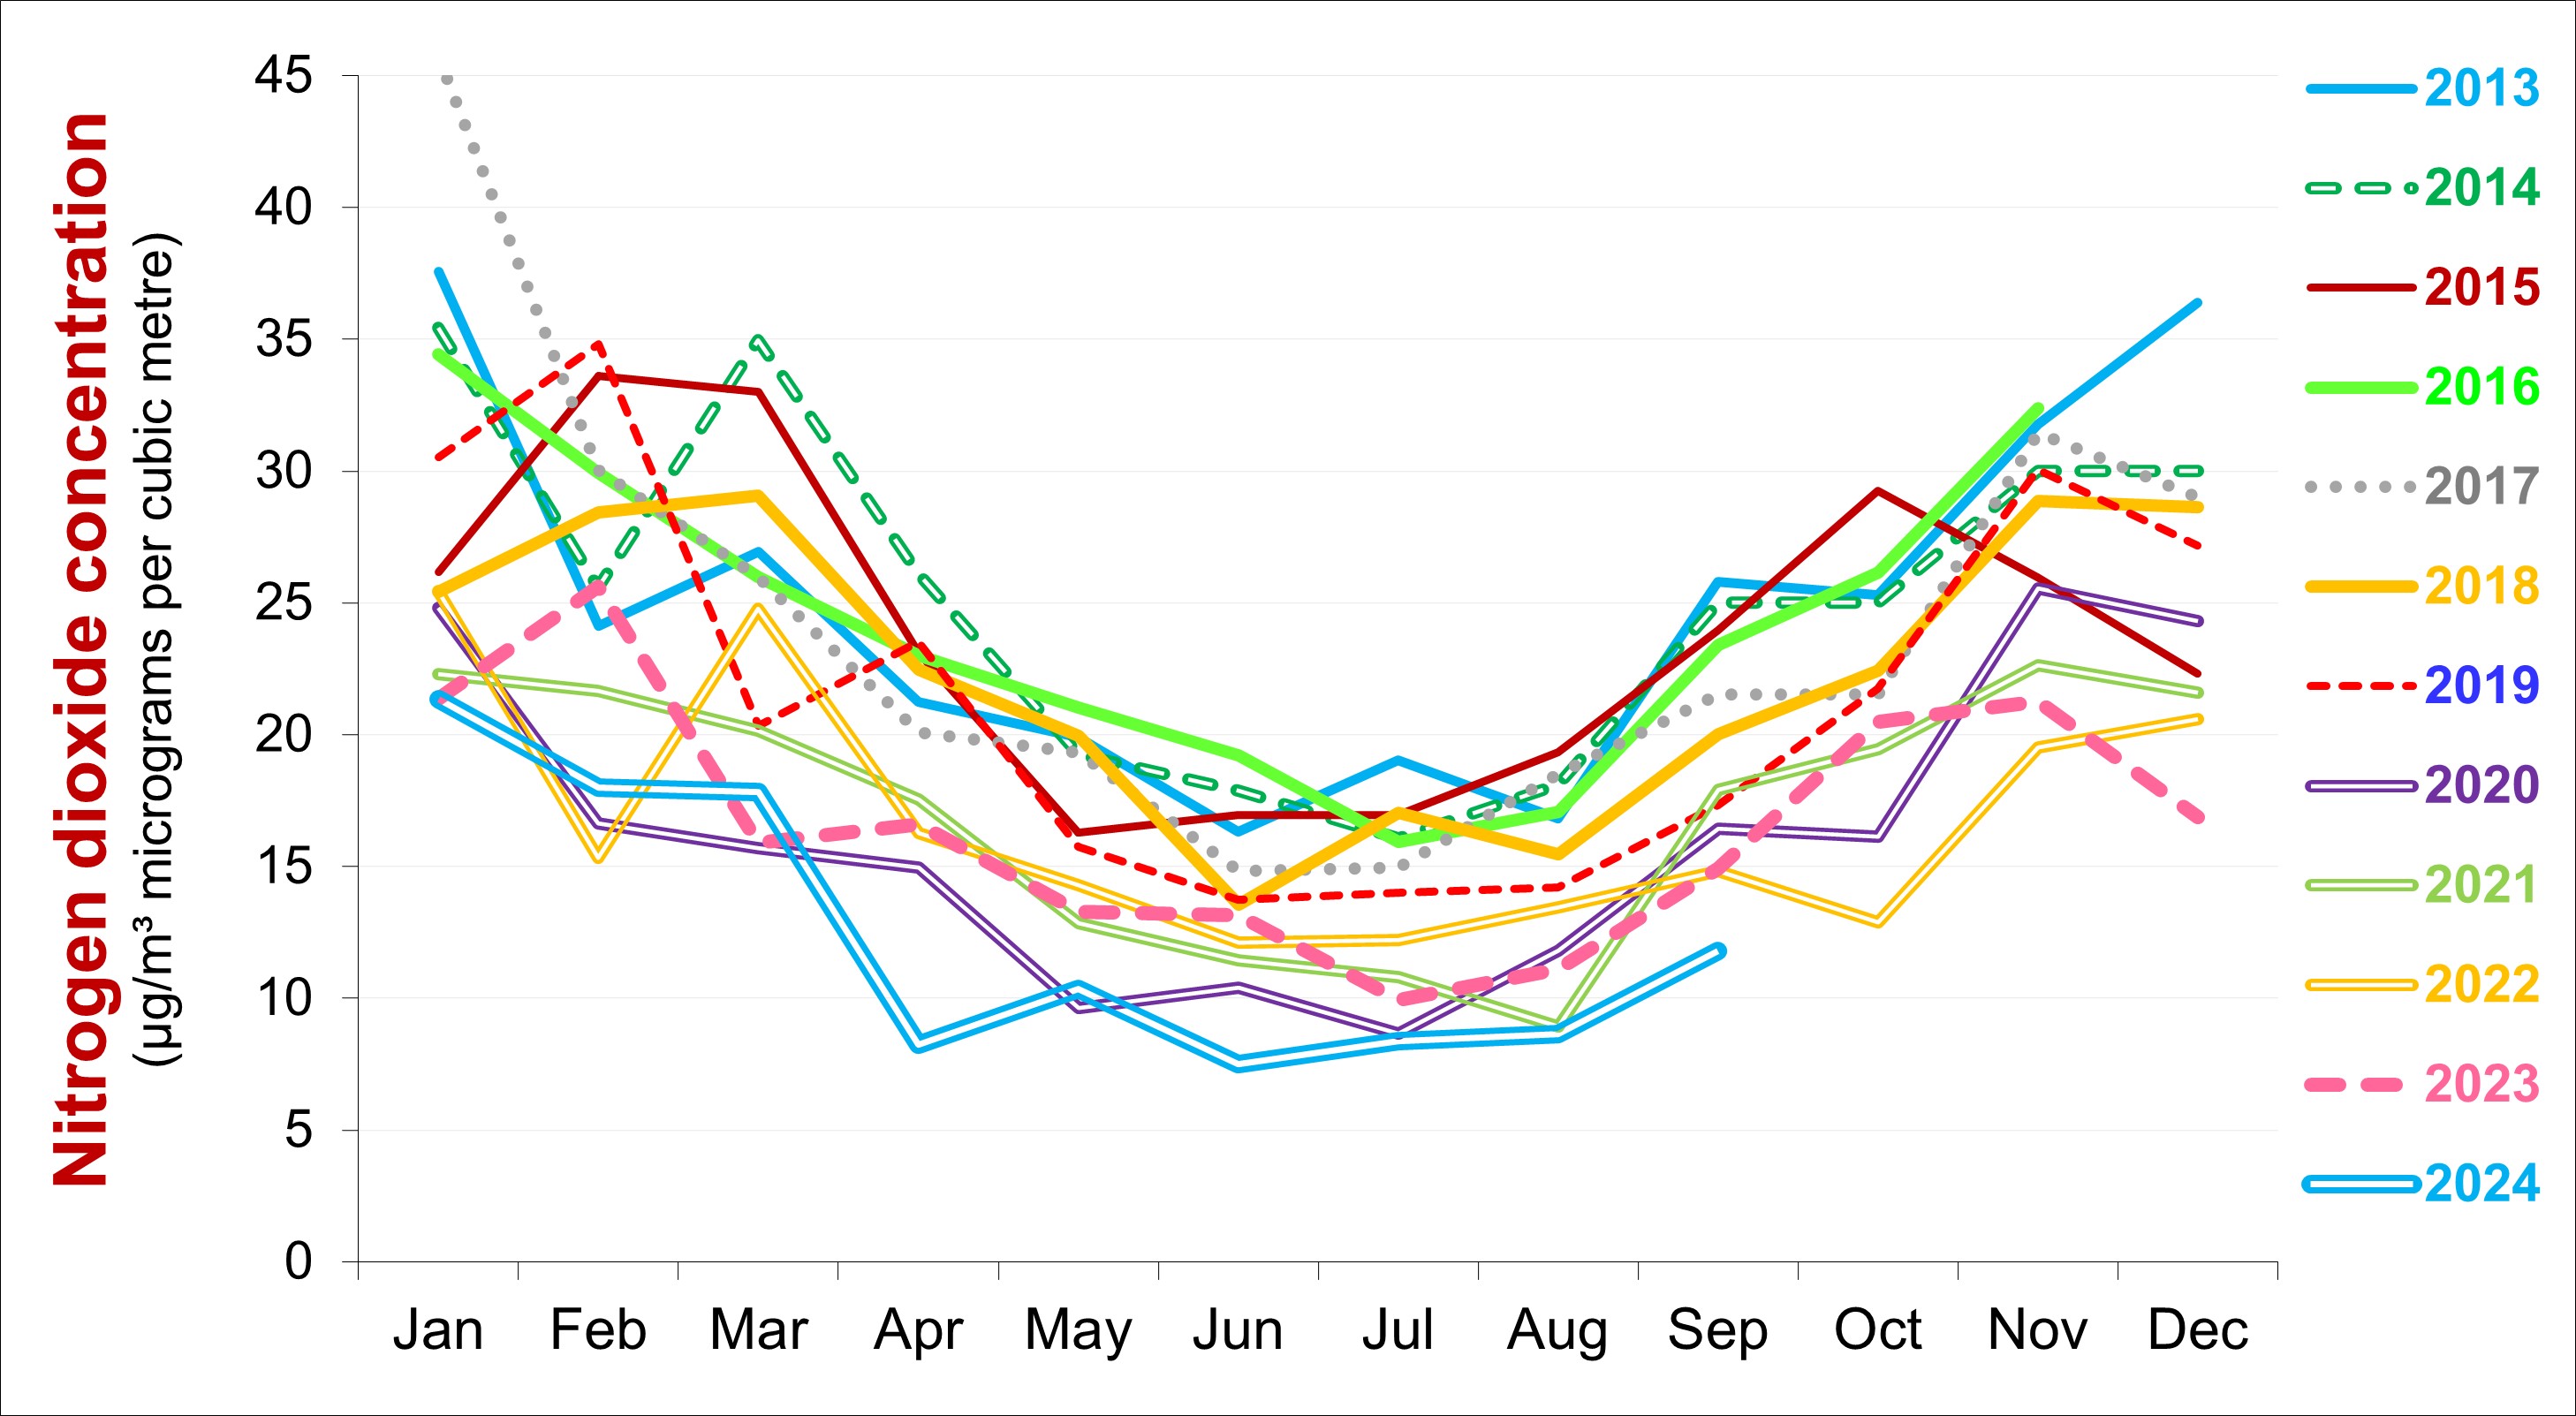
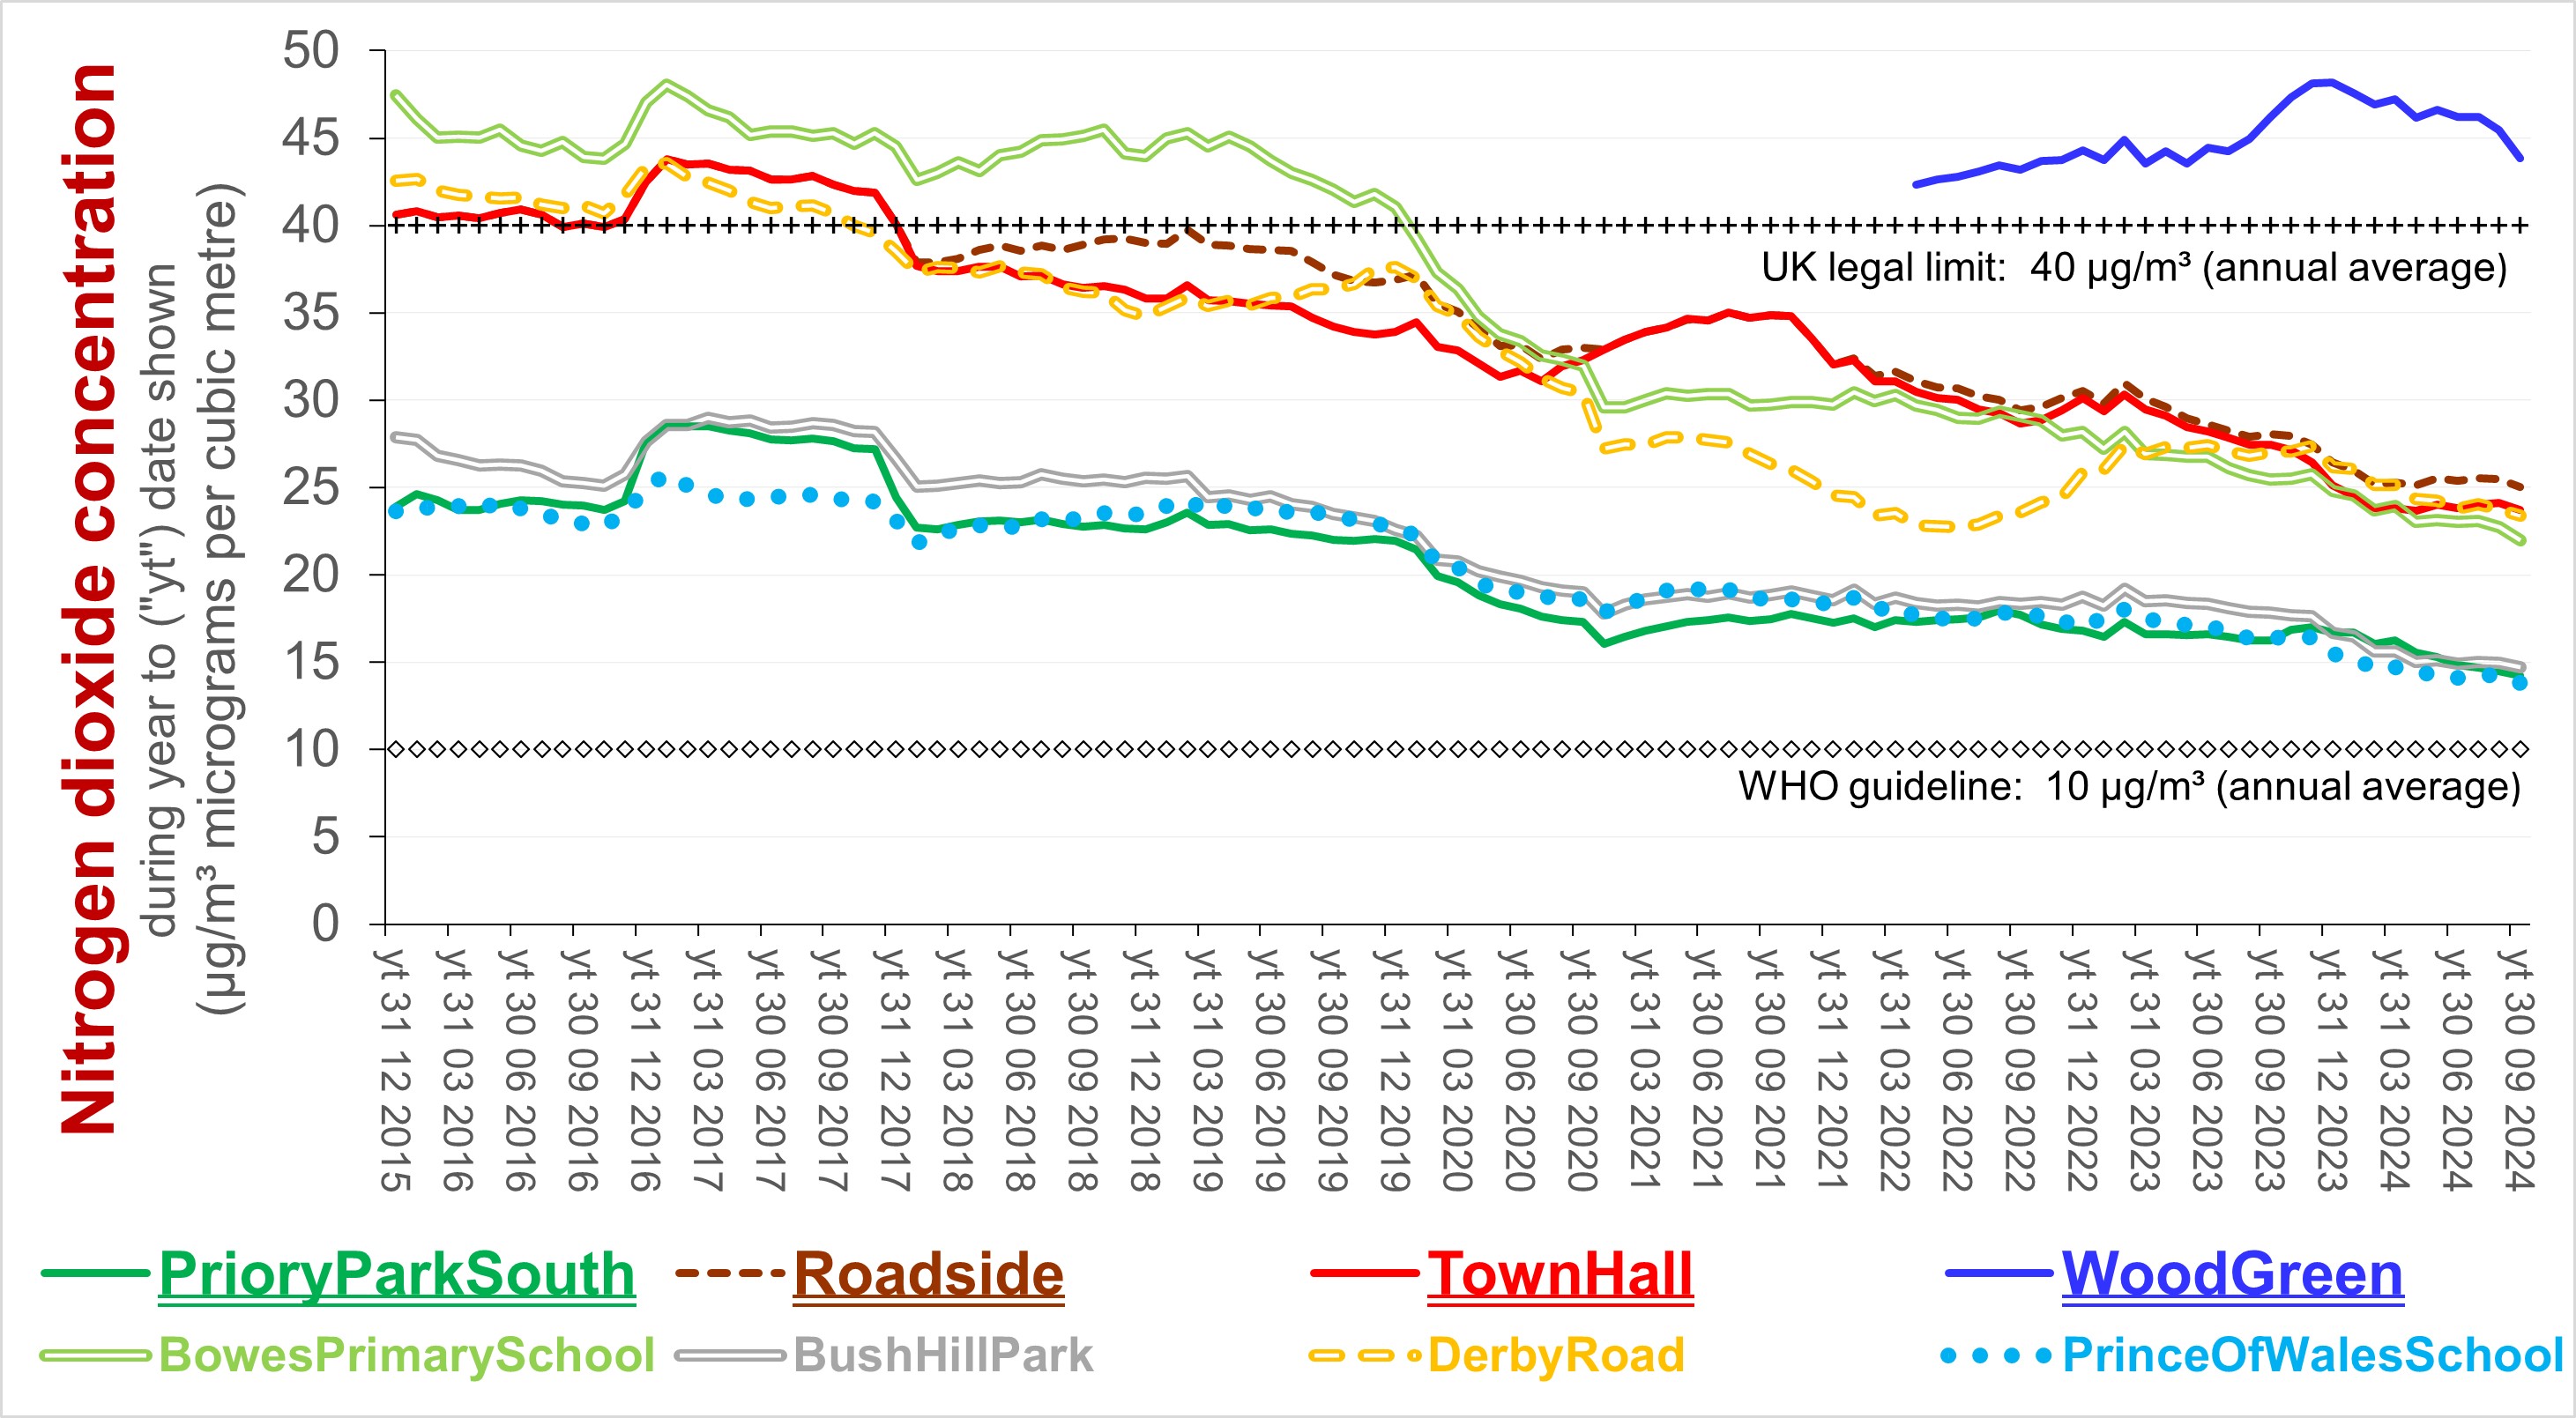
The concentration of nitrogen dioxide ("NO2") varies with the season. The variation tends to be most evident in locations away from busy urban areas, such as at Haringey's Priory Park South site (shown in the chart below).
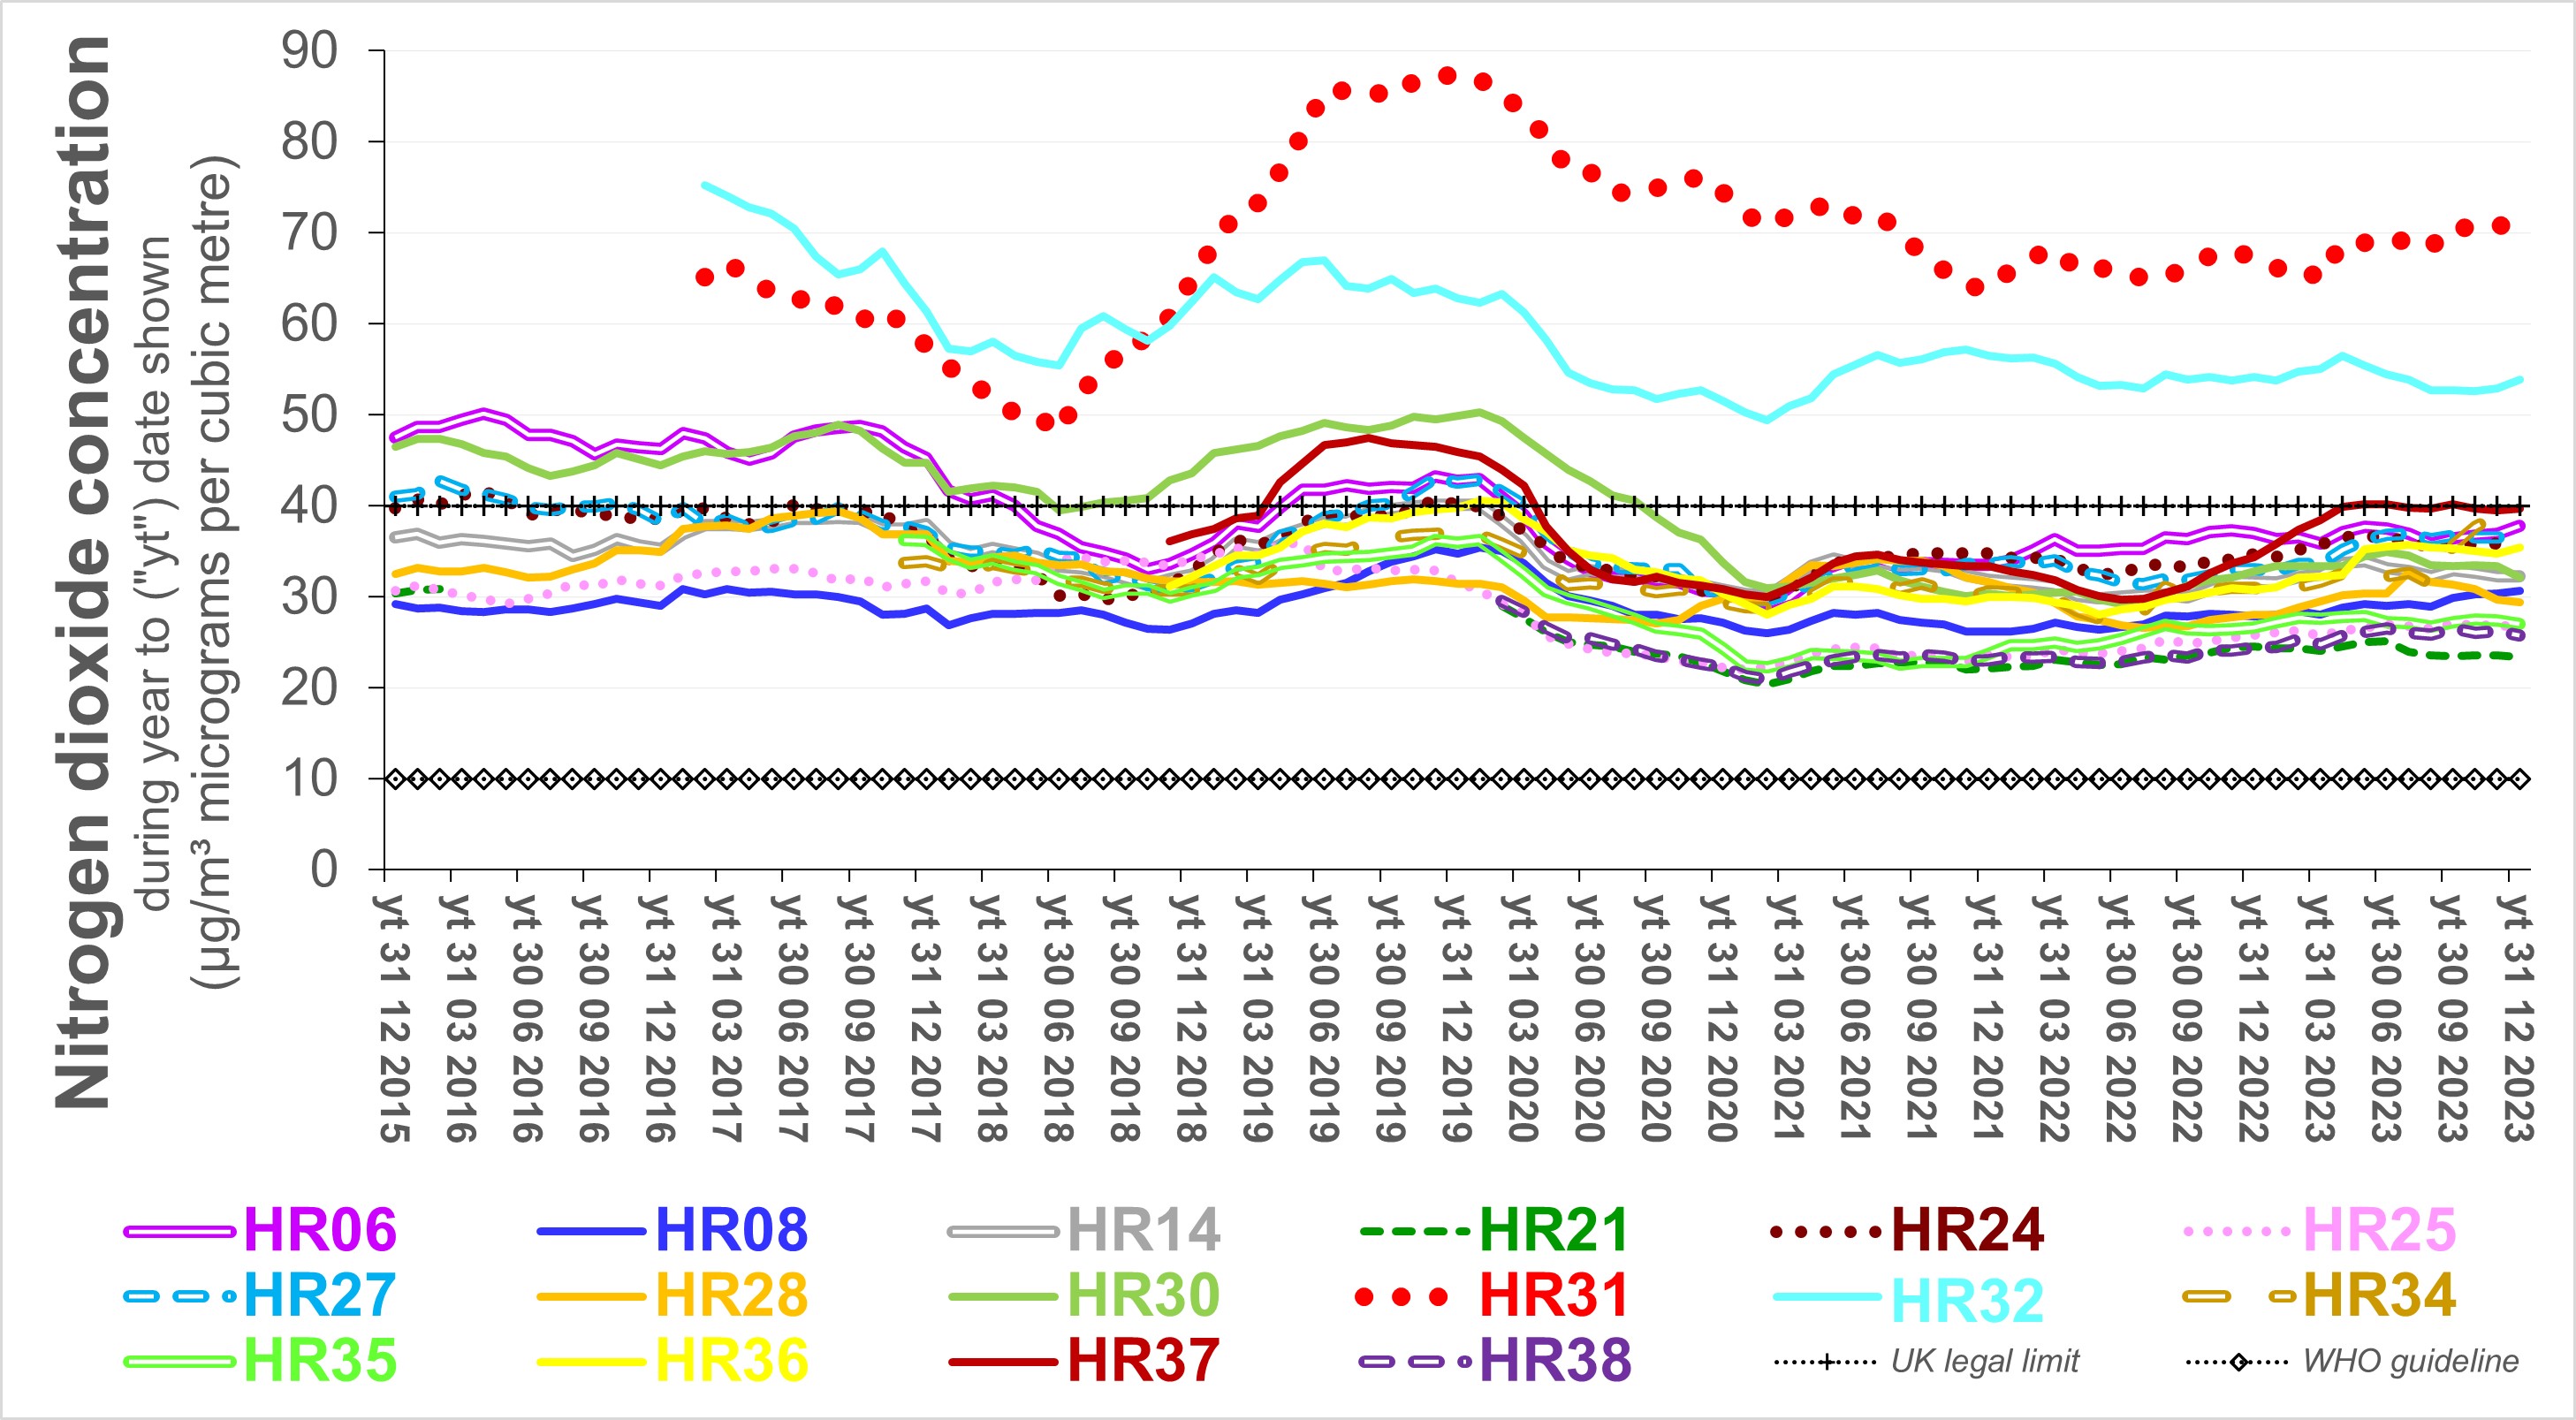
The following chart shows how the annual average concentration of NO2 changed since 2015 at a selection of sites in the Borough of Haringey.
The data above indicate that, since the
first covid-19 lockdown, NO2
concentrations have not rebounded to their pre-covid levels.
The extension of the ULEZ will have contributed to that
improvement. Nevertheless, concentrations are two to three
times greater than the World
Health Organistion guideline. Concentrations at Archway Road
Southwood (site HR32) exceed the UK legal limit by nearly 50%.
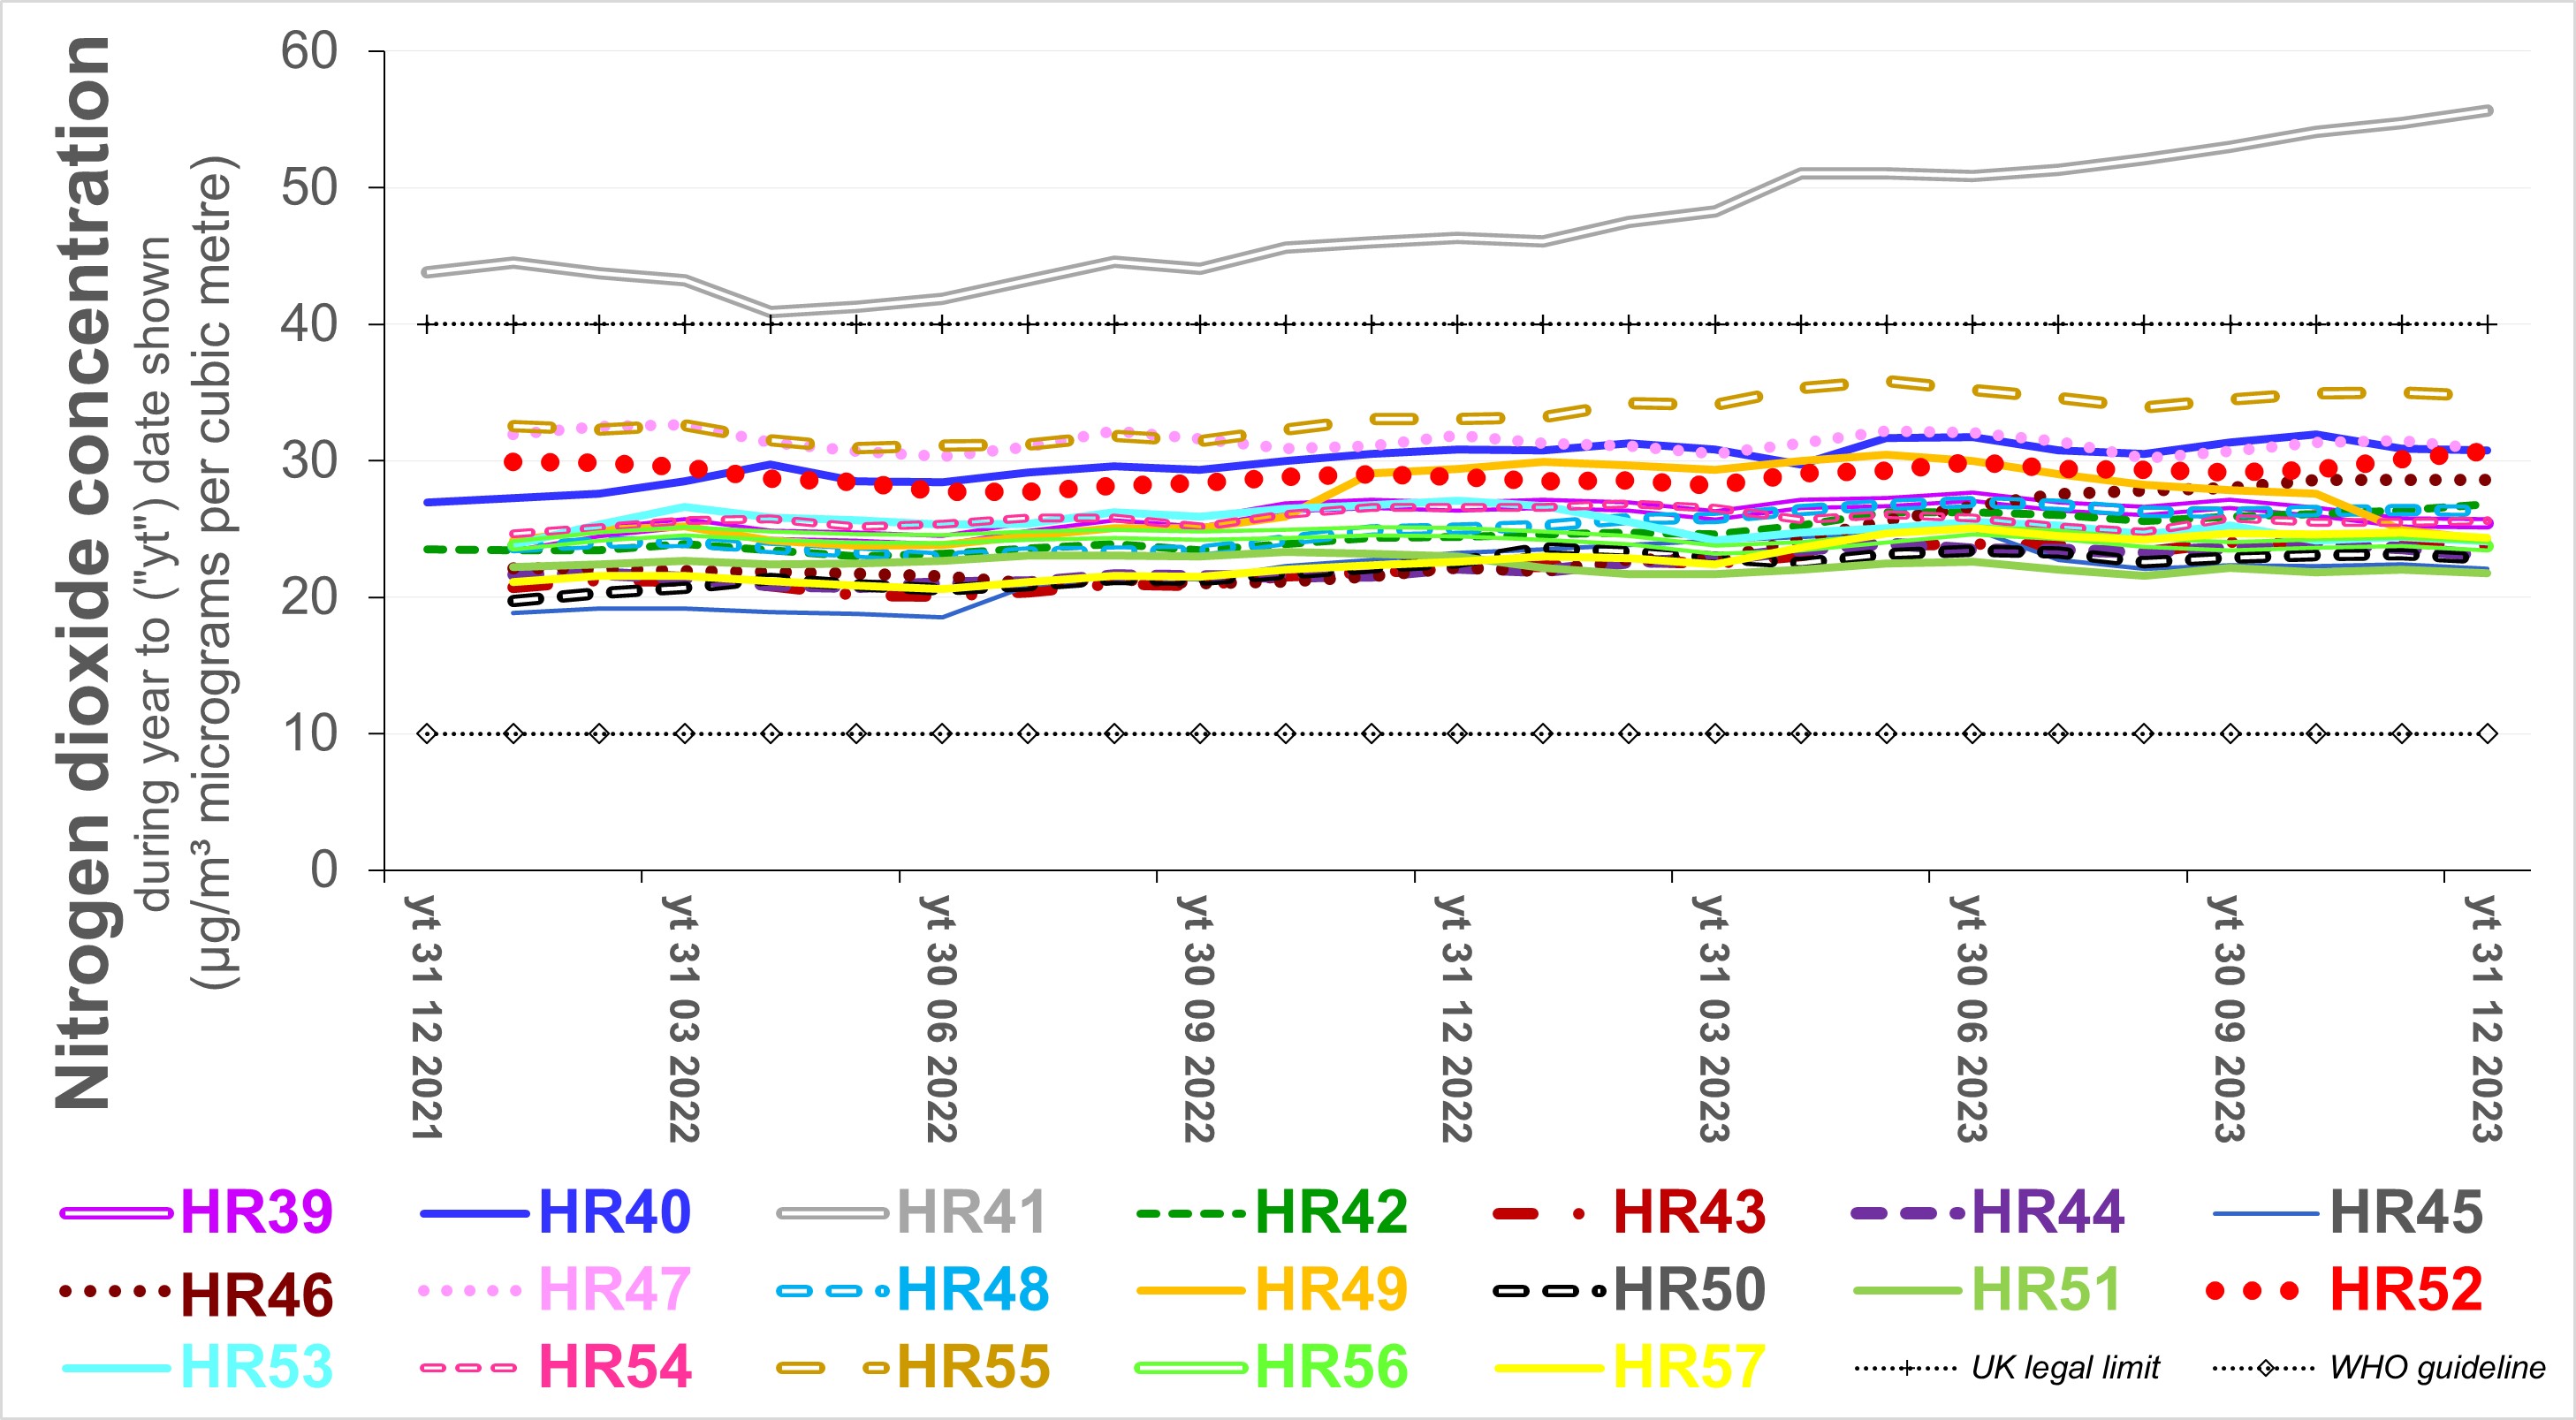
The following chart show trends since 2015 in the concentration
of nitrogent dioxide in Haringey (underlined / upper row of legend) and Enfield as measured automatically at government reference sites.
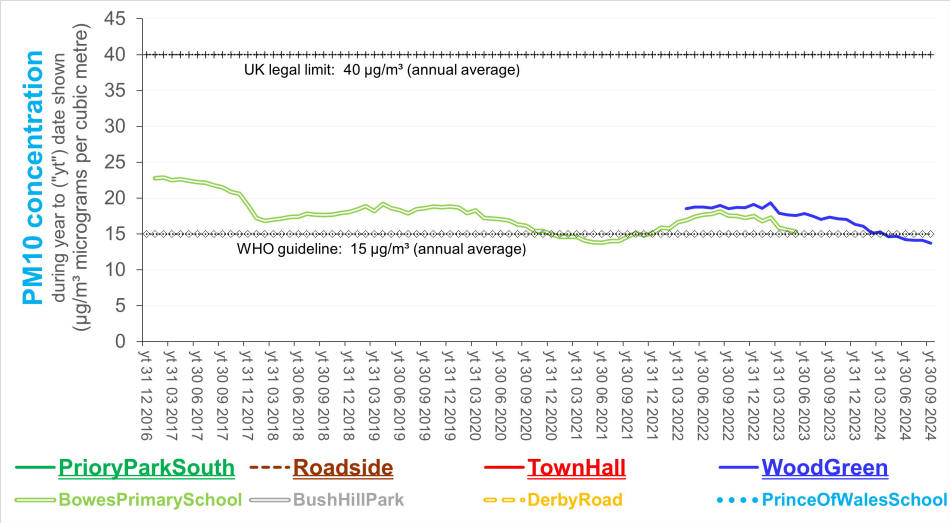
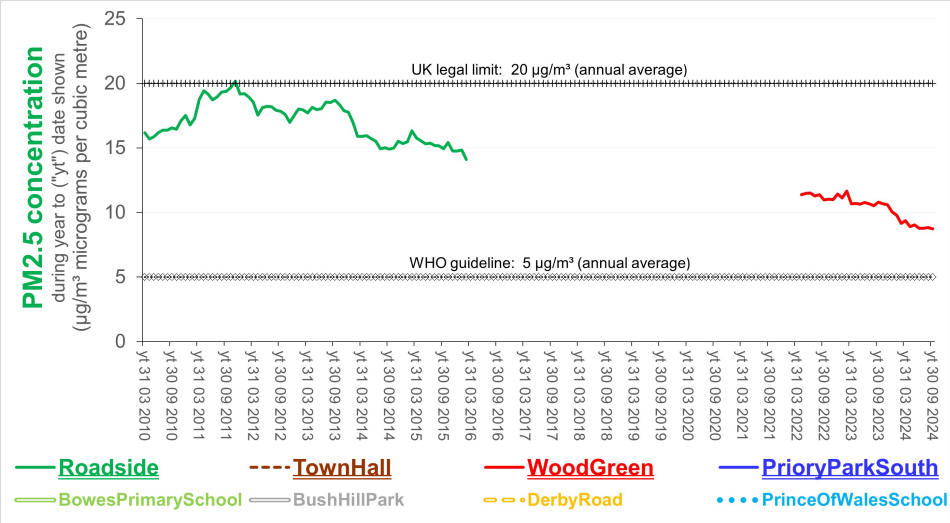
The subsequent two charts do the same for PM10 and PM2.5 at the
only sites which measured those pollutants during the periods
shown.
|
|
For further information, please contact: info@airqualitymatters.uk |
| Back |