|
AIR QUALITY MATTERS |
|
Borough of Hammersmith and Fulham |
|
"More
monitoring but little improvement. How much longer before action?"
|
|
The London Borough of Hammersmith and Fulham prides itself on having the densist network of air quality monitors in Europe (in the south of the borough, using Vortex sensors). However, the Council only publishes what it is obliged to - and then once a year with a long time lag (typically between six and 18 months).
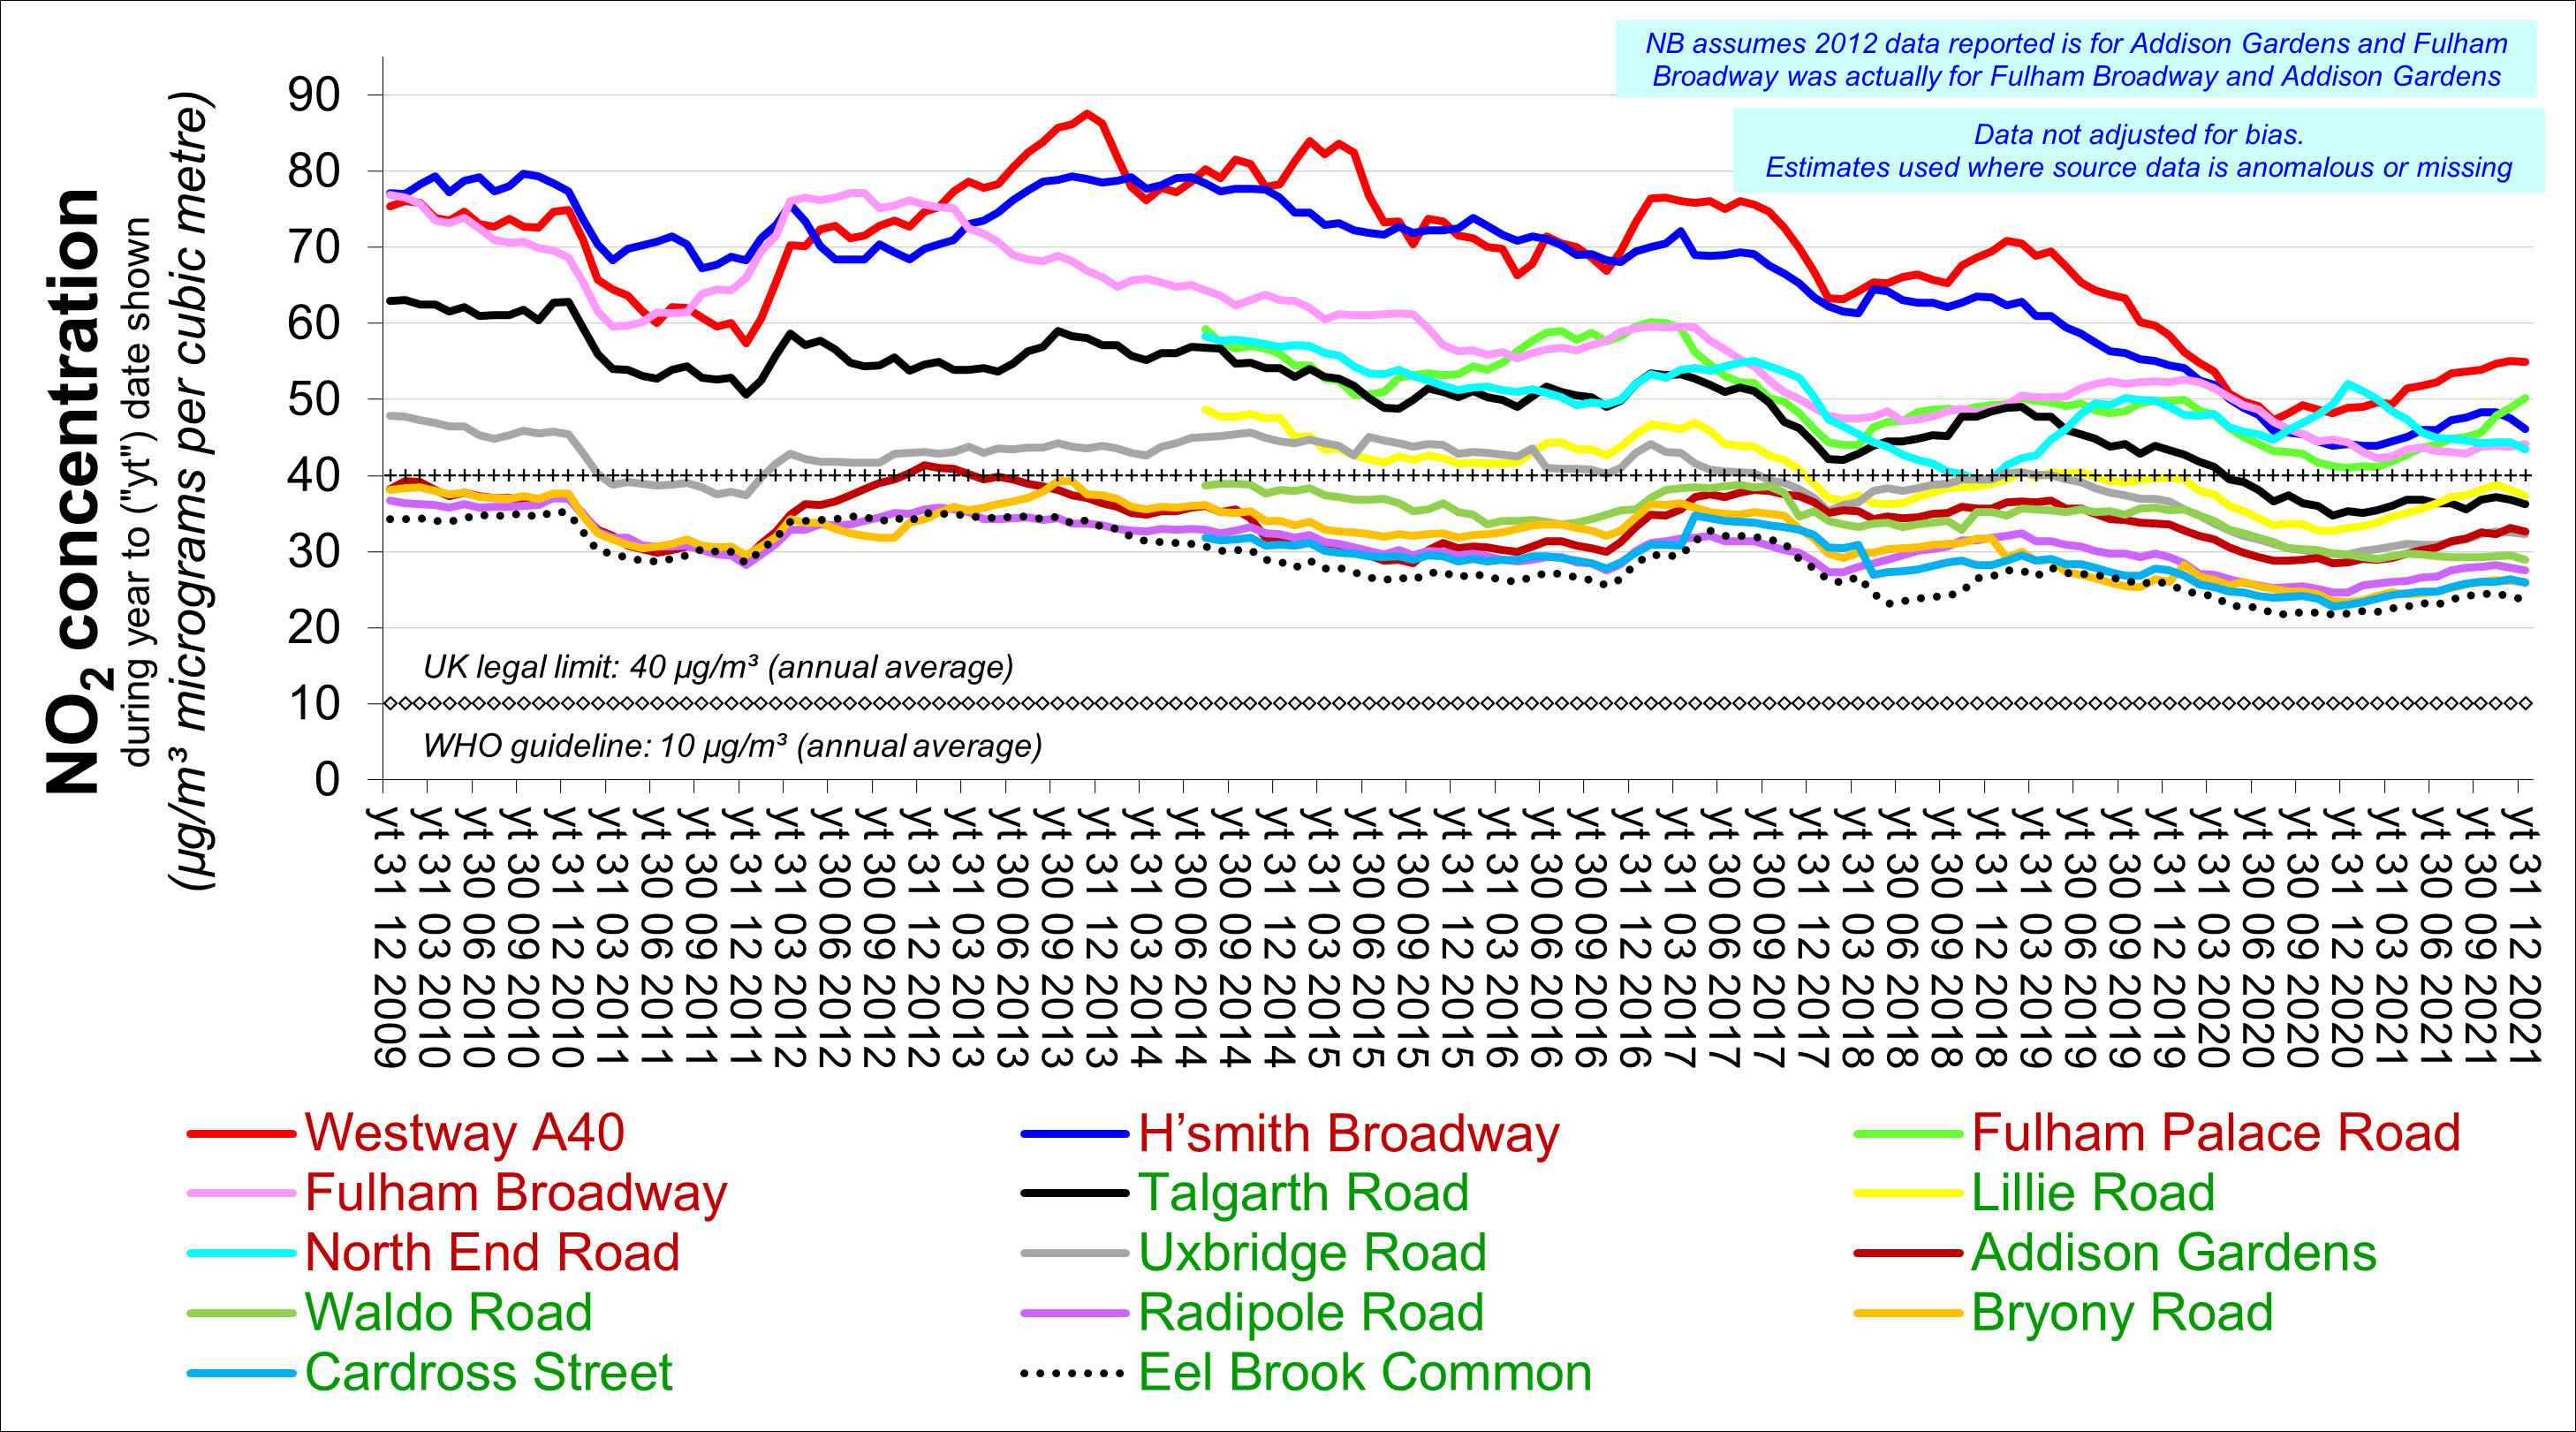
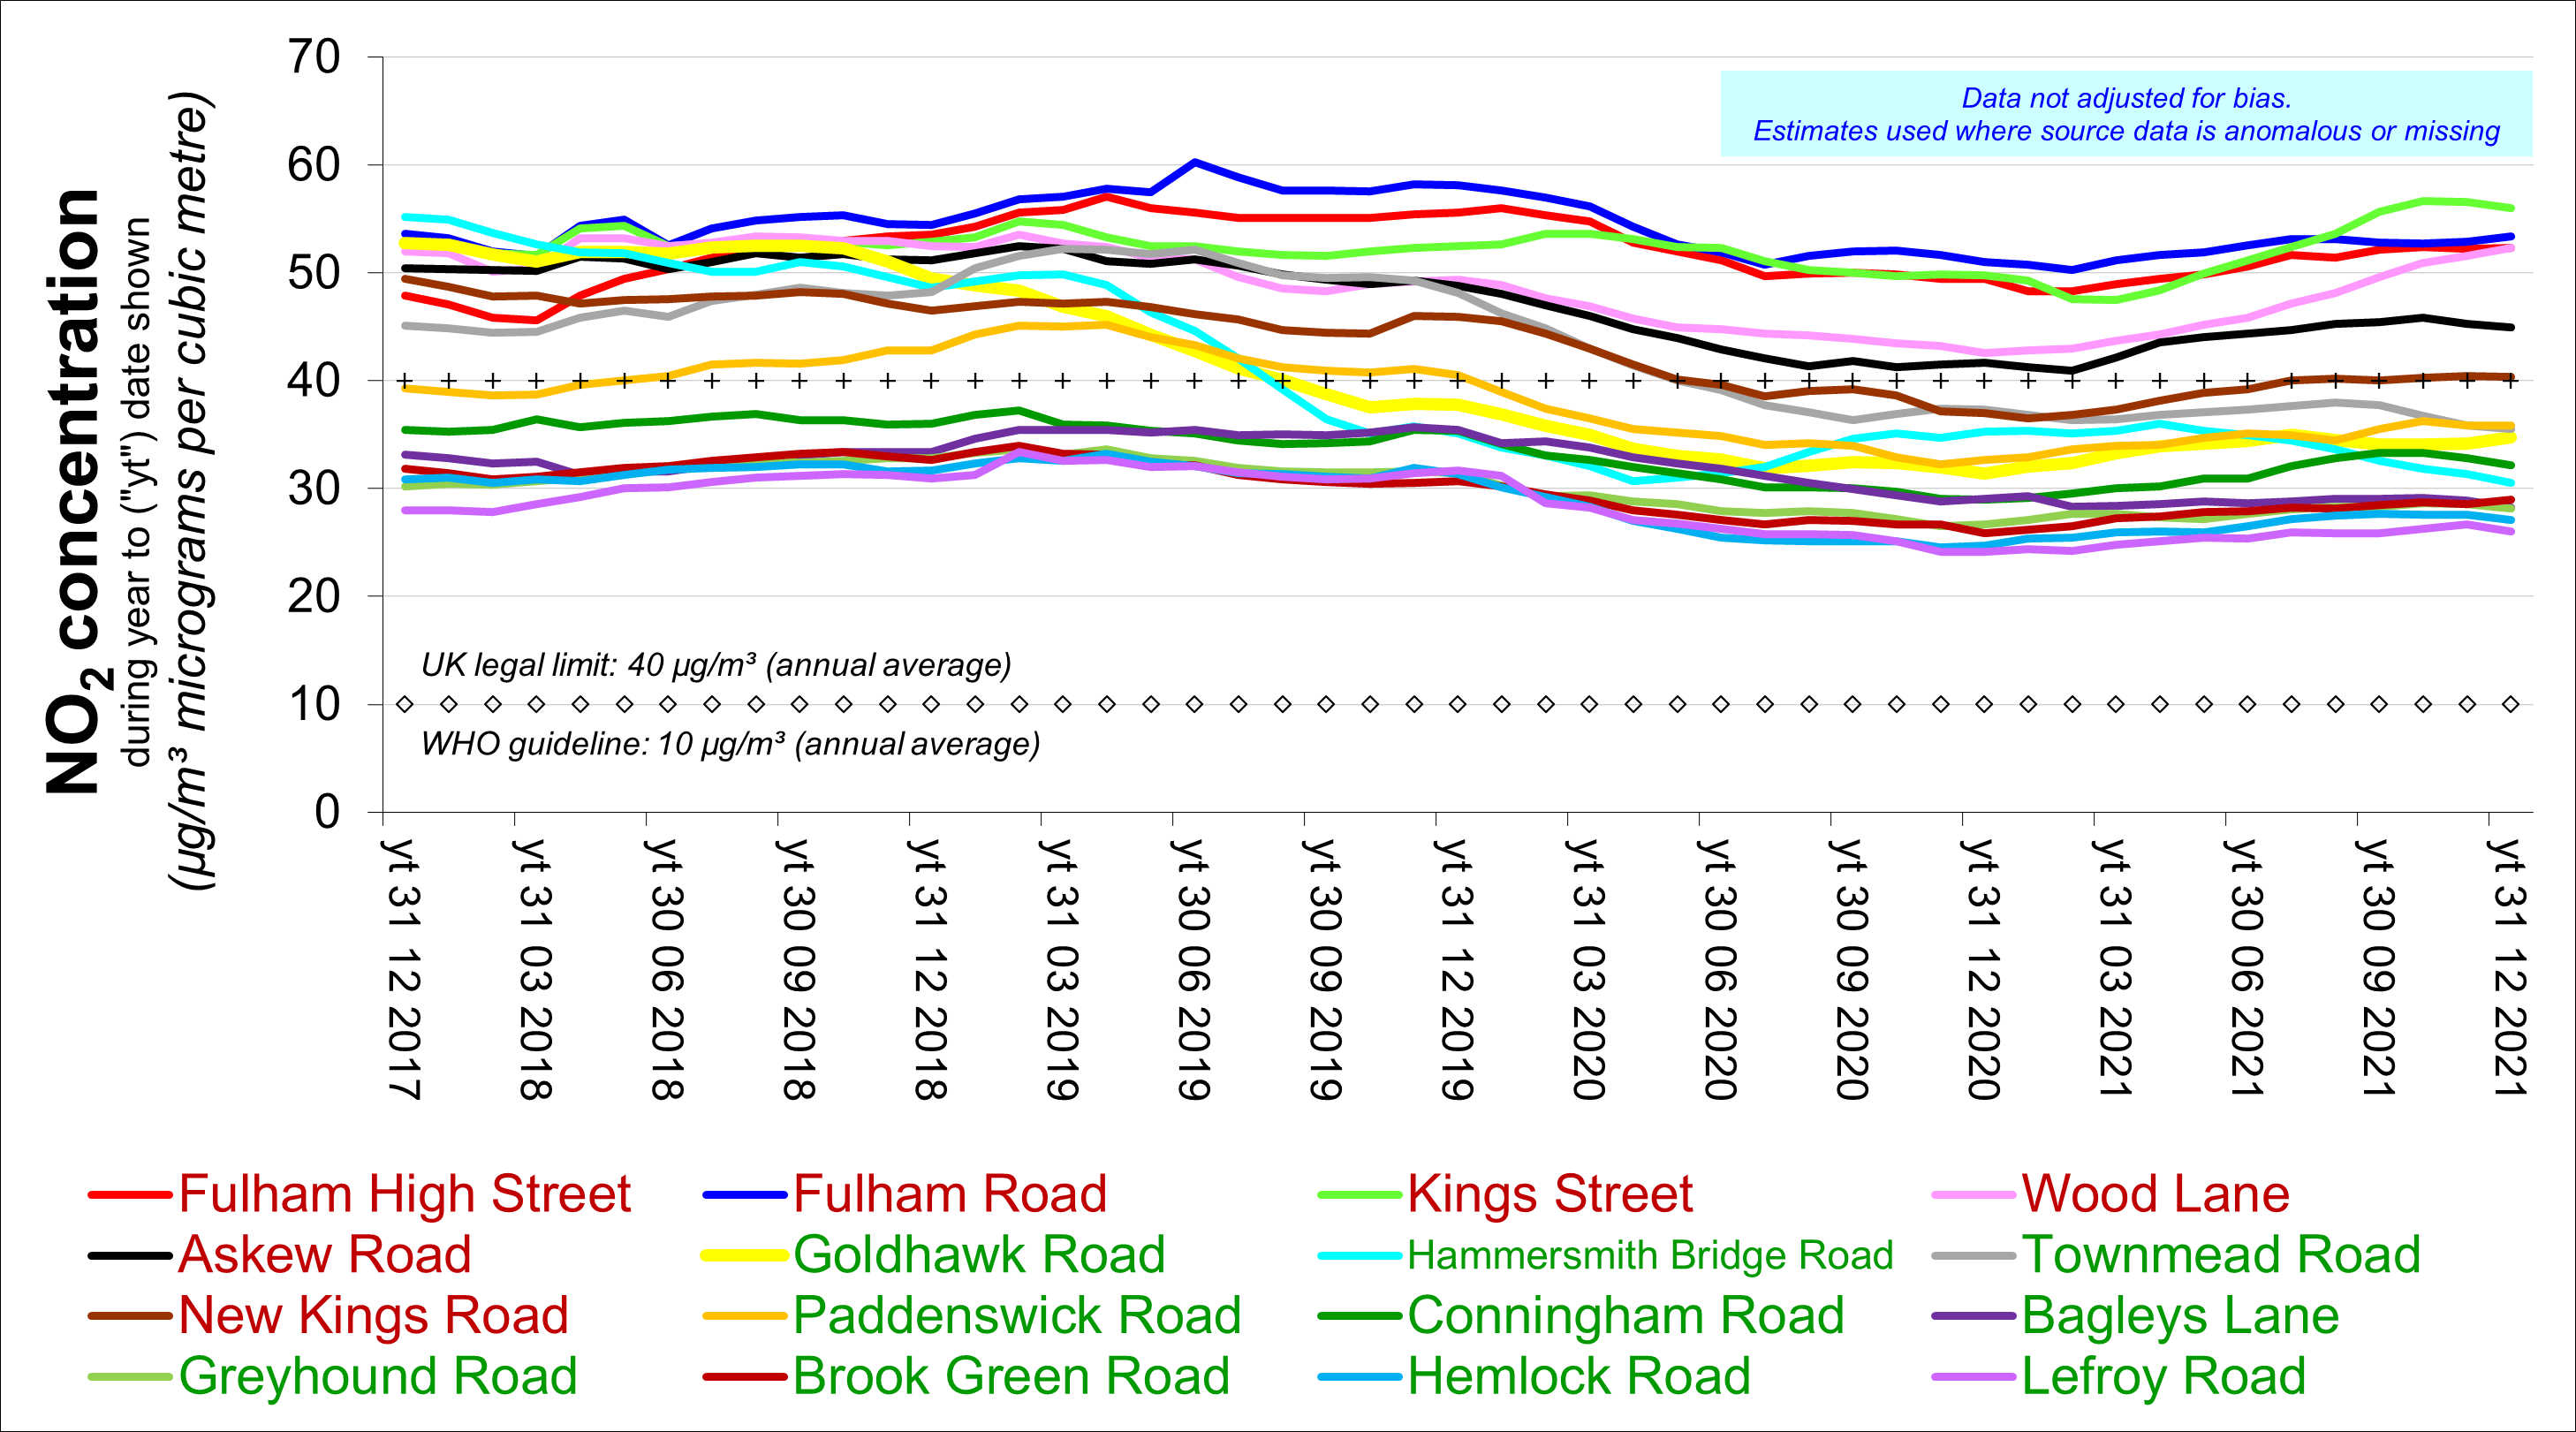
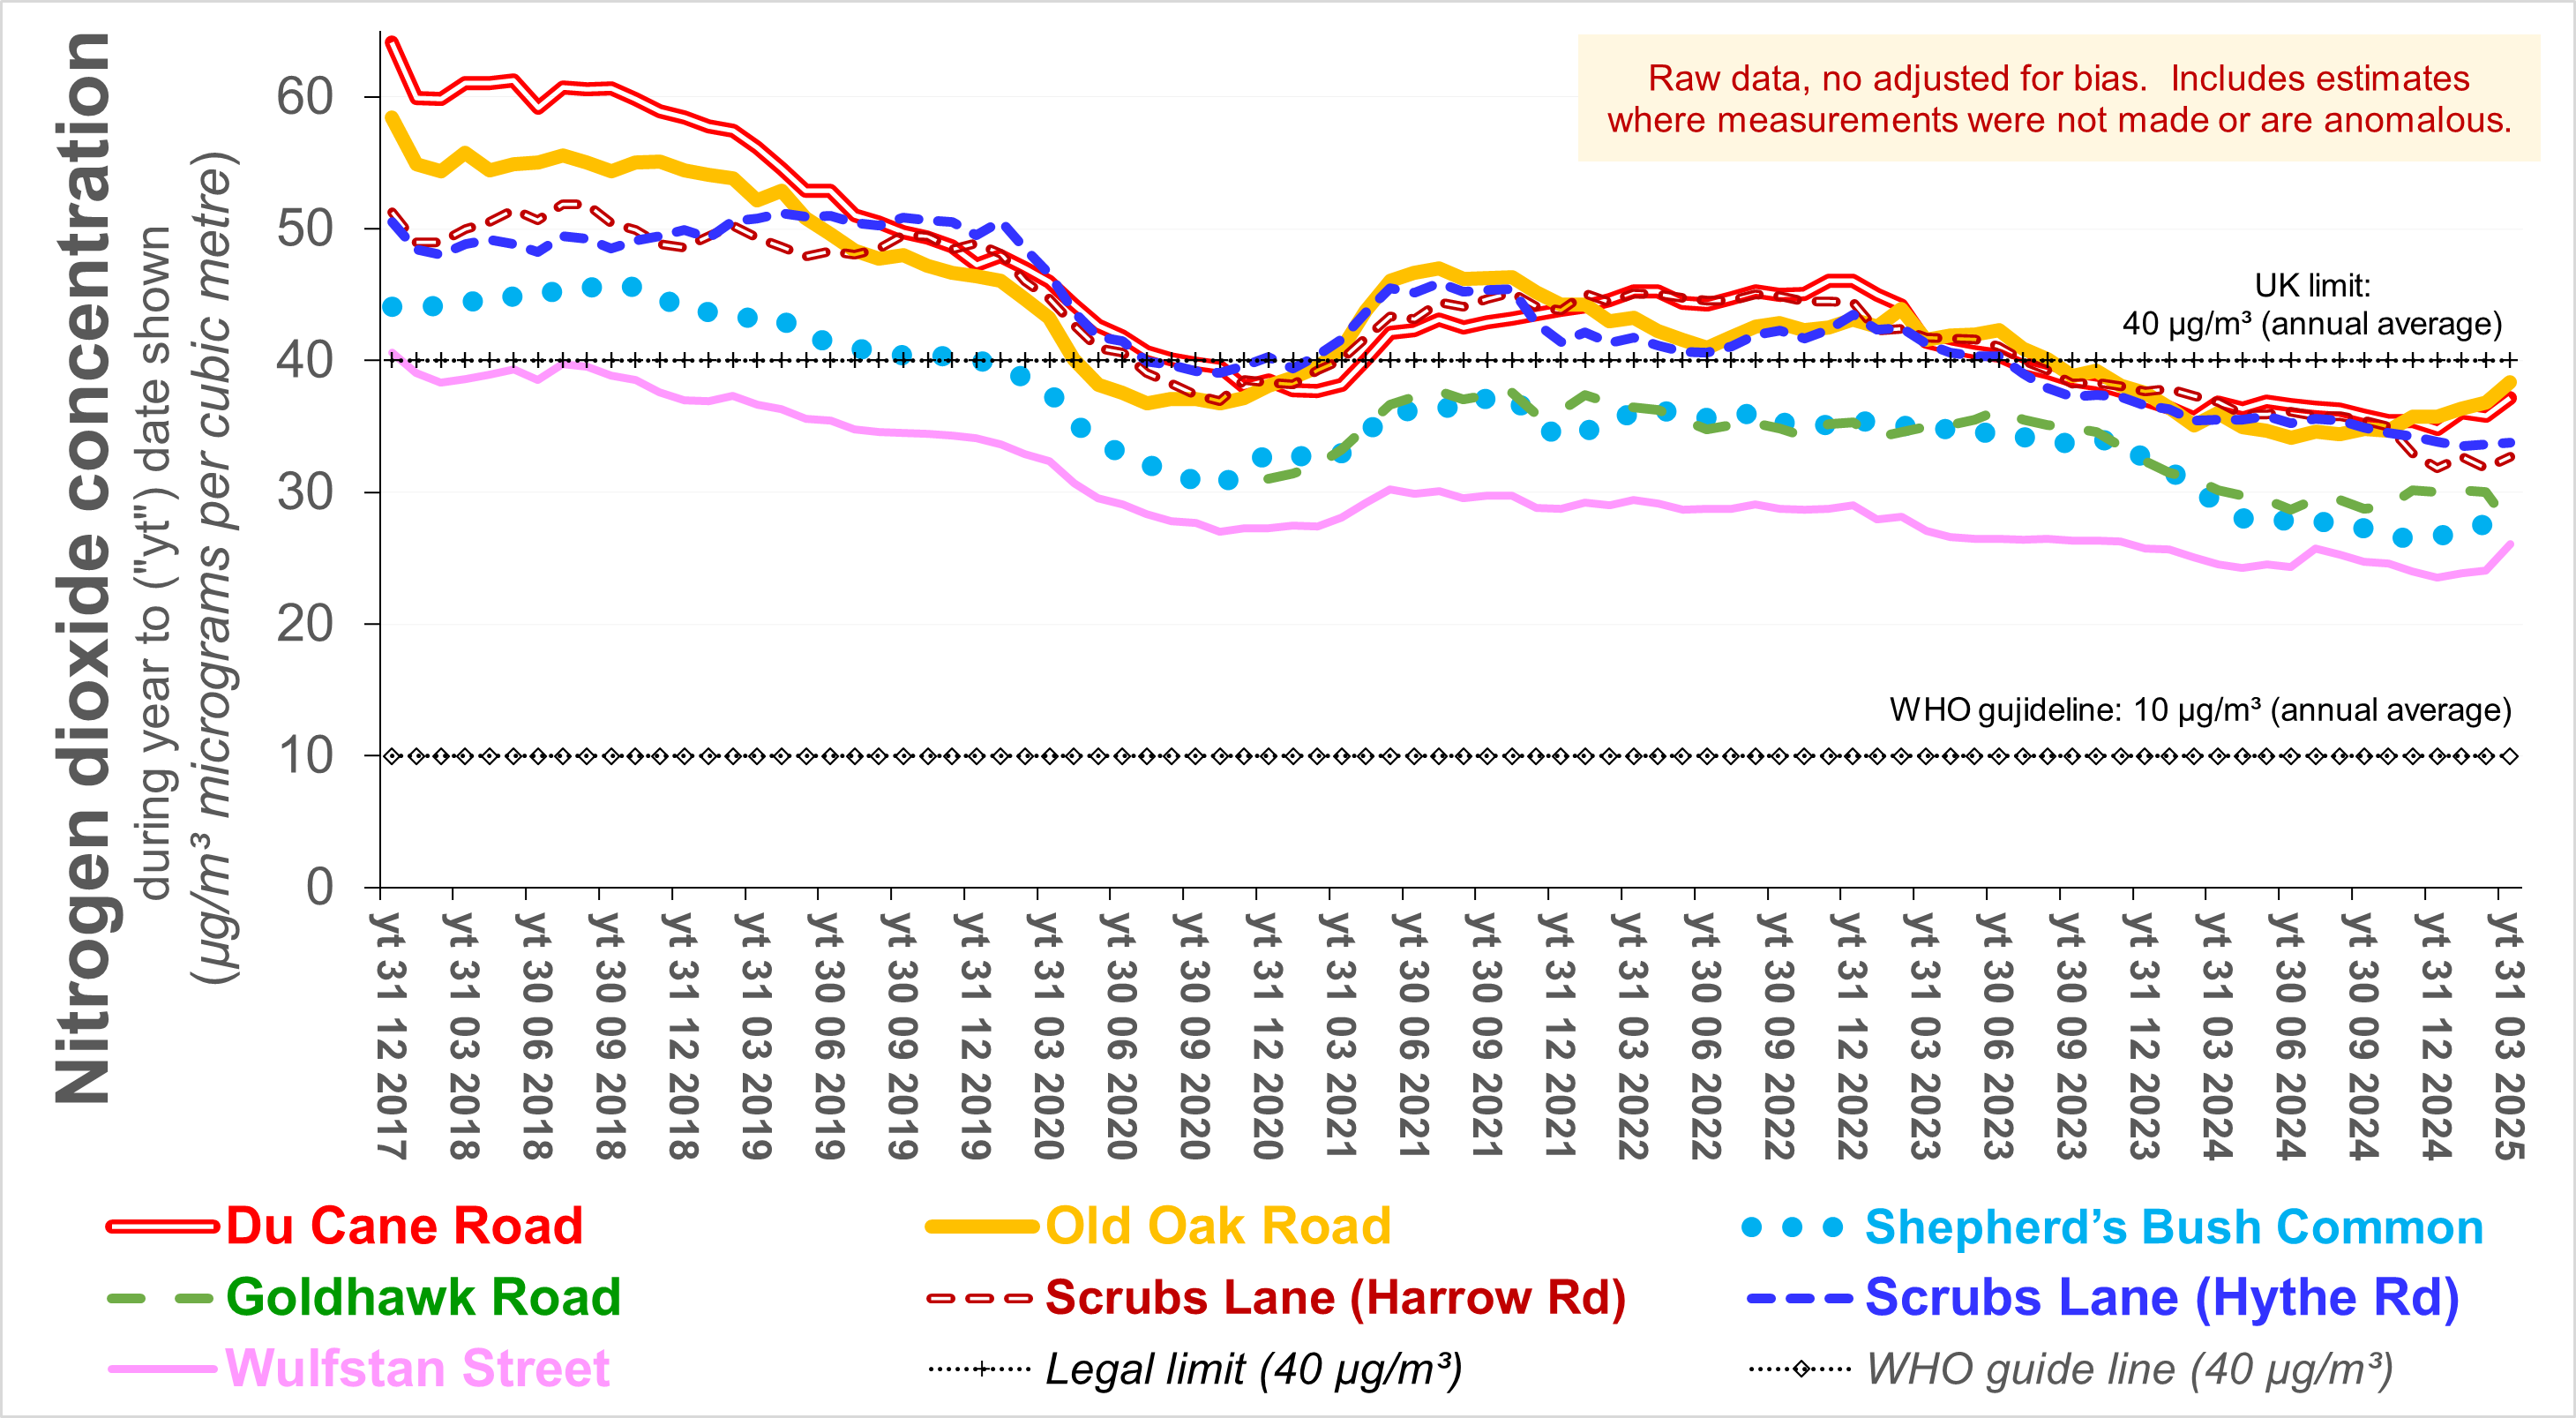
The following pair of charts derives from that published data and
refers to the average concentration of nitrogen dixoide (NO2) which is
measured using diffusion tubes for each month. Sites whose names
are presented in green font now have concentrations below the
current legal limit, concentrations at those in brown are illegal.
The number of sites monitored has increased. The lowest
concentrations exceed the World Health Organisation guideline by
250%. Concentrations have tended to decrease since 2013,
particularly in 2019 (with the introduction of the first phase
ULEZ) and in 2020 (due to covid-19 lockdowns).
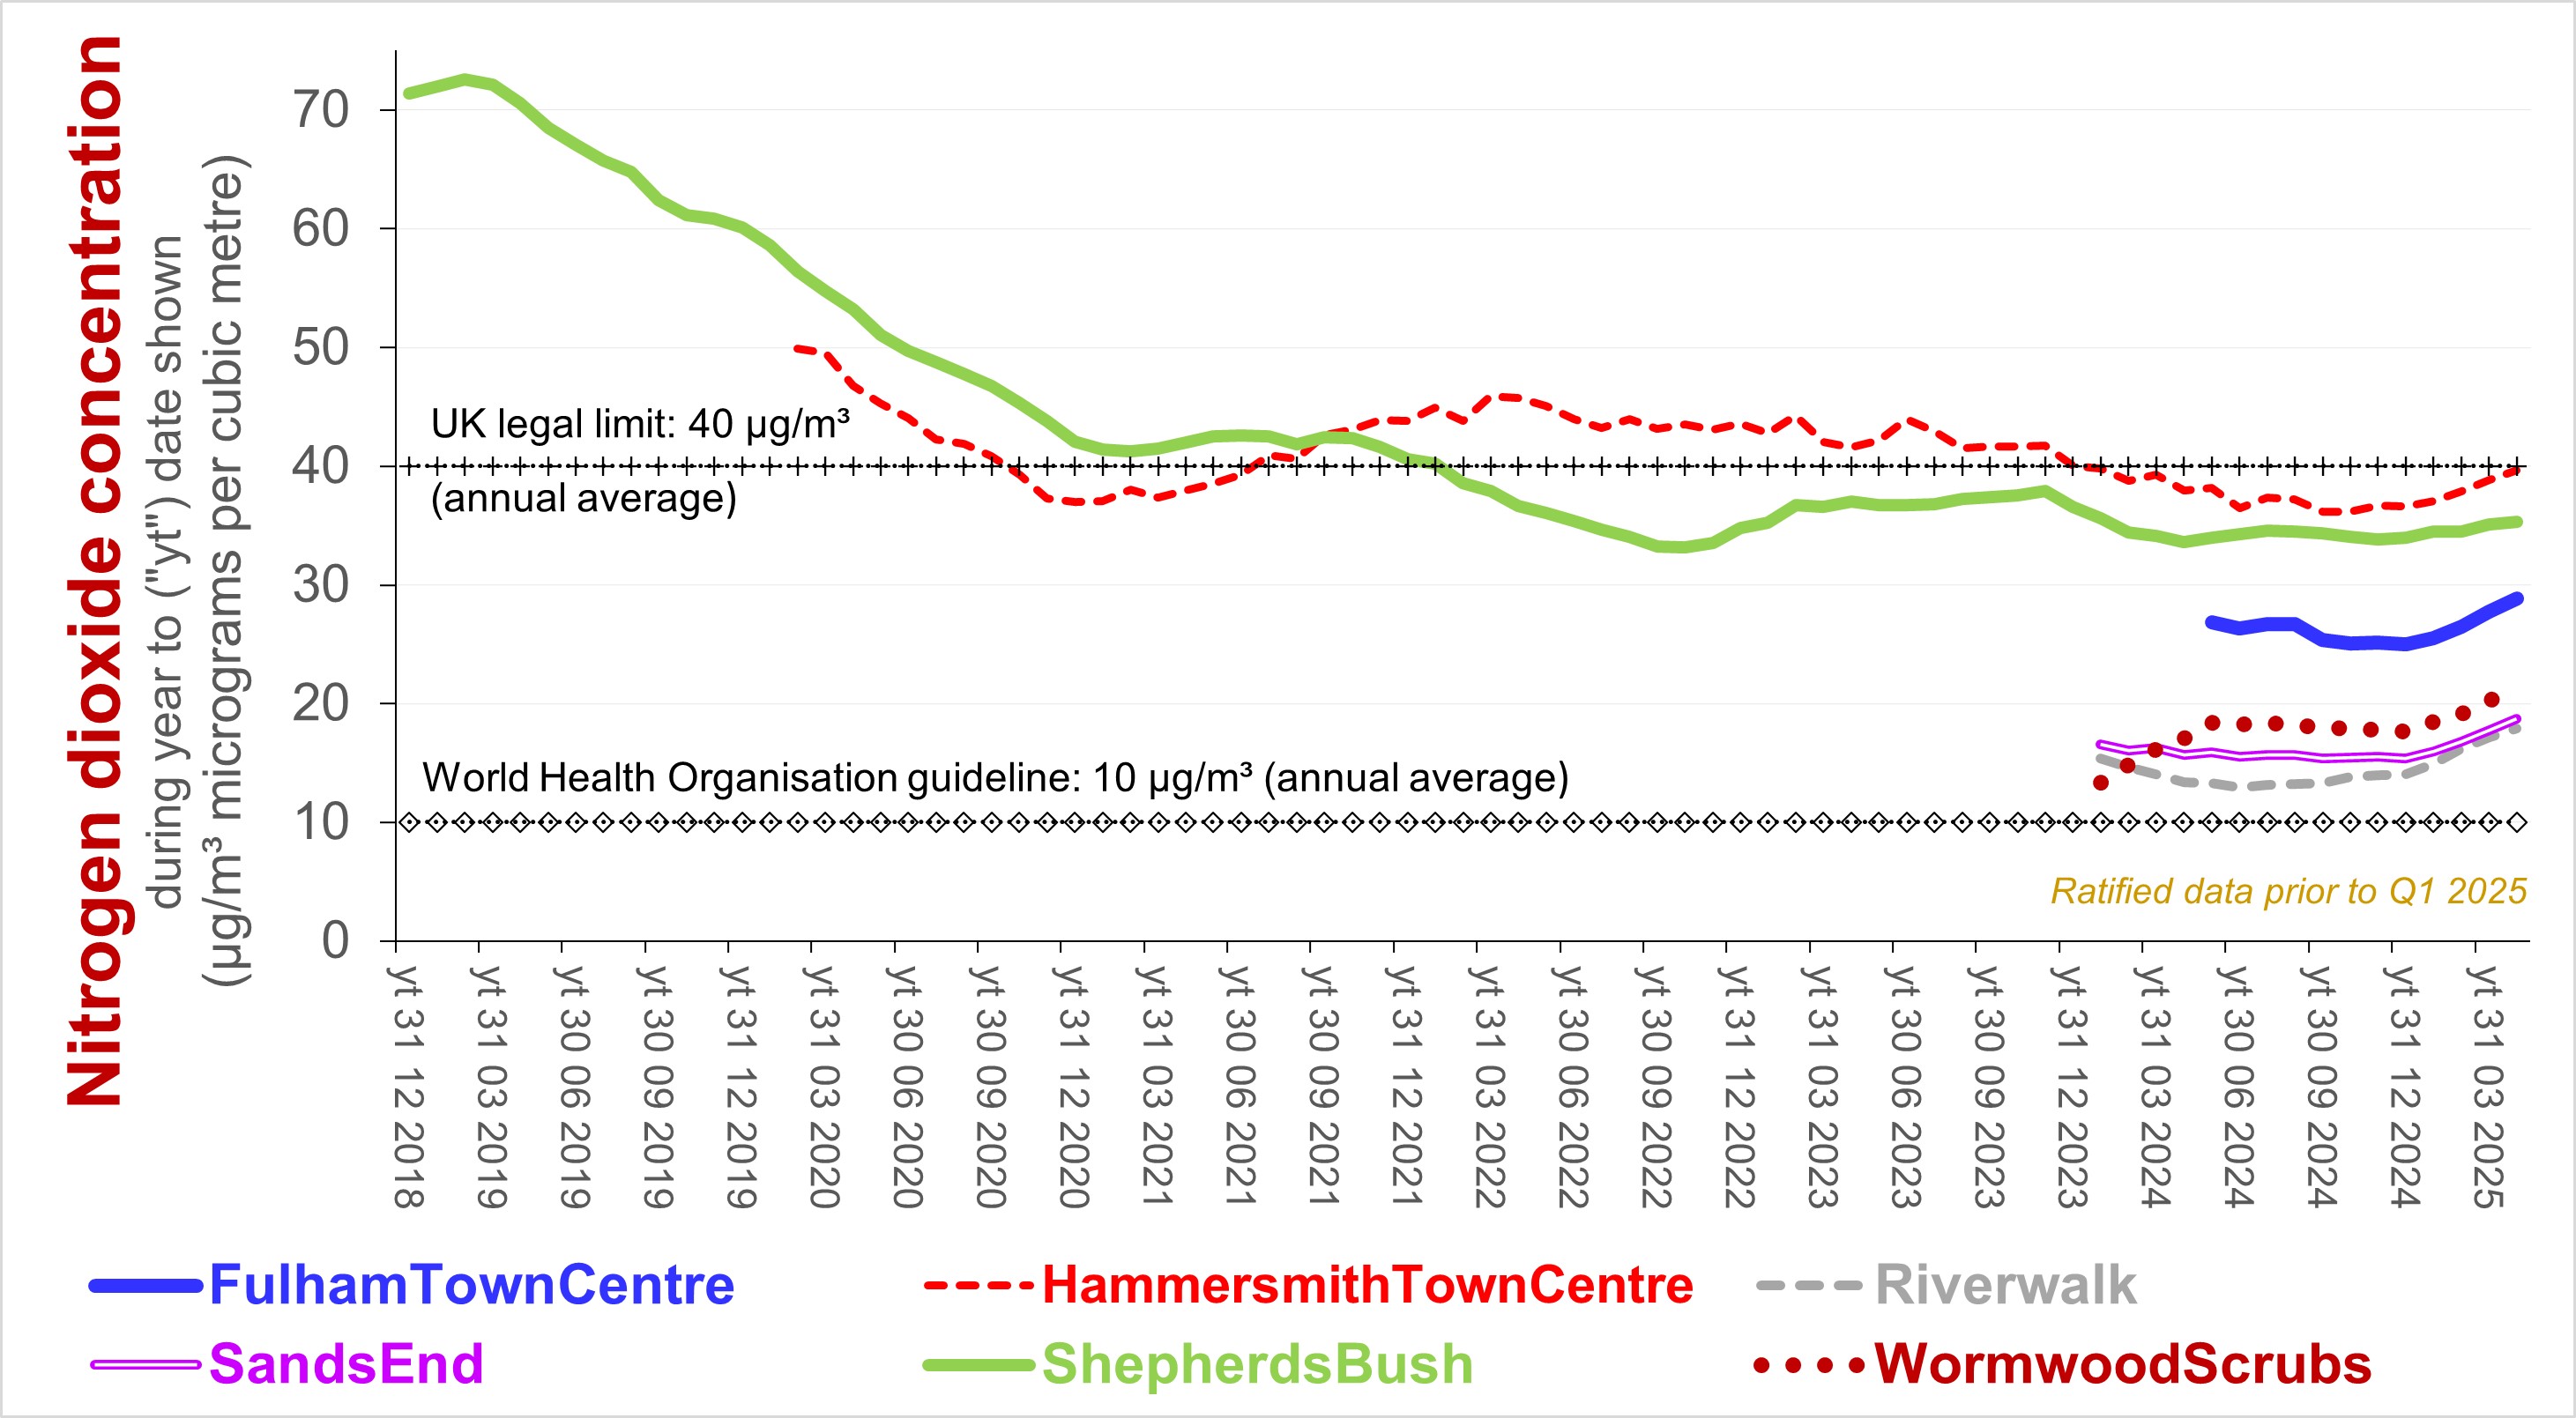
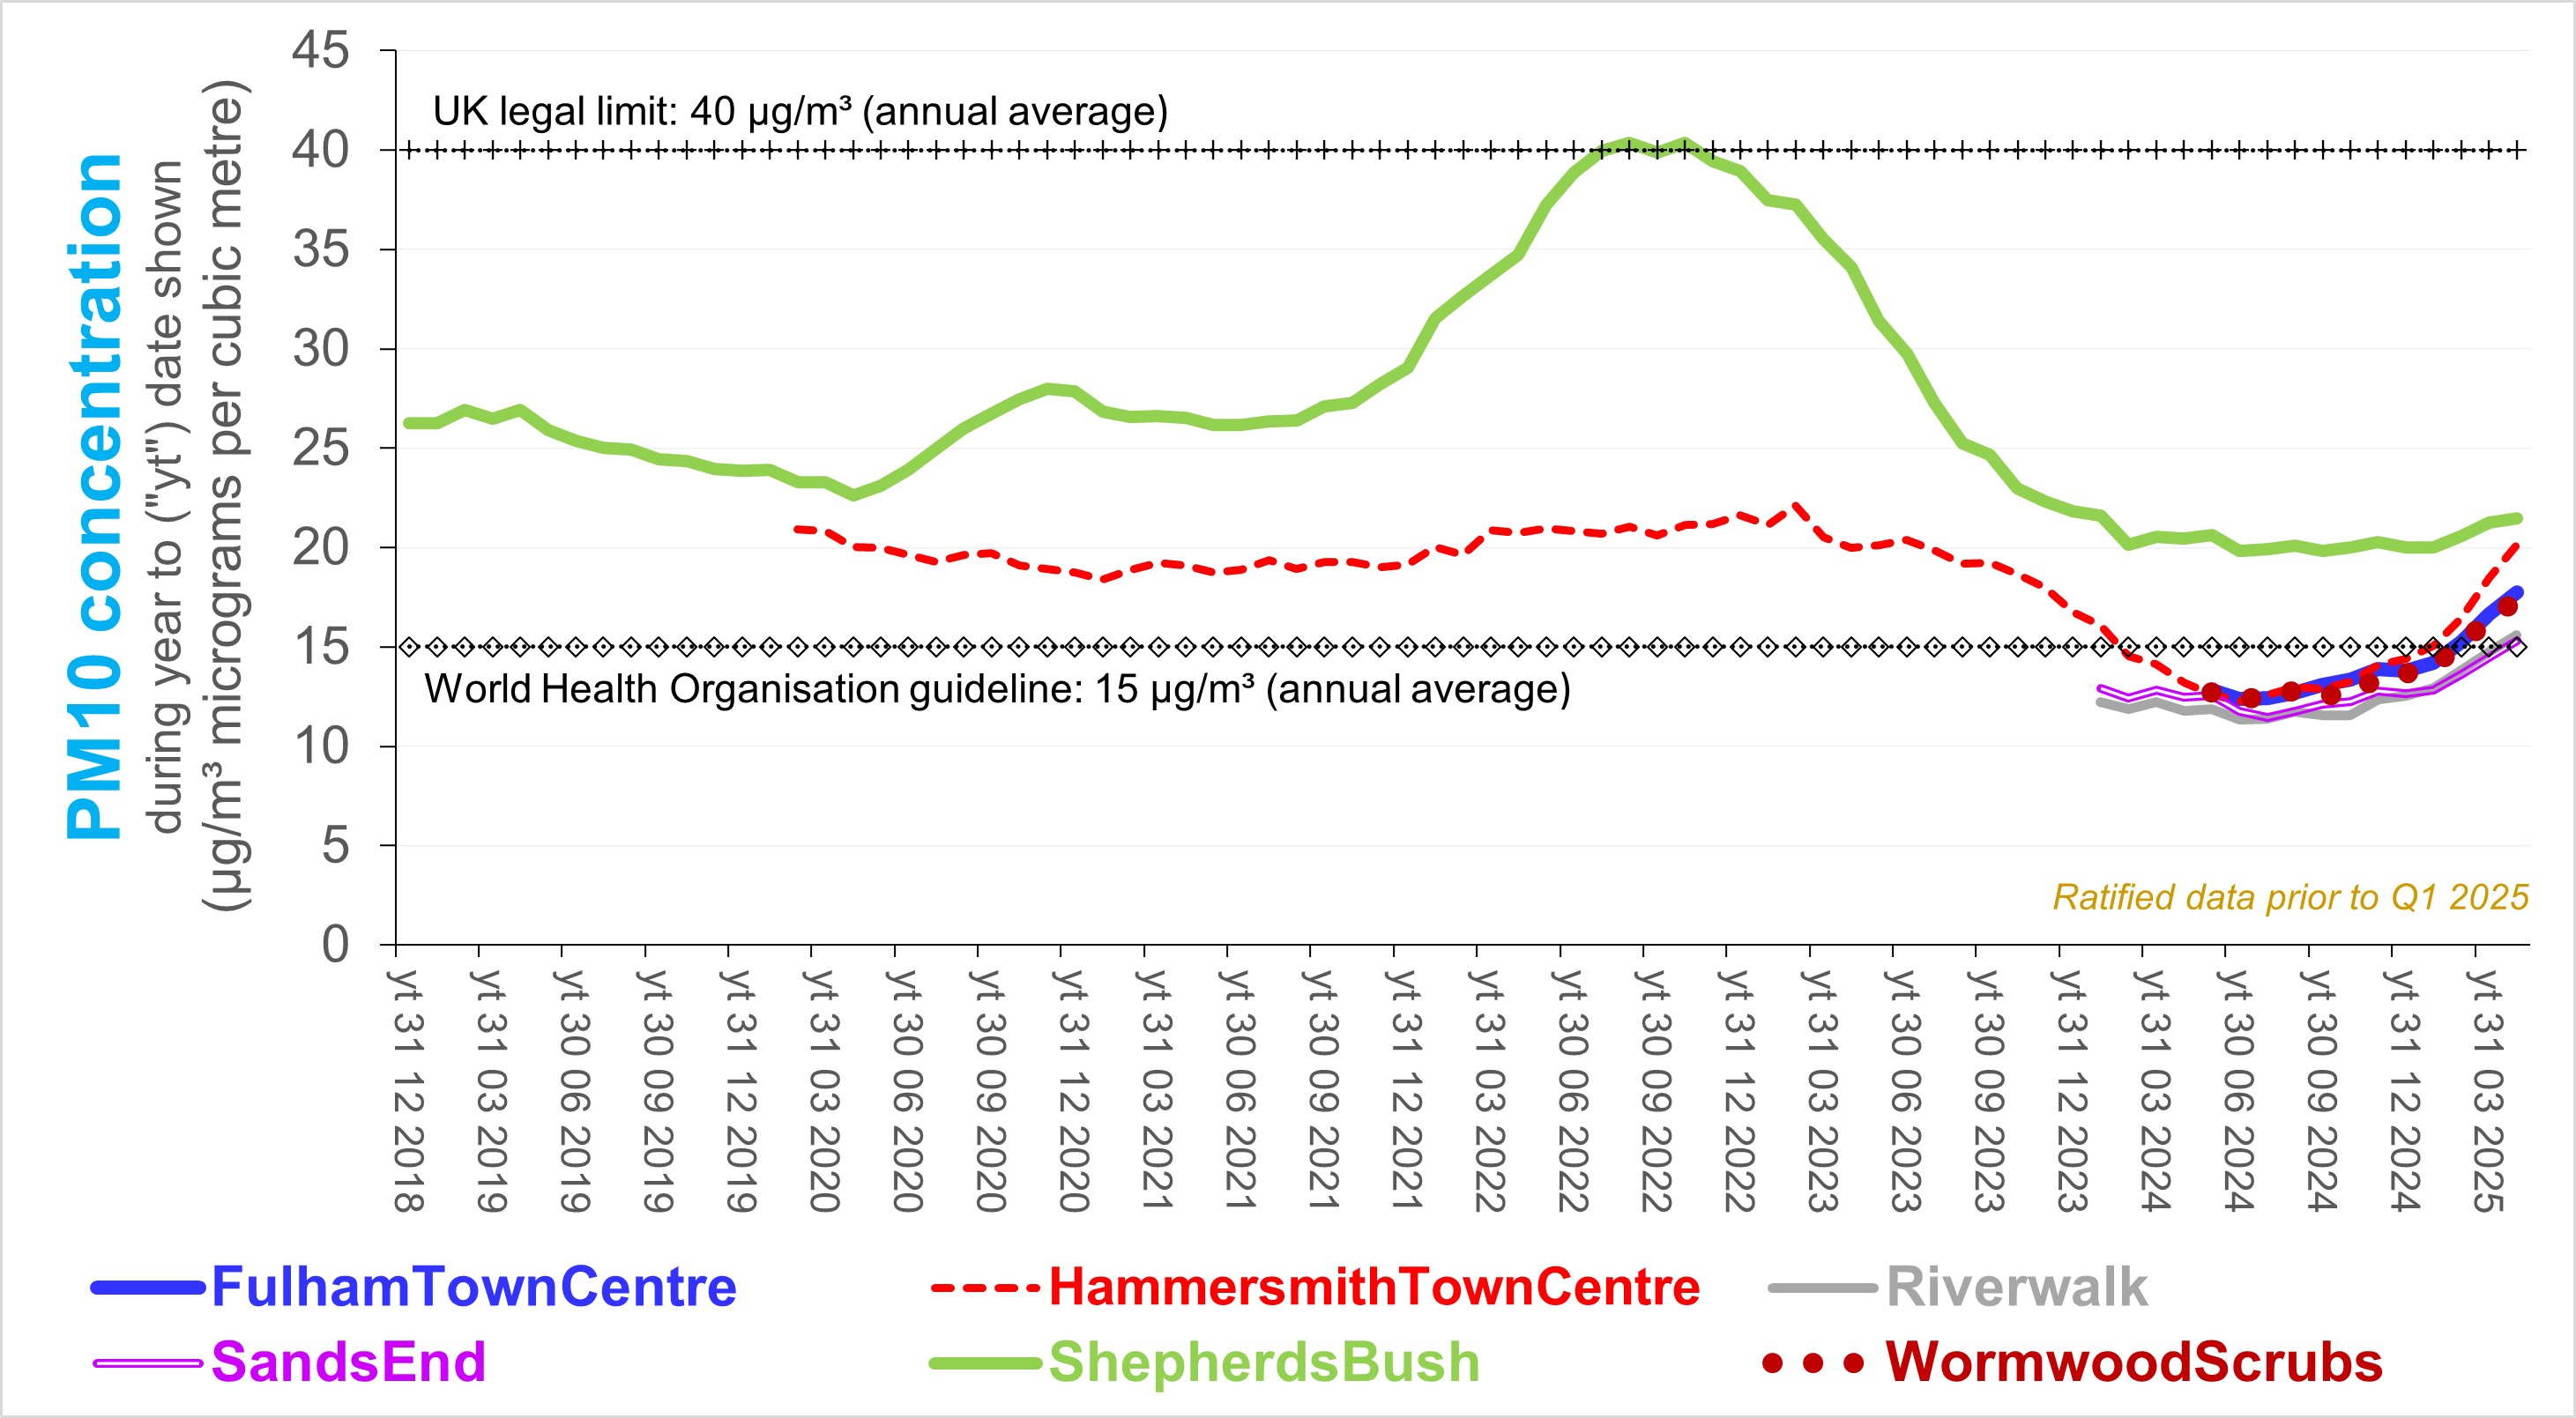
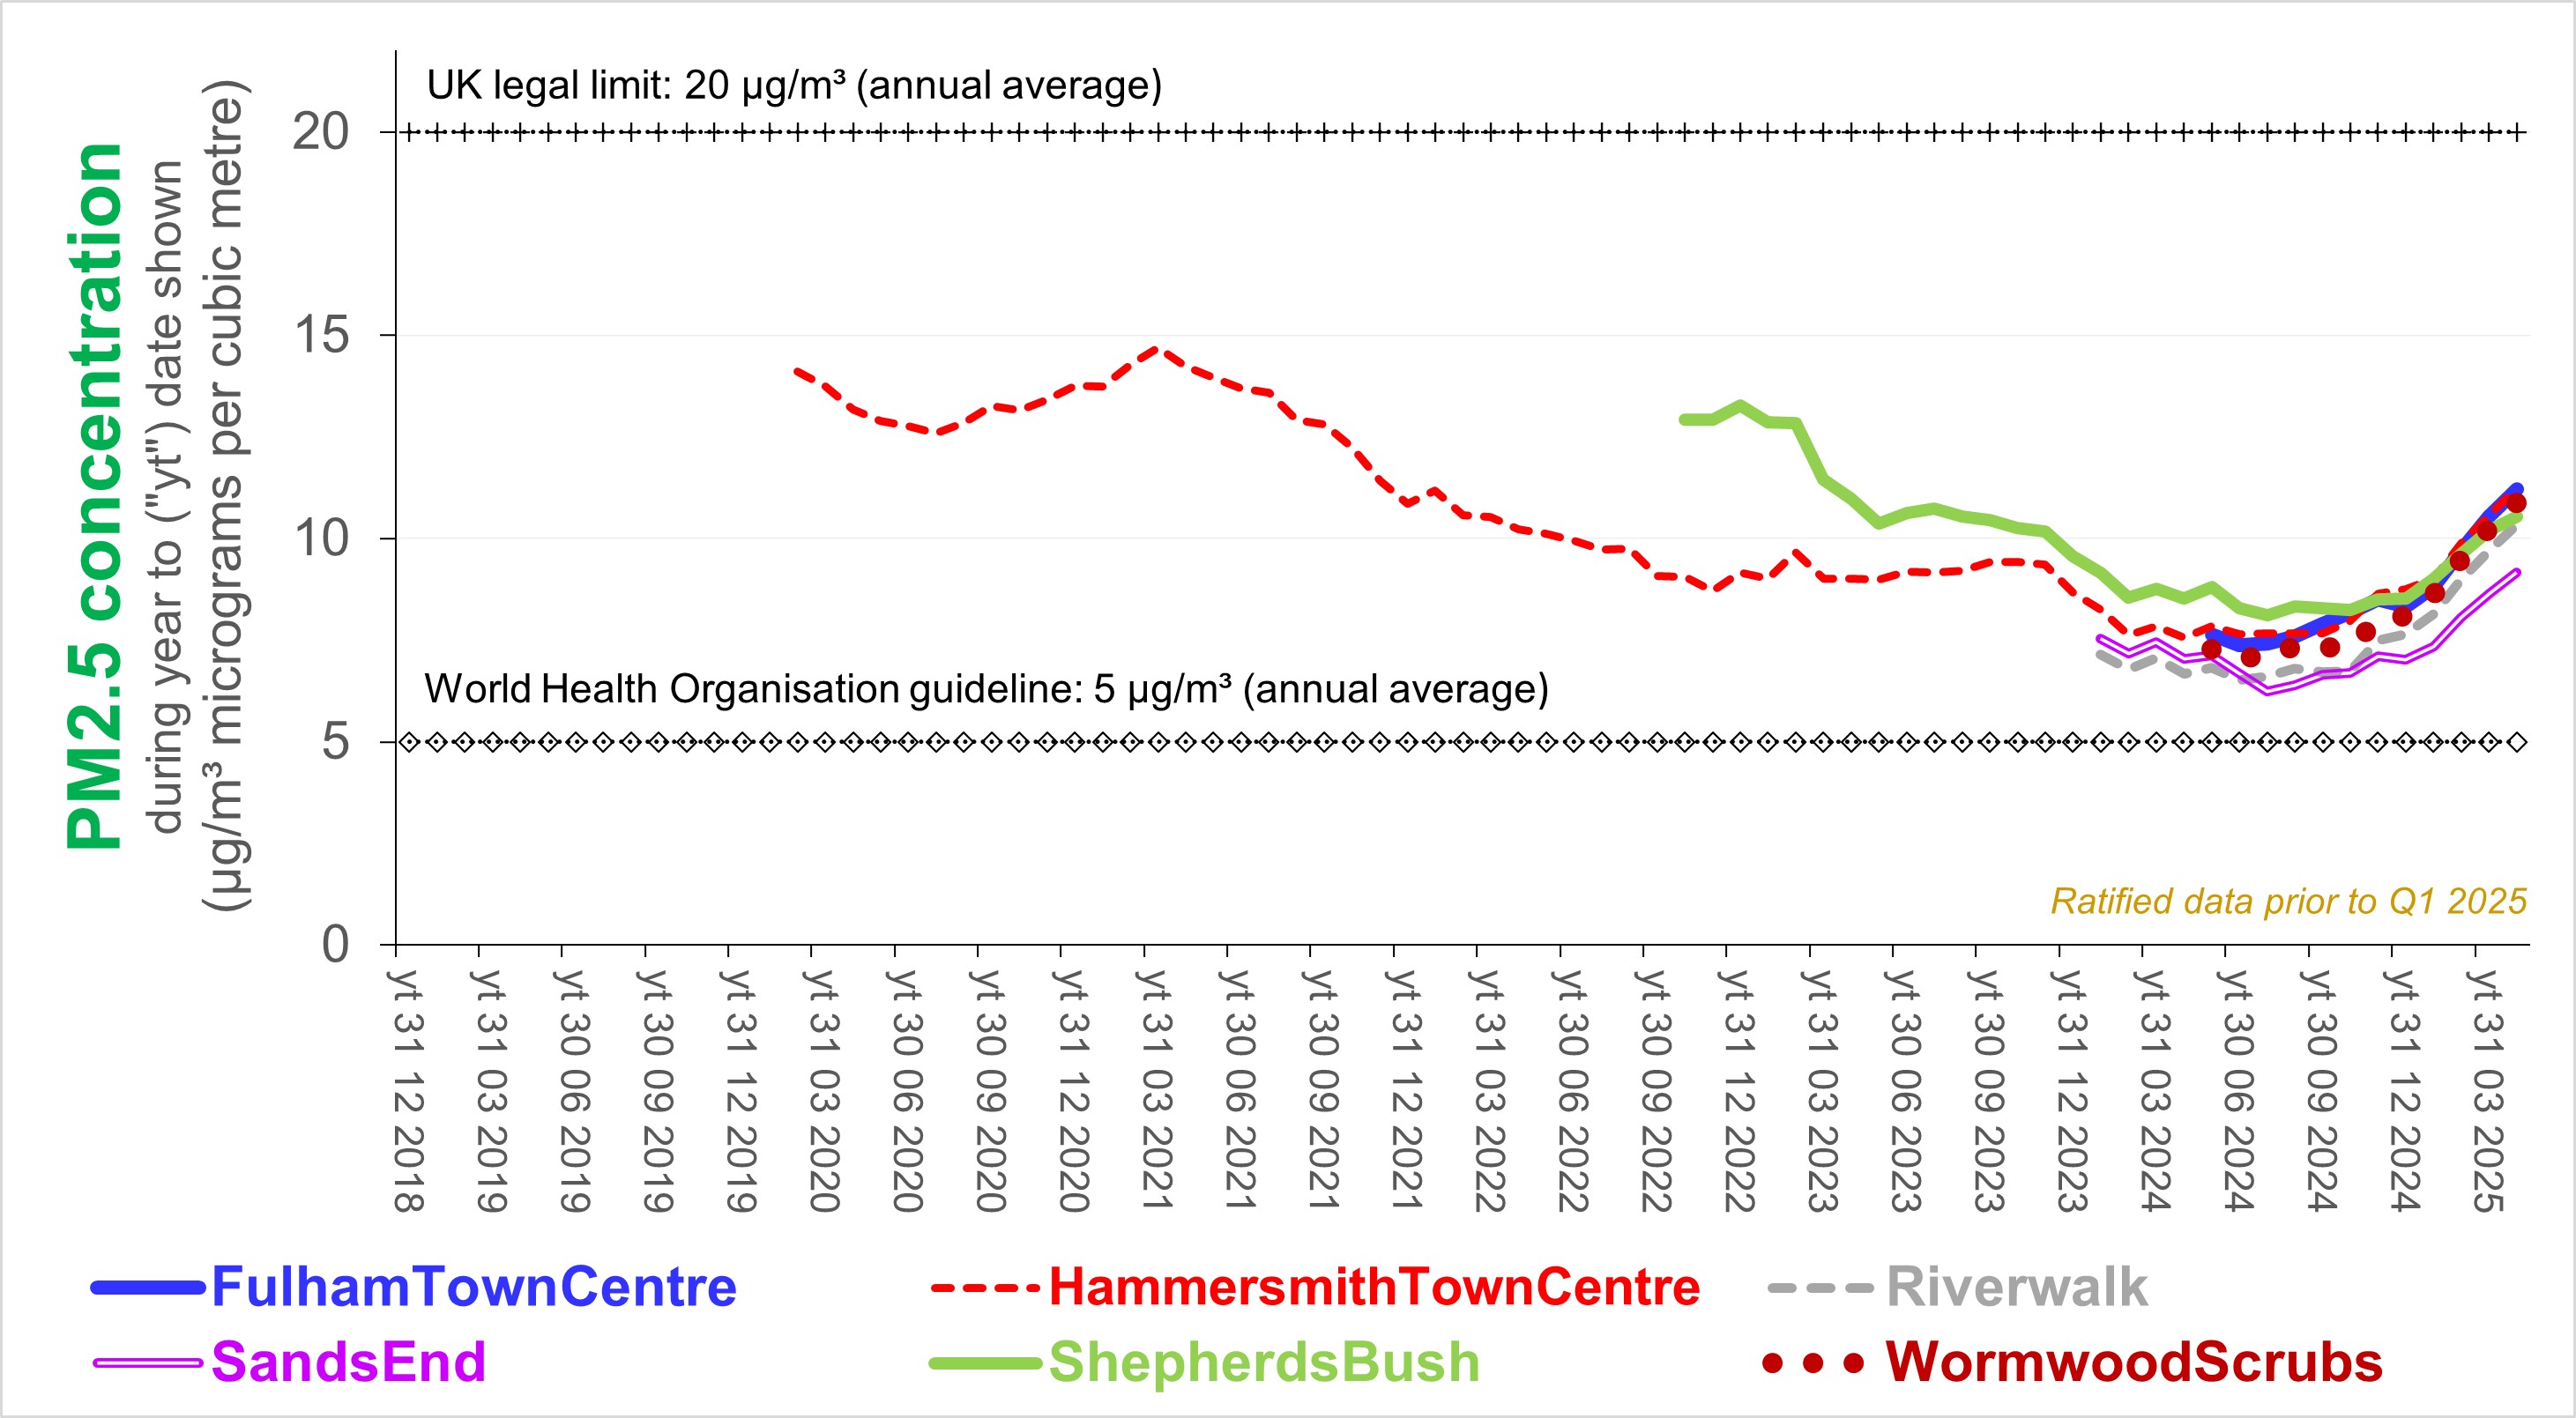
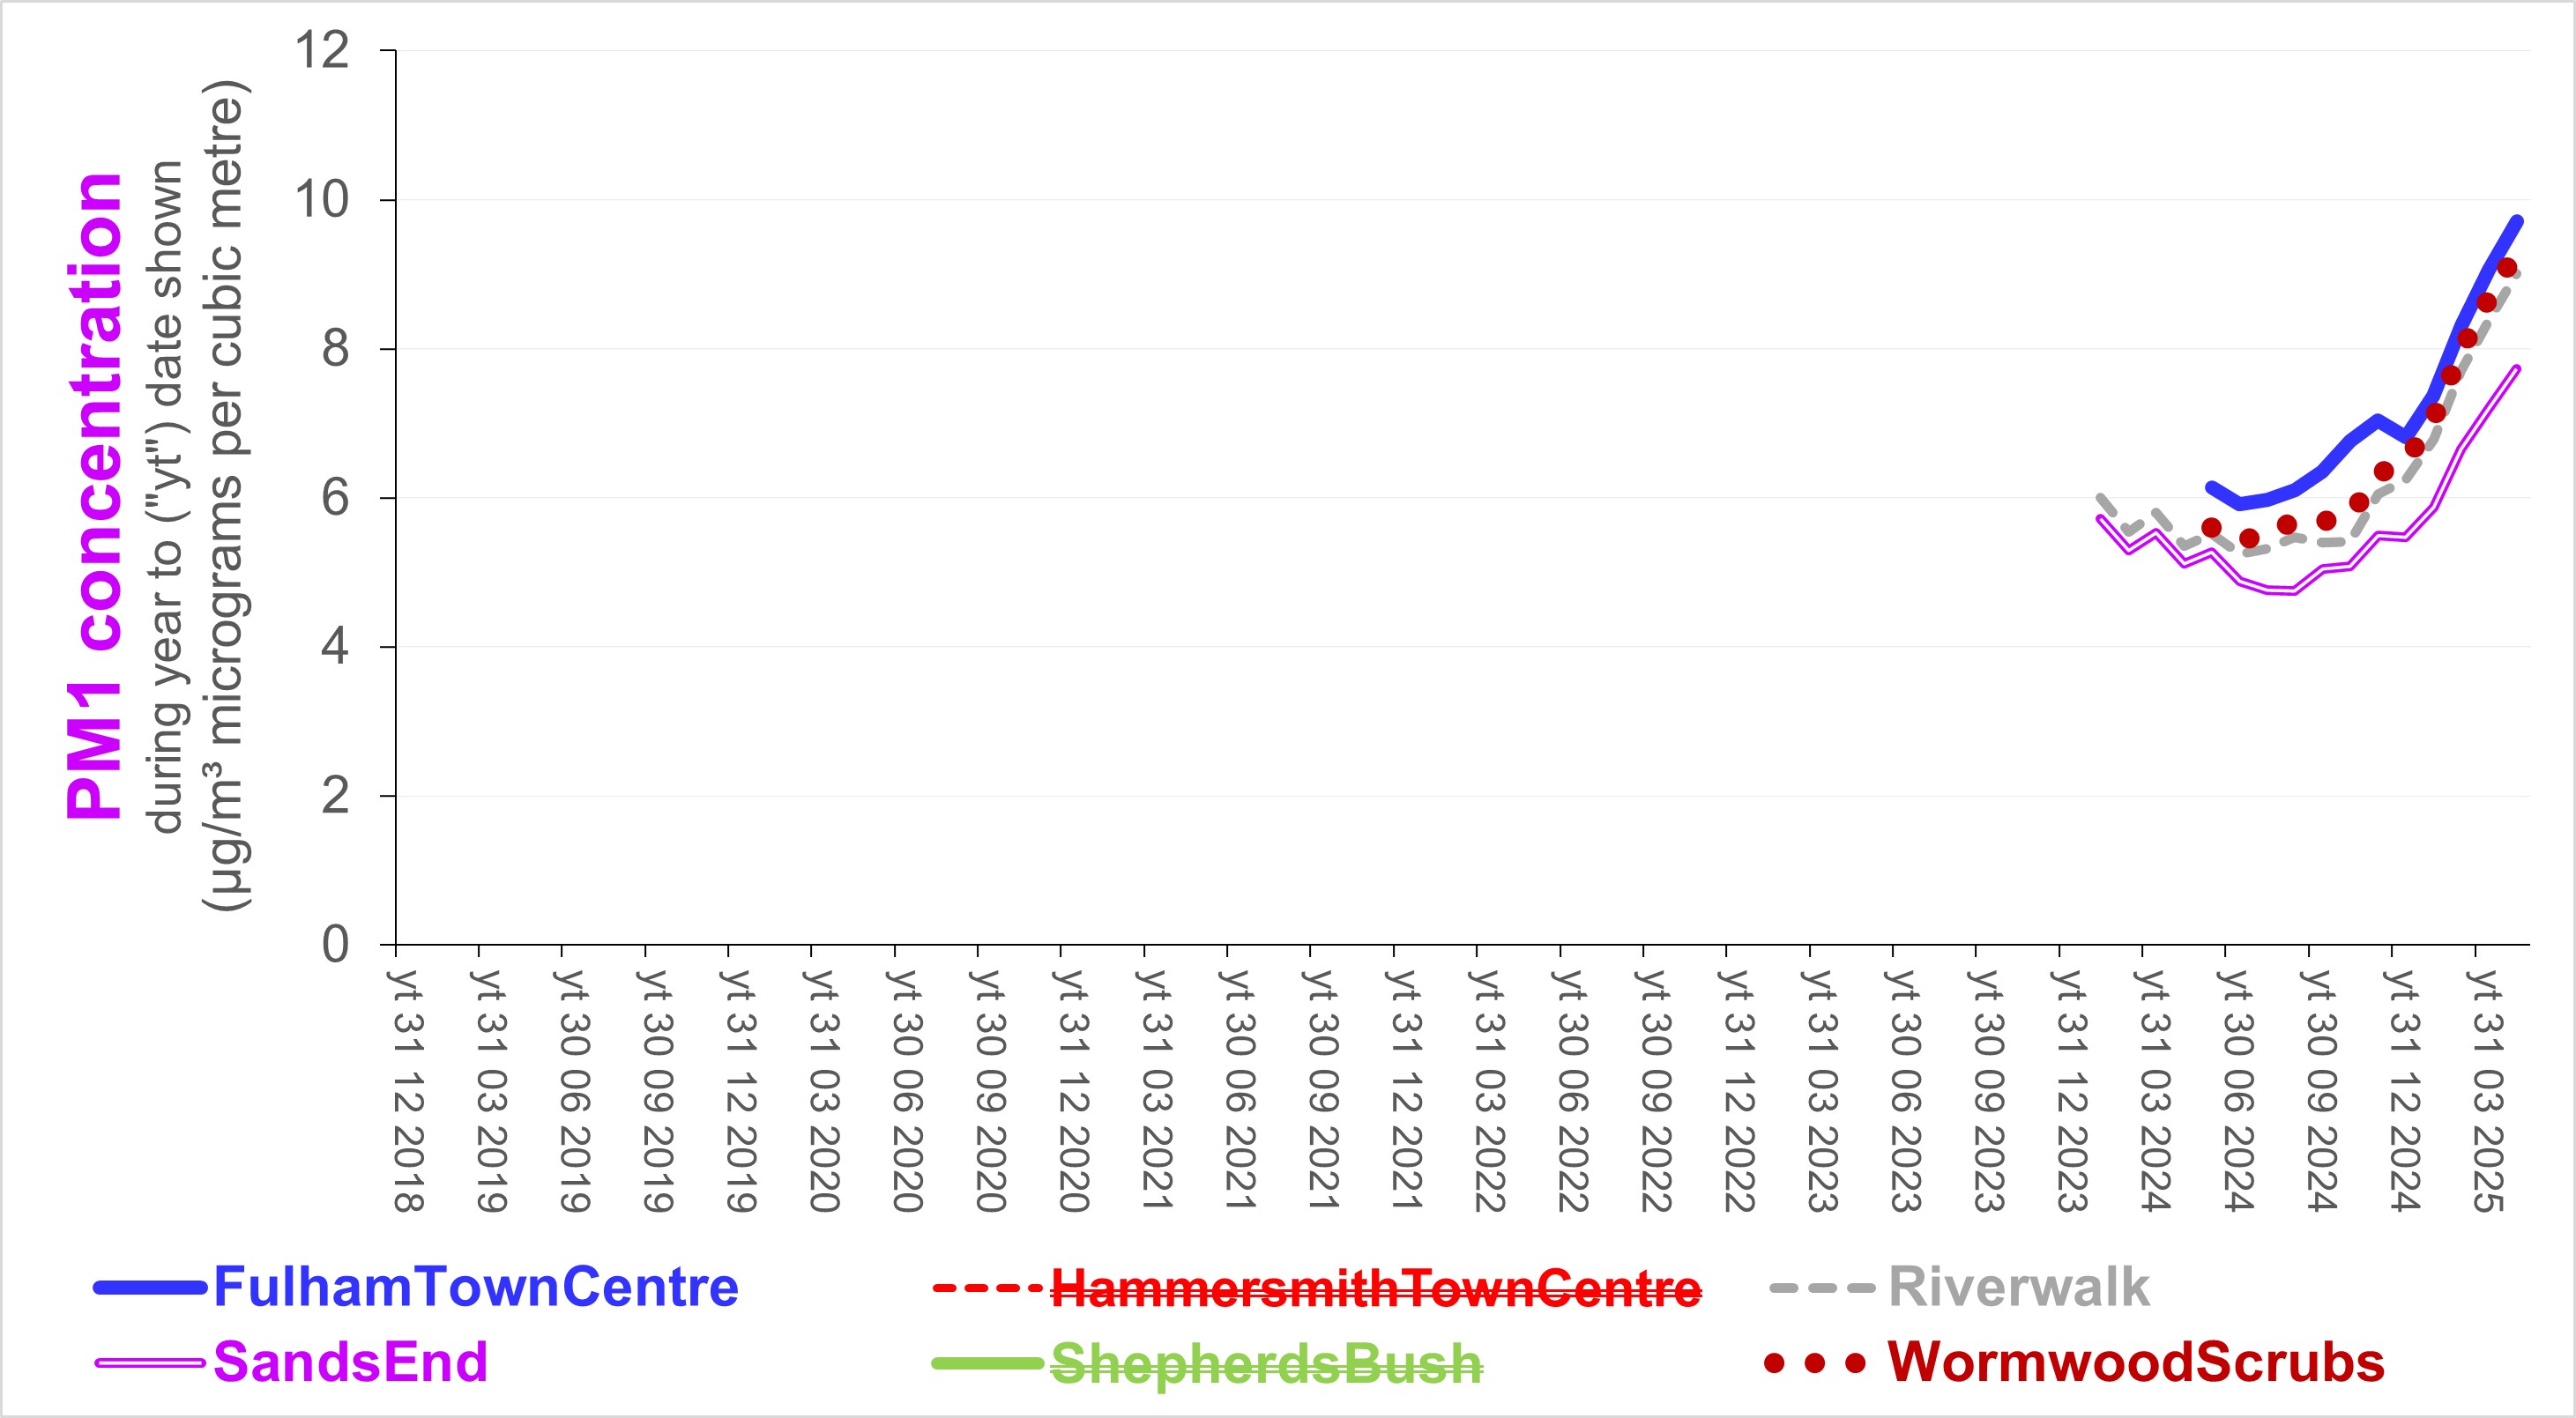
The concentration at the Hammersmith Bridge Road site decreased strongly with the closure of Hammersmith Bridge. London Air and Air Quality England publish concentrations which are measured every hour (or 15 minutes) using special equipment at a number of sites - particularly for reference purposes. The following four charts (based on that data) refer to pollutants of widespread public concern (most notably NO2 and PM2.5).
The increase (and subsequent decline) in concentration of PM10 at the Sheperds Bush might be attributable to construction work (and its completion).
Trends in concentration of NO2 as measured by
HS2 using diffusion tubes are shown below.
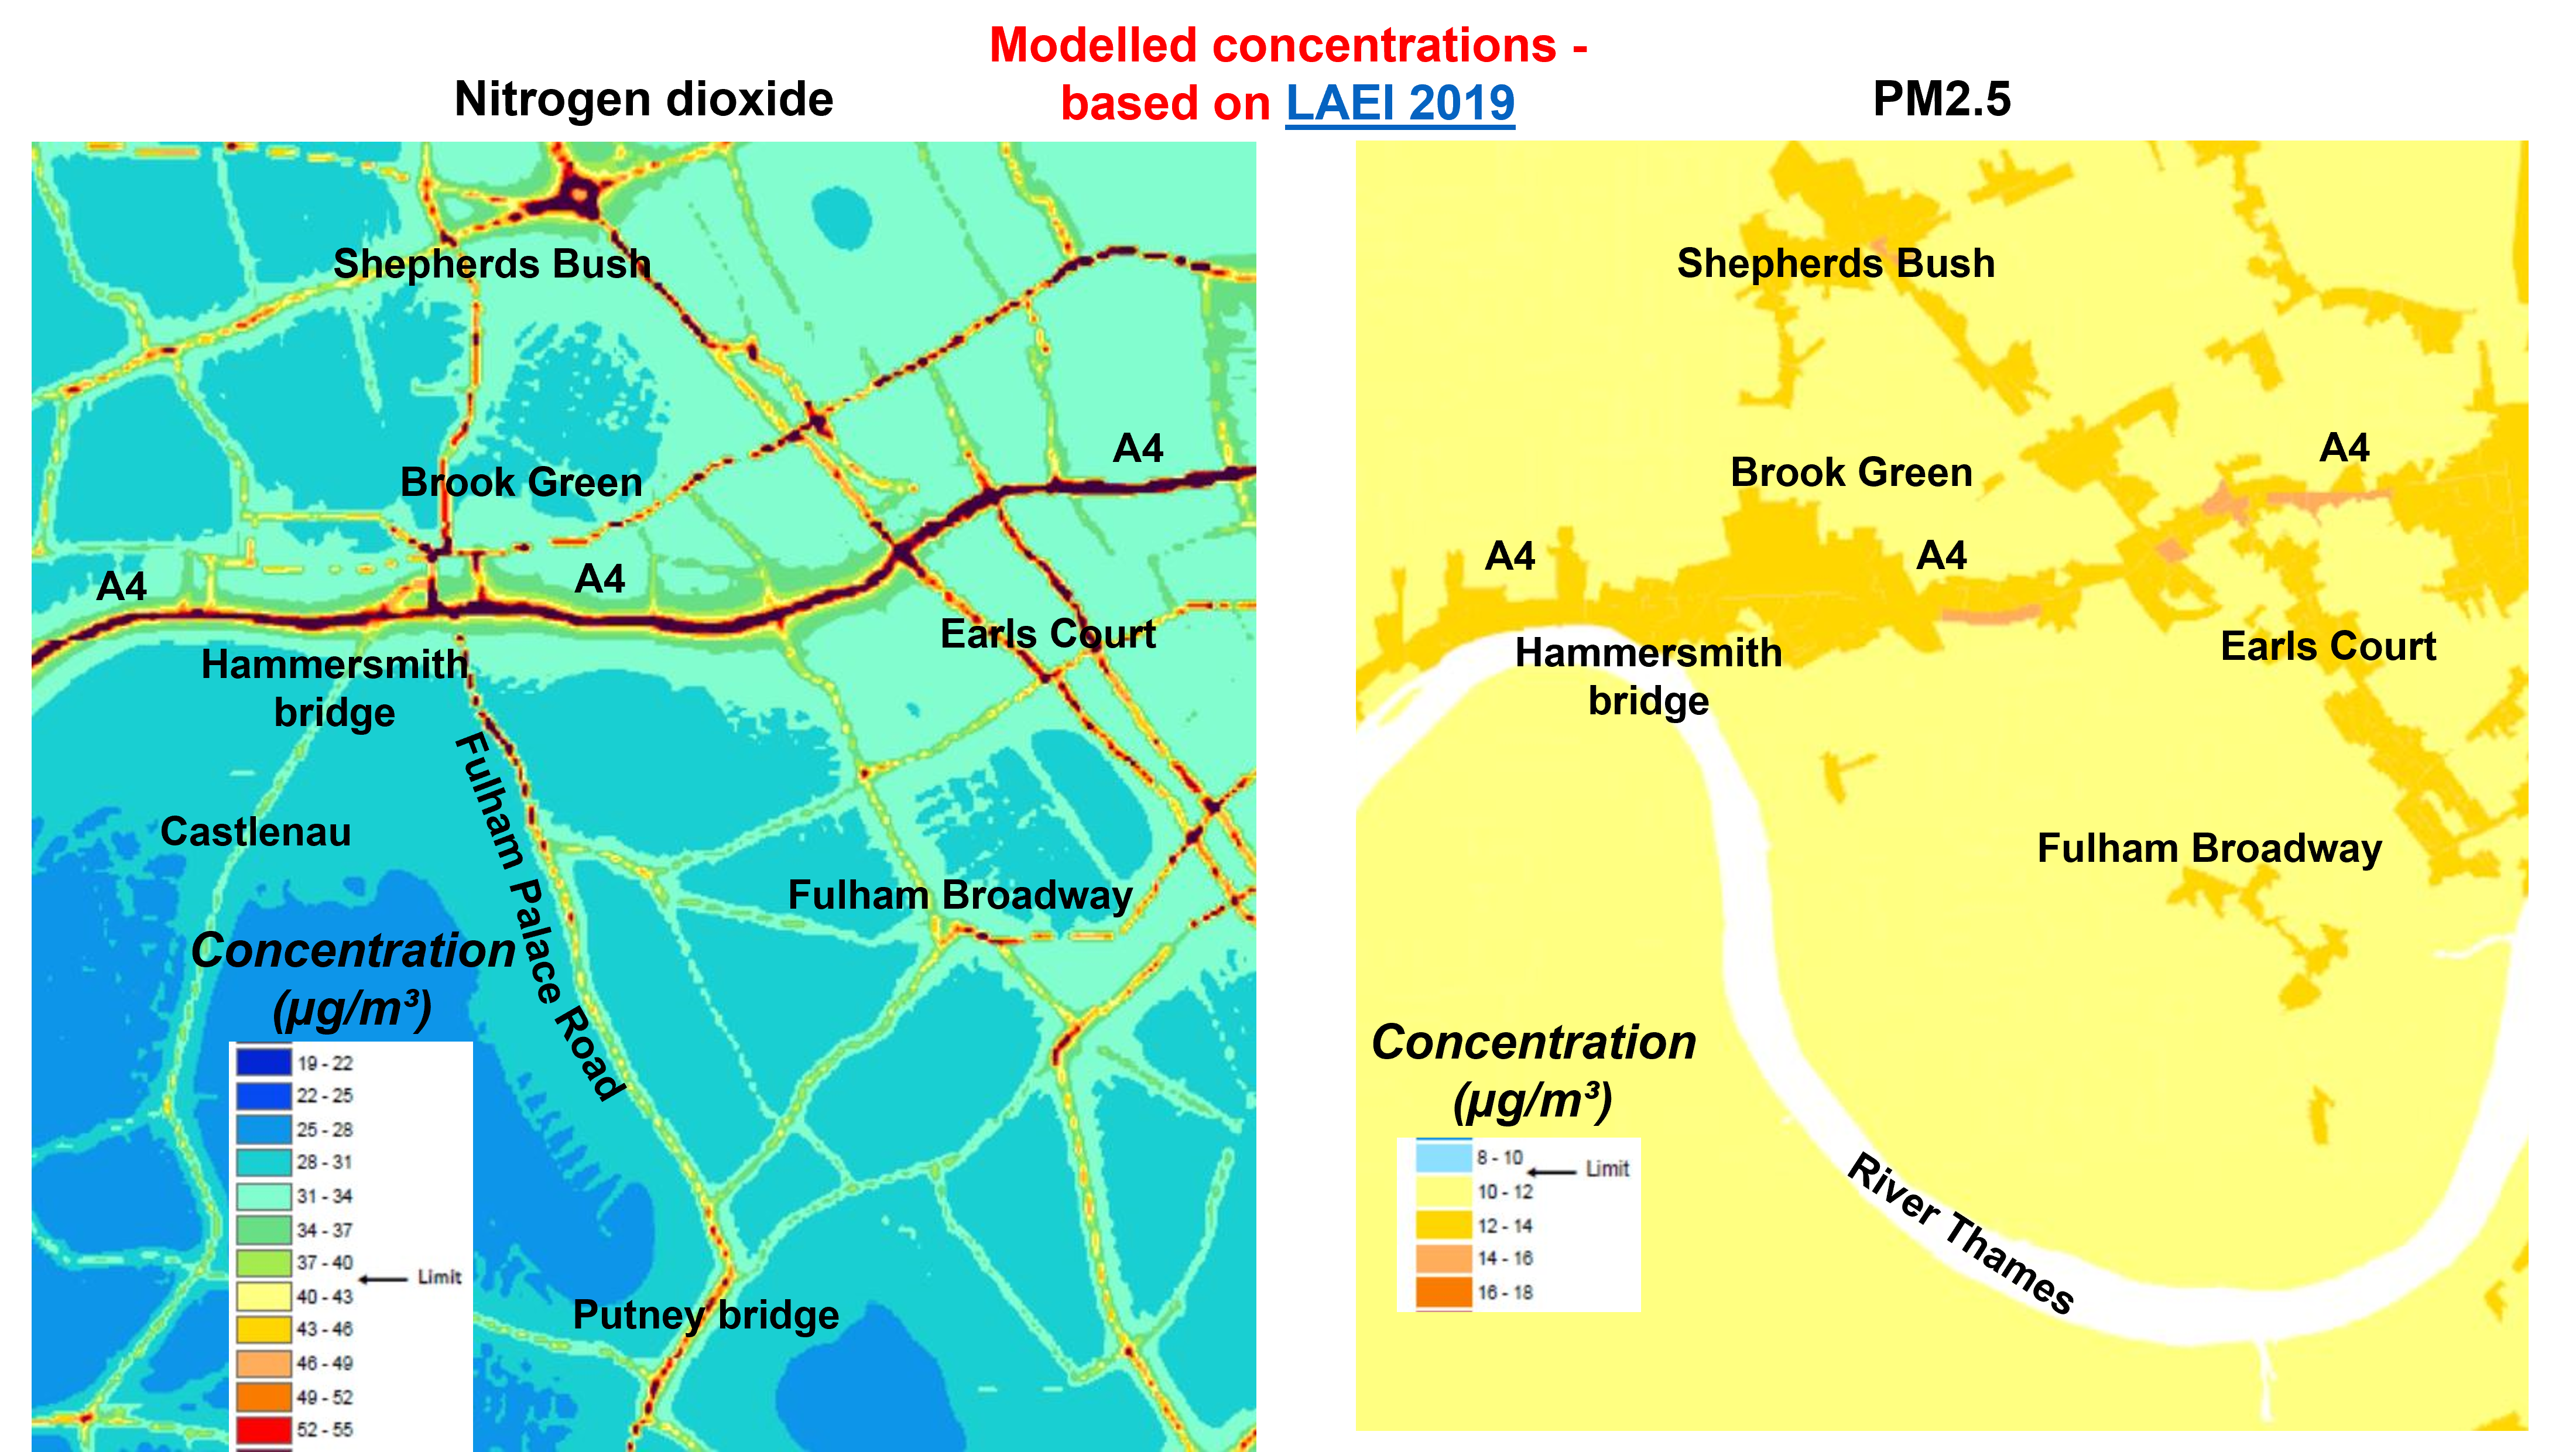
Several Clarity sensors have been installed in the borough (mostly adjacent schools, at public expense). Generating indicative (not reference quality) measurements, their primary purpose is public engagement. This requires interpretation of the measurements in the context of (monthly) data from other devices across the borough, and further afield. The measurements for each hour are published continuously on the Breathe London website. Together with the few hundred other sensors managed by Breathe London, these sensors are calibrated against reference quality data. The latter is ratified periodically - with a time lag of typically between three and 15 months. Consequently, the Breathe London measurements are subject to revision. Due primarily to seasonal variation, a time series longer than one year is necessary if trends in the concentrations measured are required. Concentrations tend to be lowest on hot, wet, windy days and worst on cold, dry, still days - provided there is no temperature inversion. In this borough much of the concentration of nitrogen dioxide ("NO2") is likely to be attributable to combustion - especially of diesel and methane ("natural" / fossil gas). Some will derive from sources outside London. Concentrations tend to be greatest inside vehicles being driven, especially in congested areas and when idling. Concentrations tend to decline rapidly with distance away from hotspots - as shown on the following map (based on modelled data prepared for the GLA).
|
|
For further information, please contact: info@airqualitymatters.uk |
| Back |