|
AIR QUALITY MATTERS |
|
Royal Borough of Greenwich |
"PM ready to
rise courtesy of SIlvertown Tunnel?"
|
|
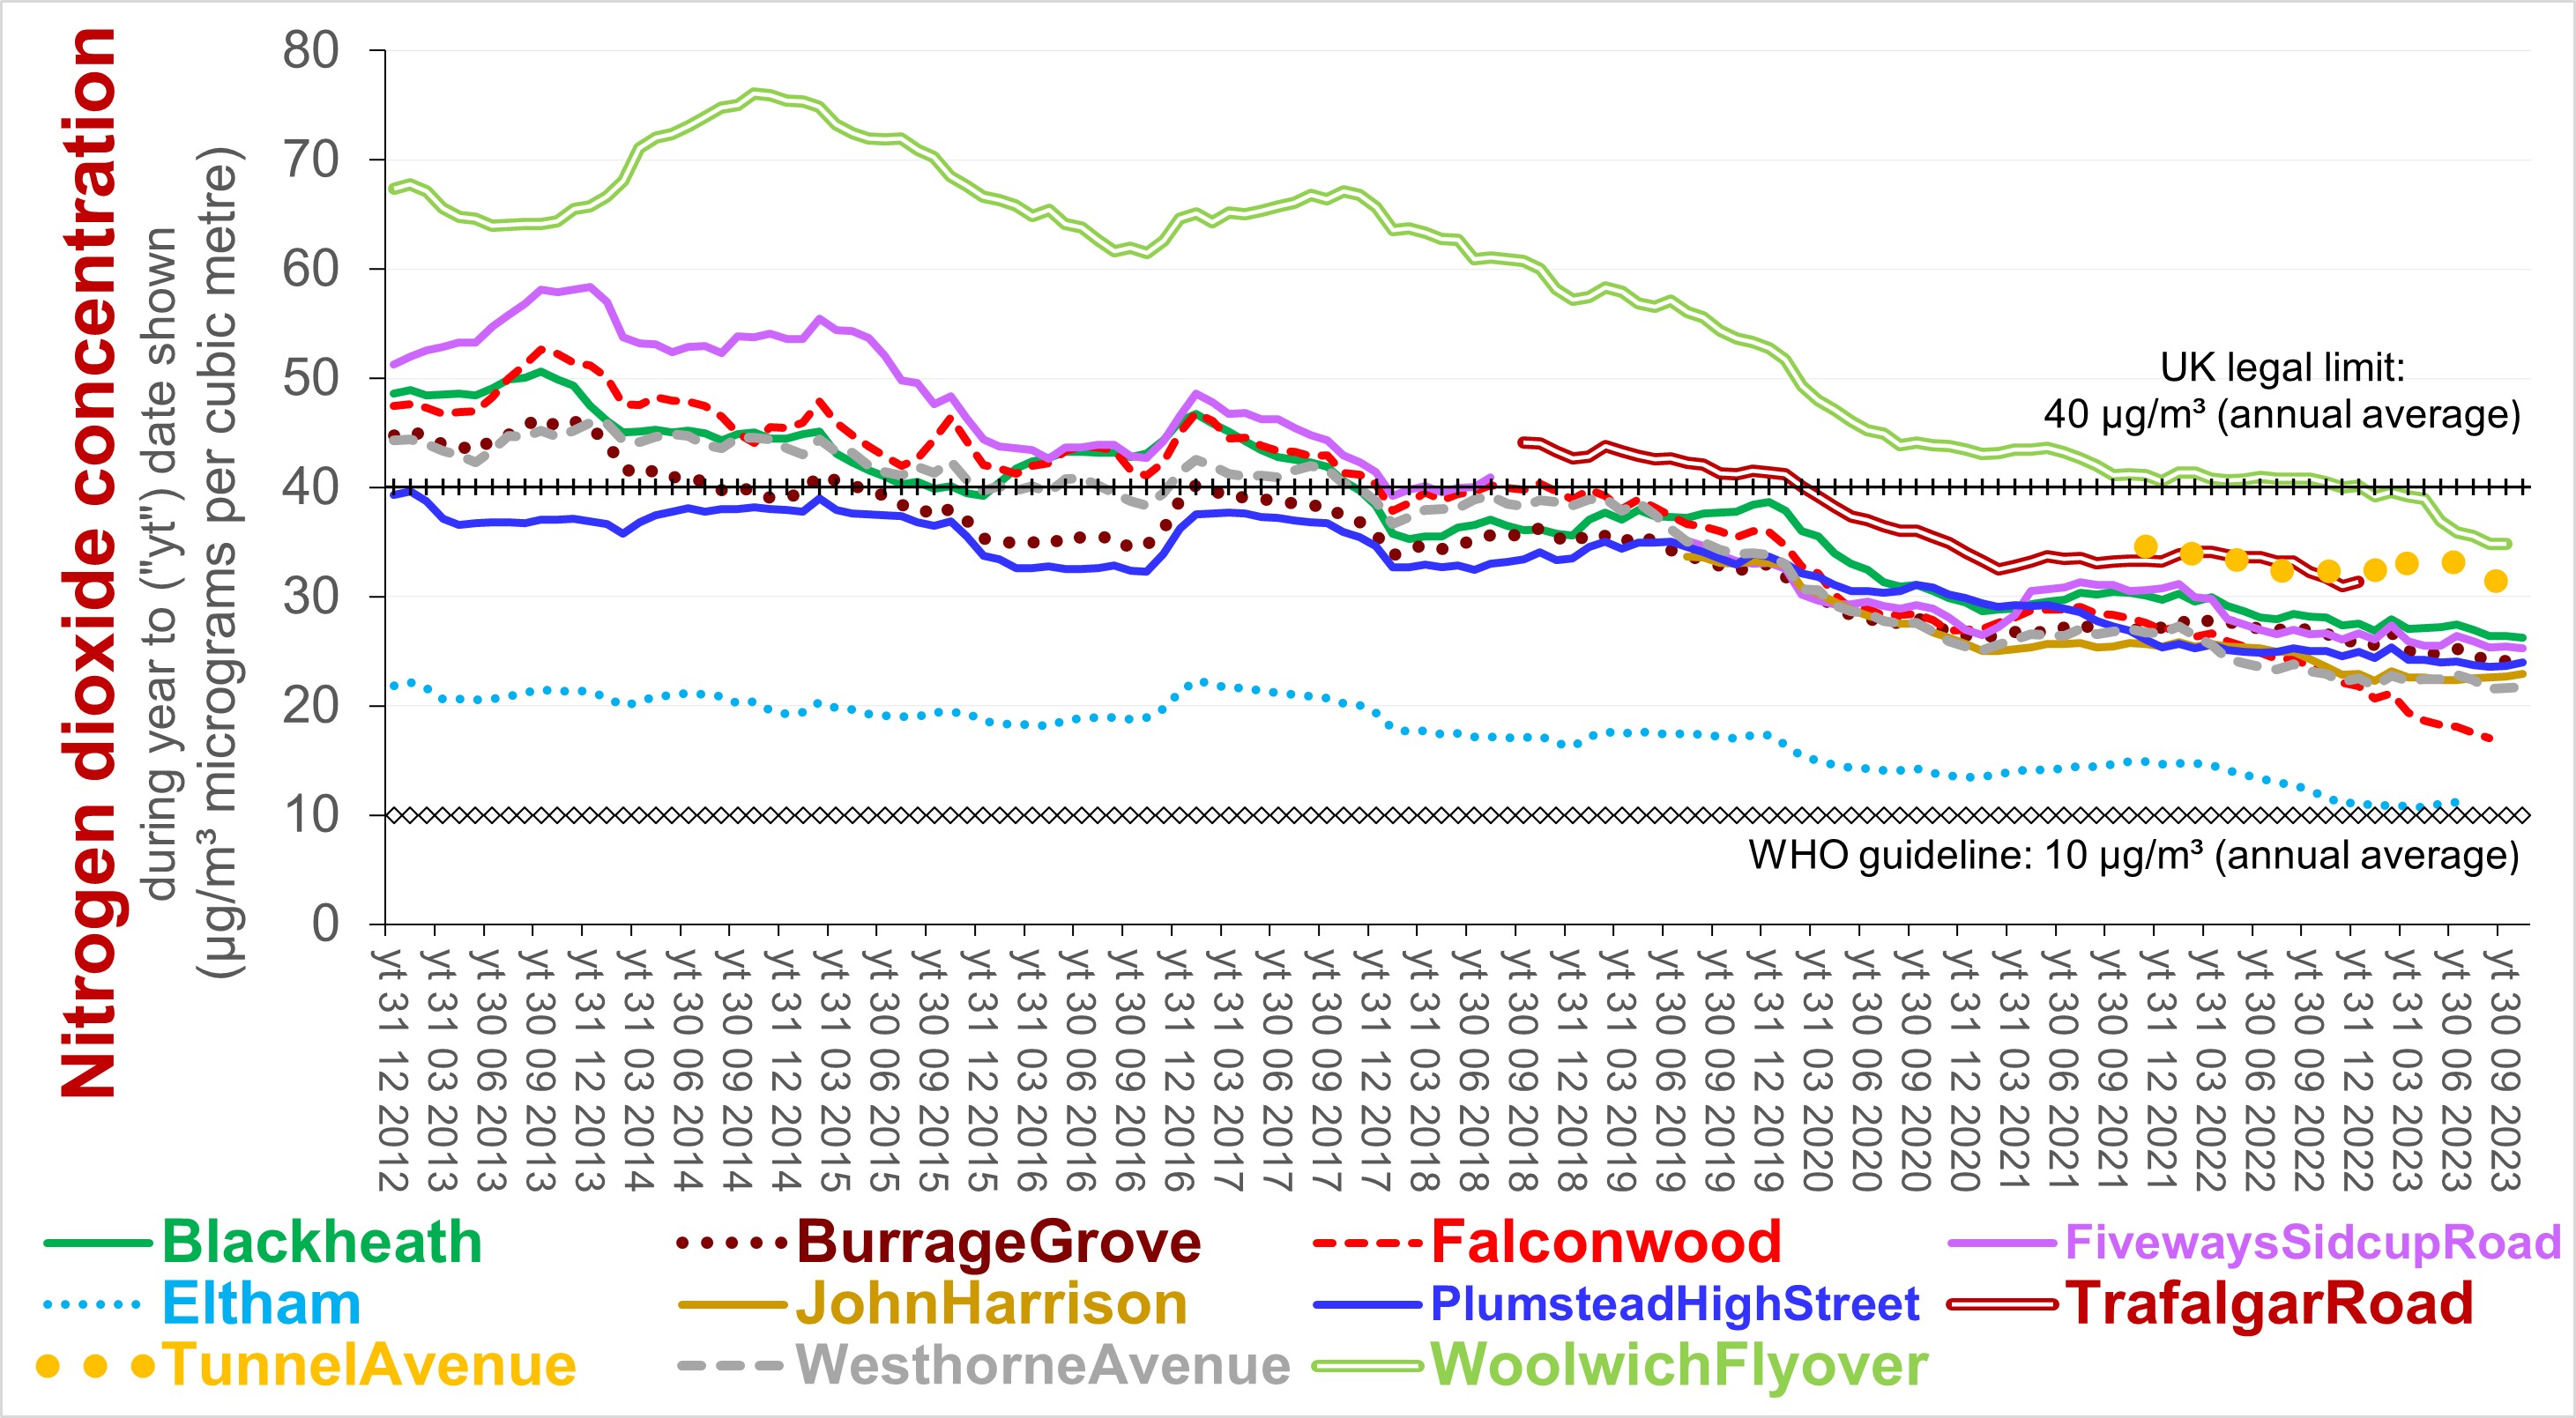
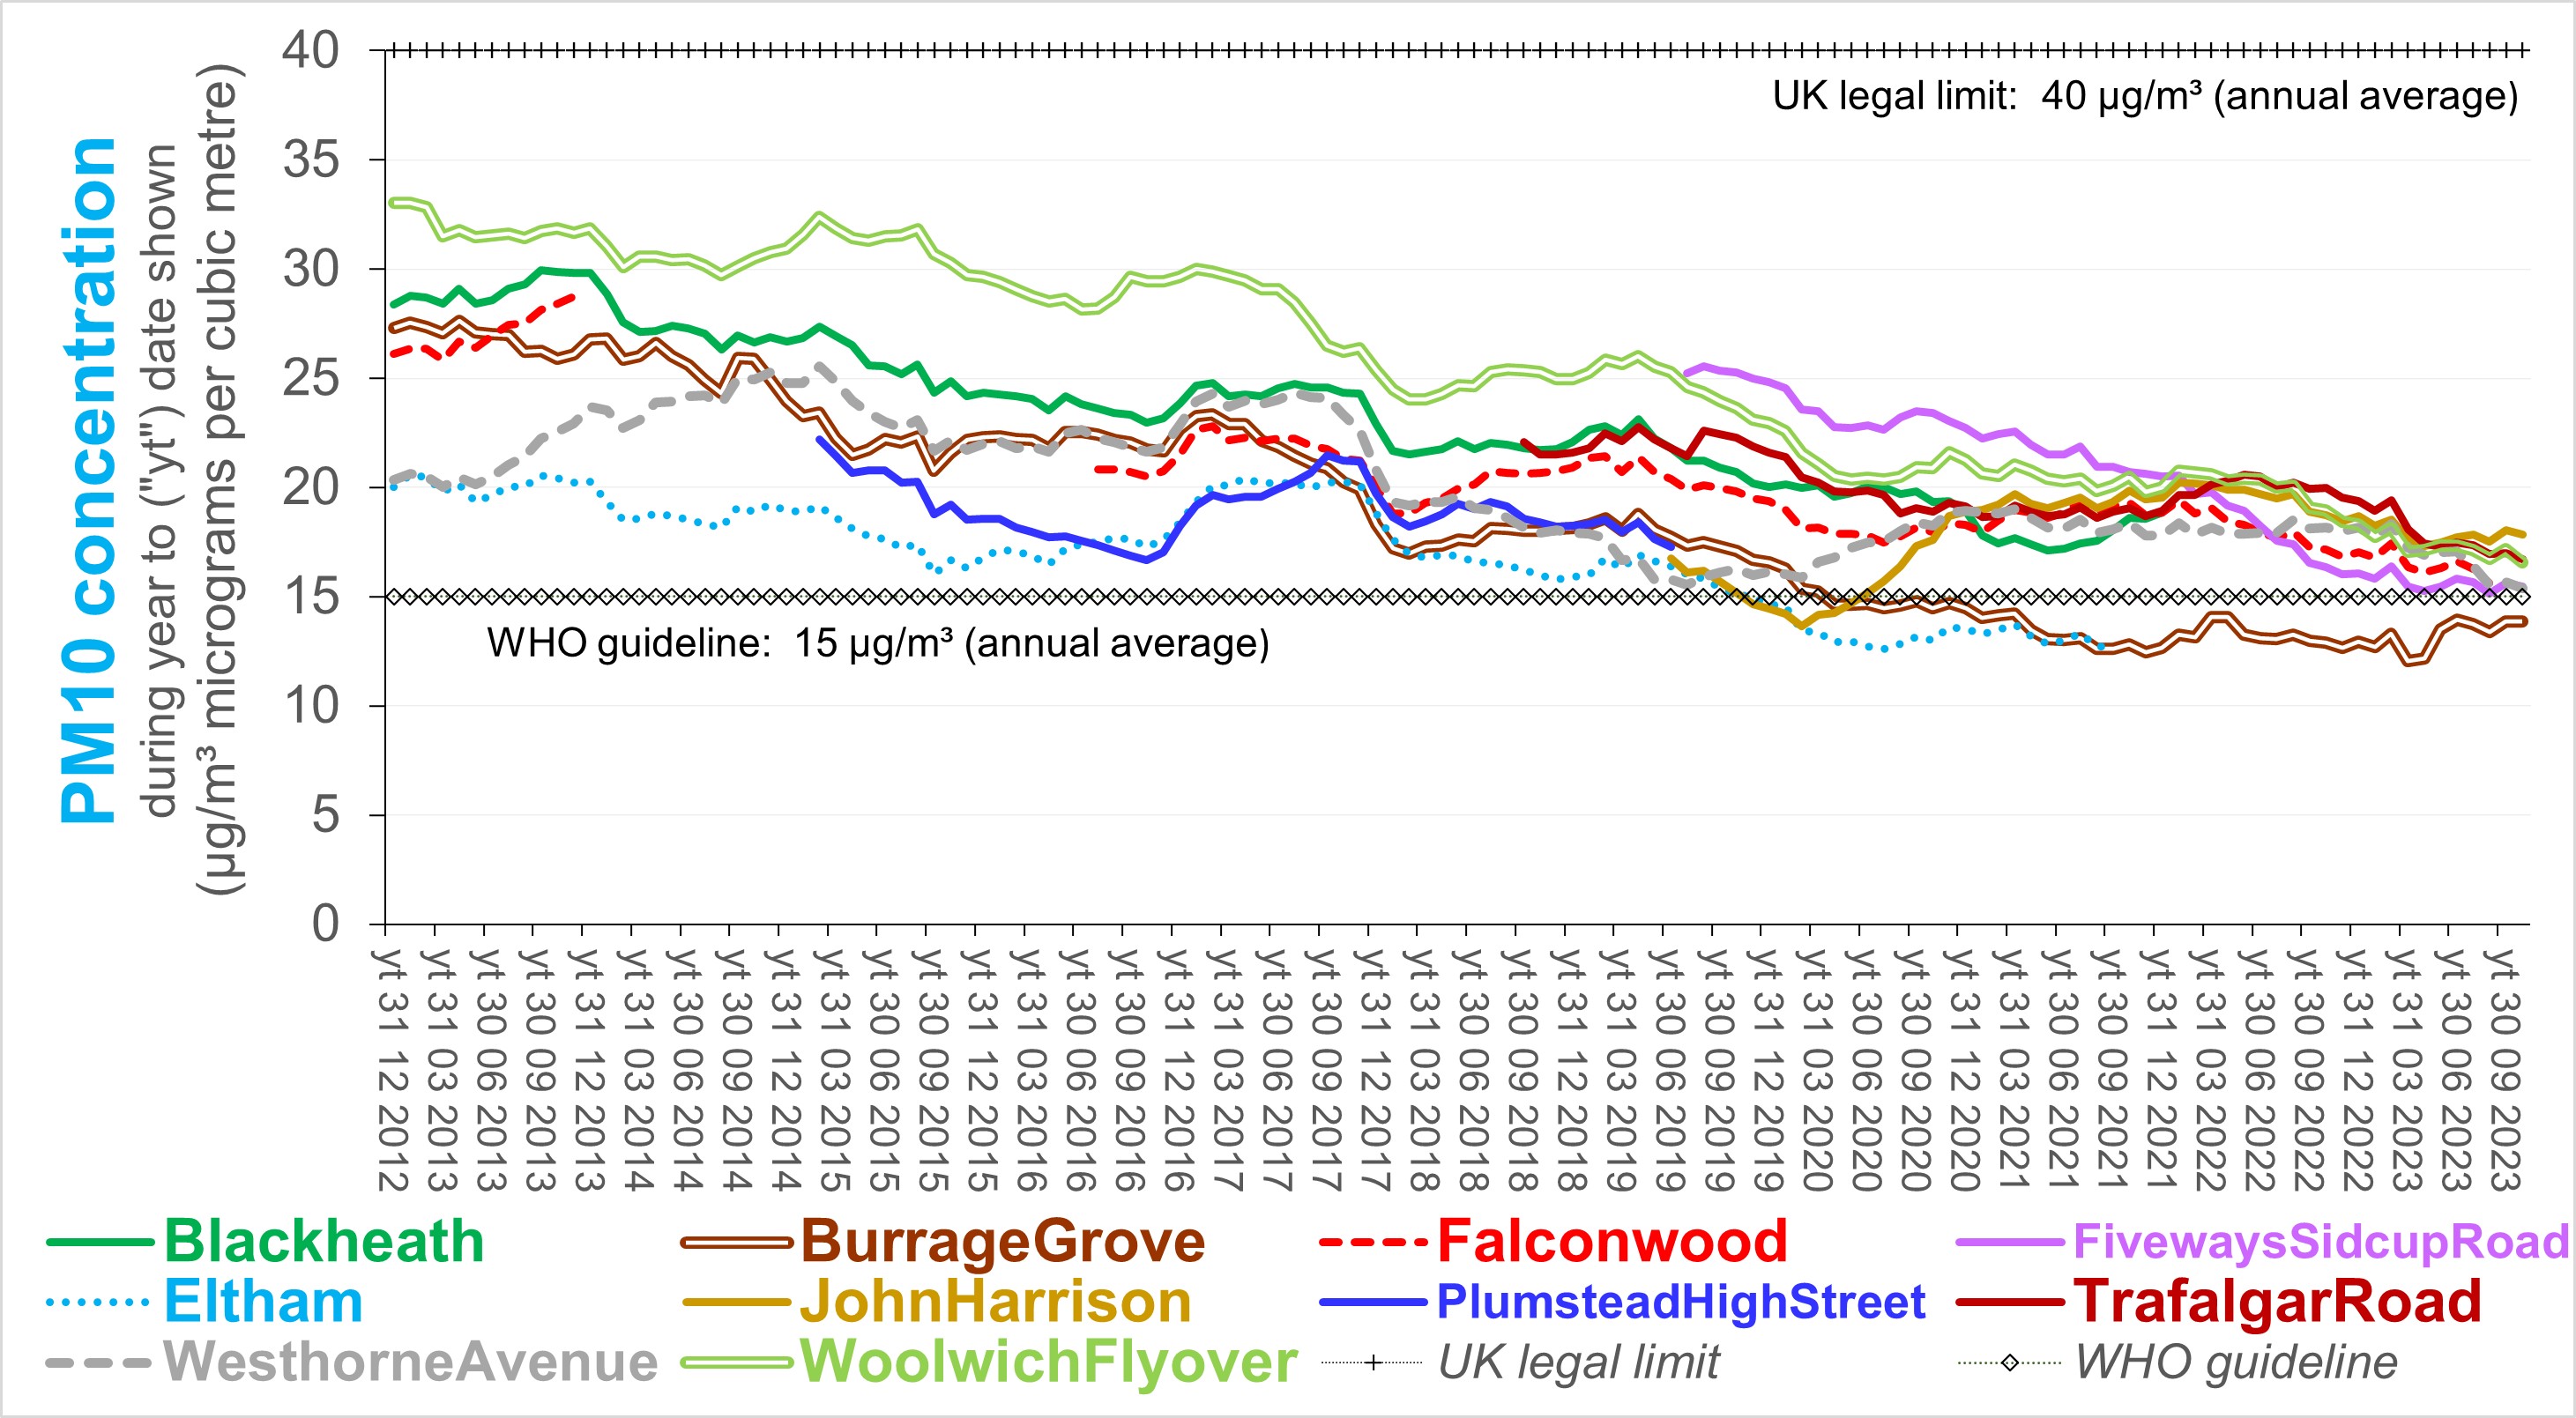
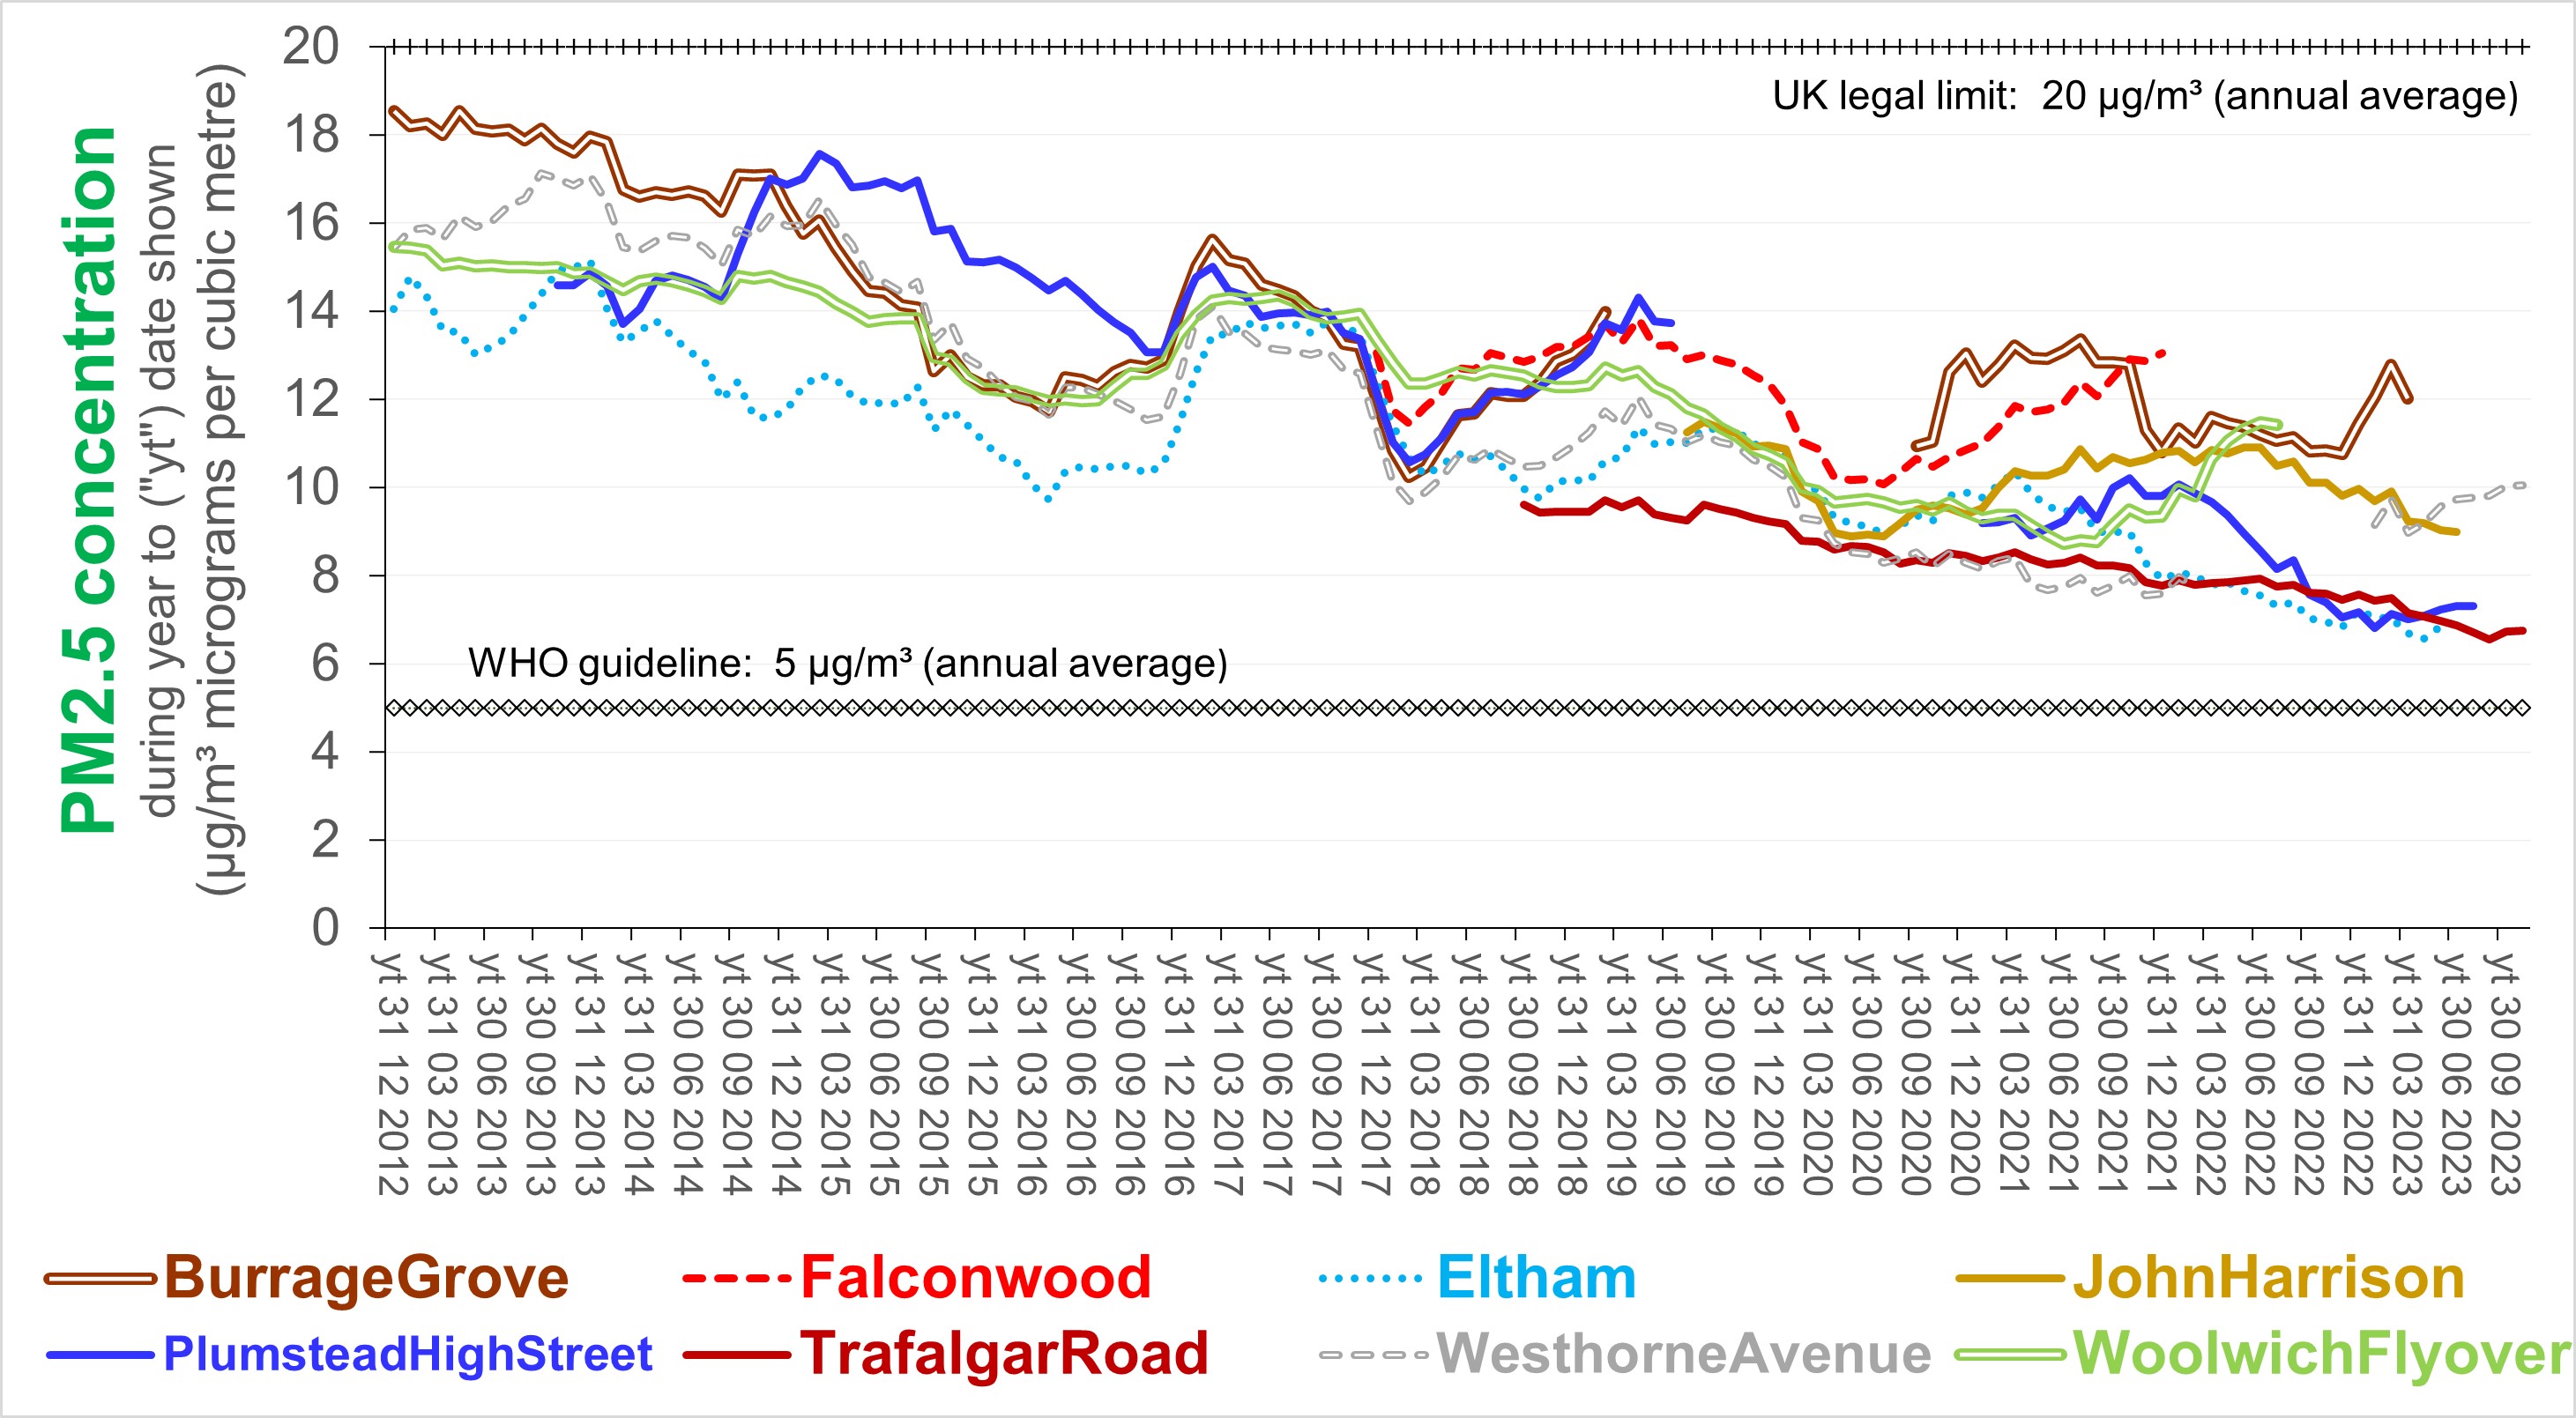
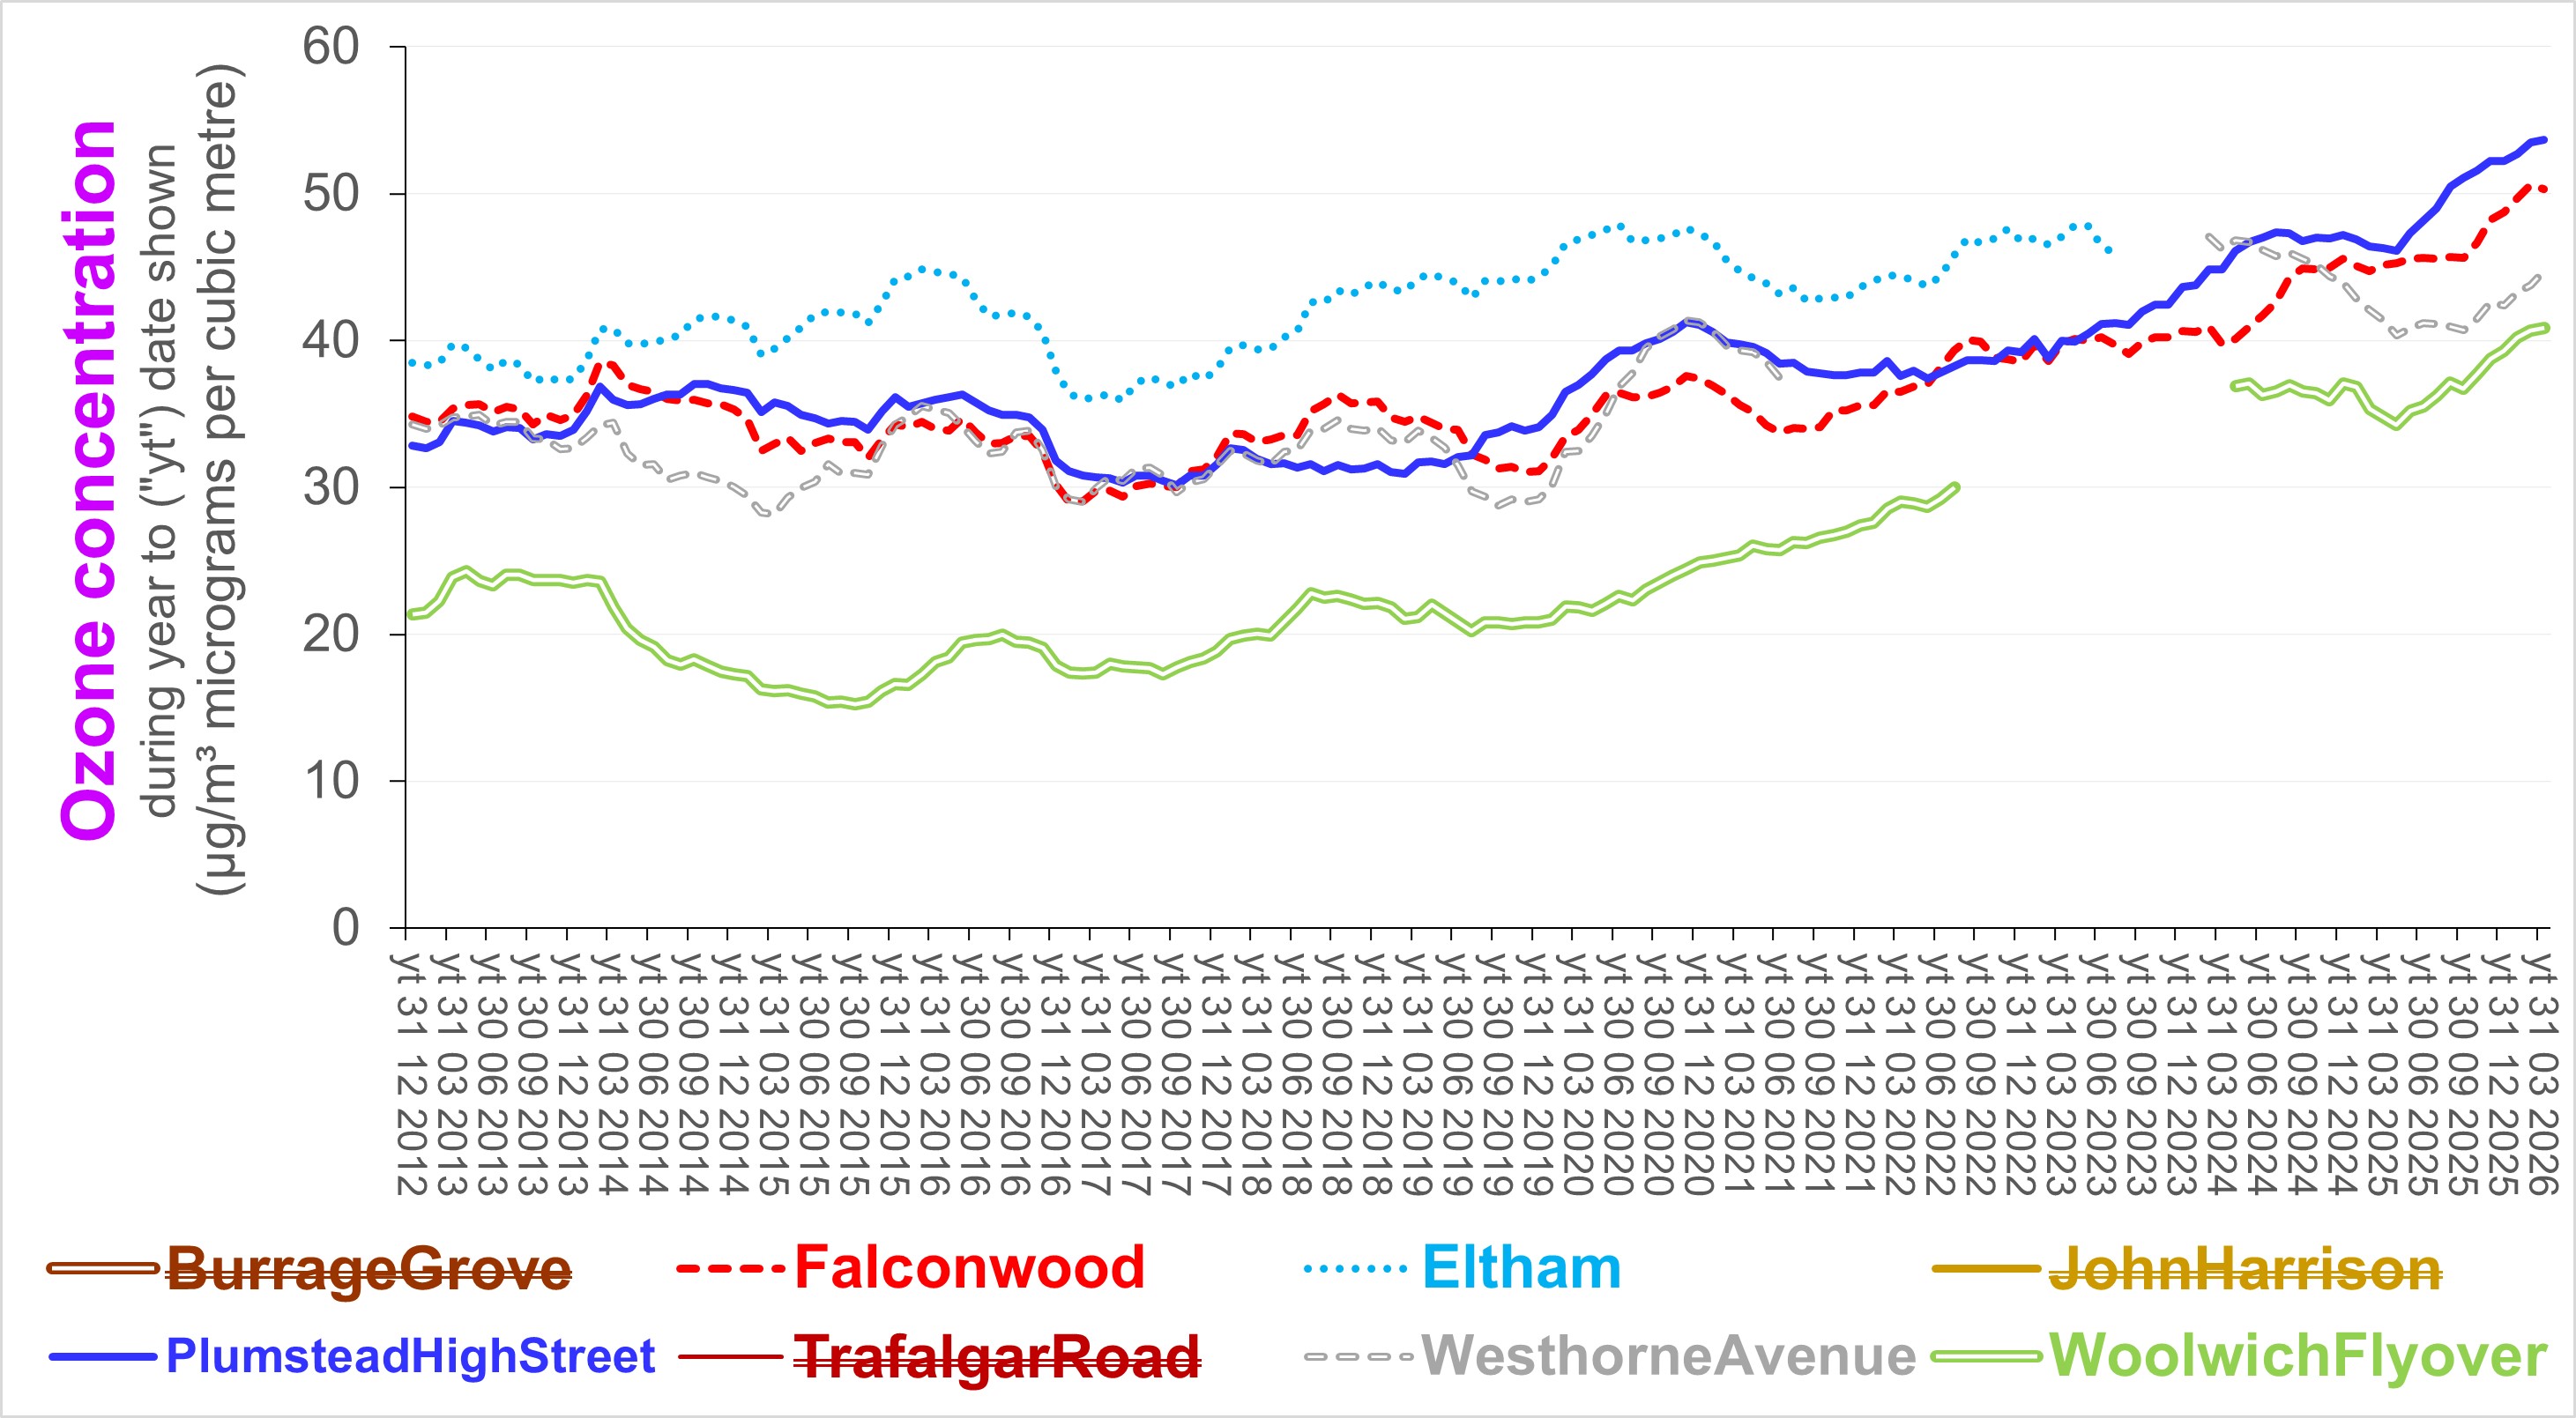
The following charts illustrate changes in the annual average concentration of four air pollutants which have occured since 2012. The measurements reflect conditions in the immediate vicinity of the monitoring site rather than in the named locality. The measurements for 2022 have yet to be fully ratified. They are based on London Air.
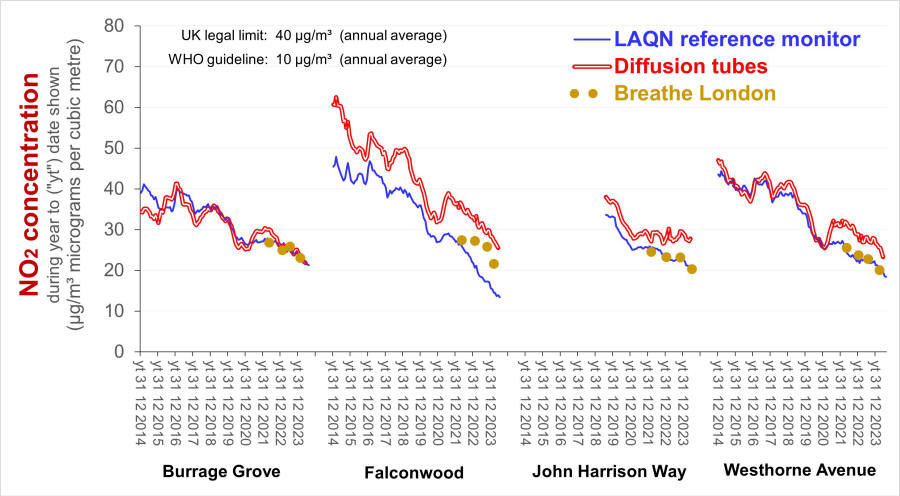
Indicative (implicitly unratified) concentrations of nitrogen
dioxide ("NO2") and fine particulate matter ("PM2.5") are being
measured at several locations across London through Breathe
London, including in this borough. Four are co-located
with reference monitors. This helps calibrate other
indicative devices managed by Breathe London. The following
chart compares trends between concentrations reported for
reference monitors which are co-located with indicative devices
and diffustion tubes. The latter has not been adjusted for
bias. The difference between the concentrations reported for the
reference monitors and the diffusion tubes indicates the
annualised "bias
adjustment factor" which one might apply to NO2 diffusion tubes
located elsewhere across the borough (but DEFRA rules constrain
the bias adjustment factors which local authorities adopt).
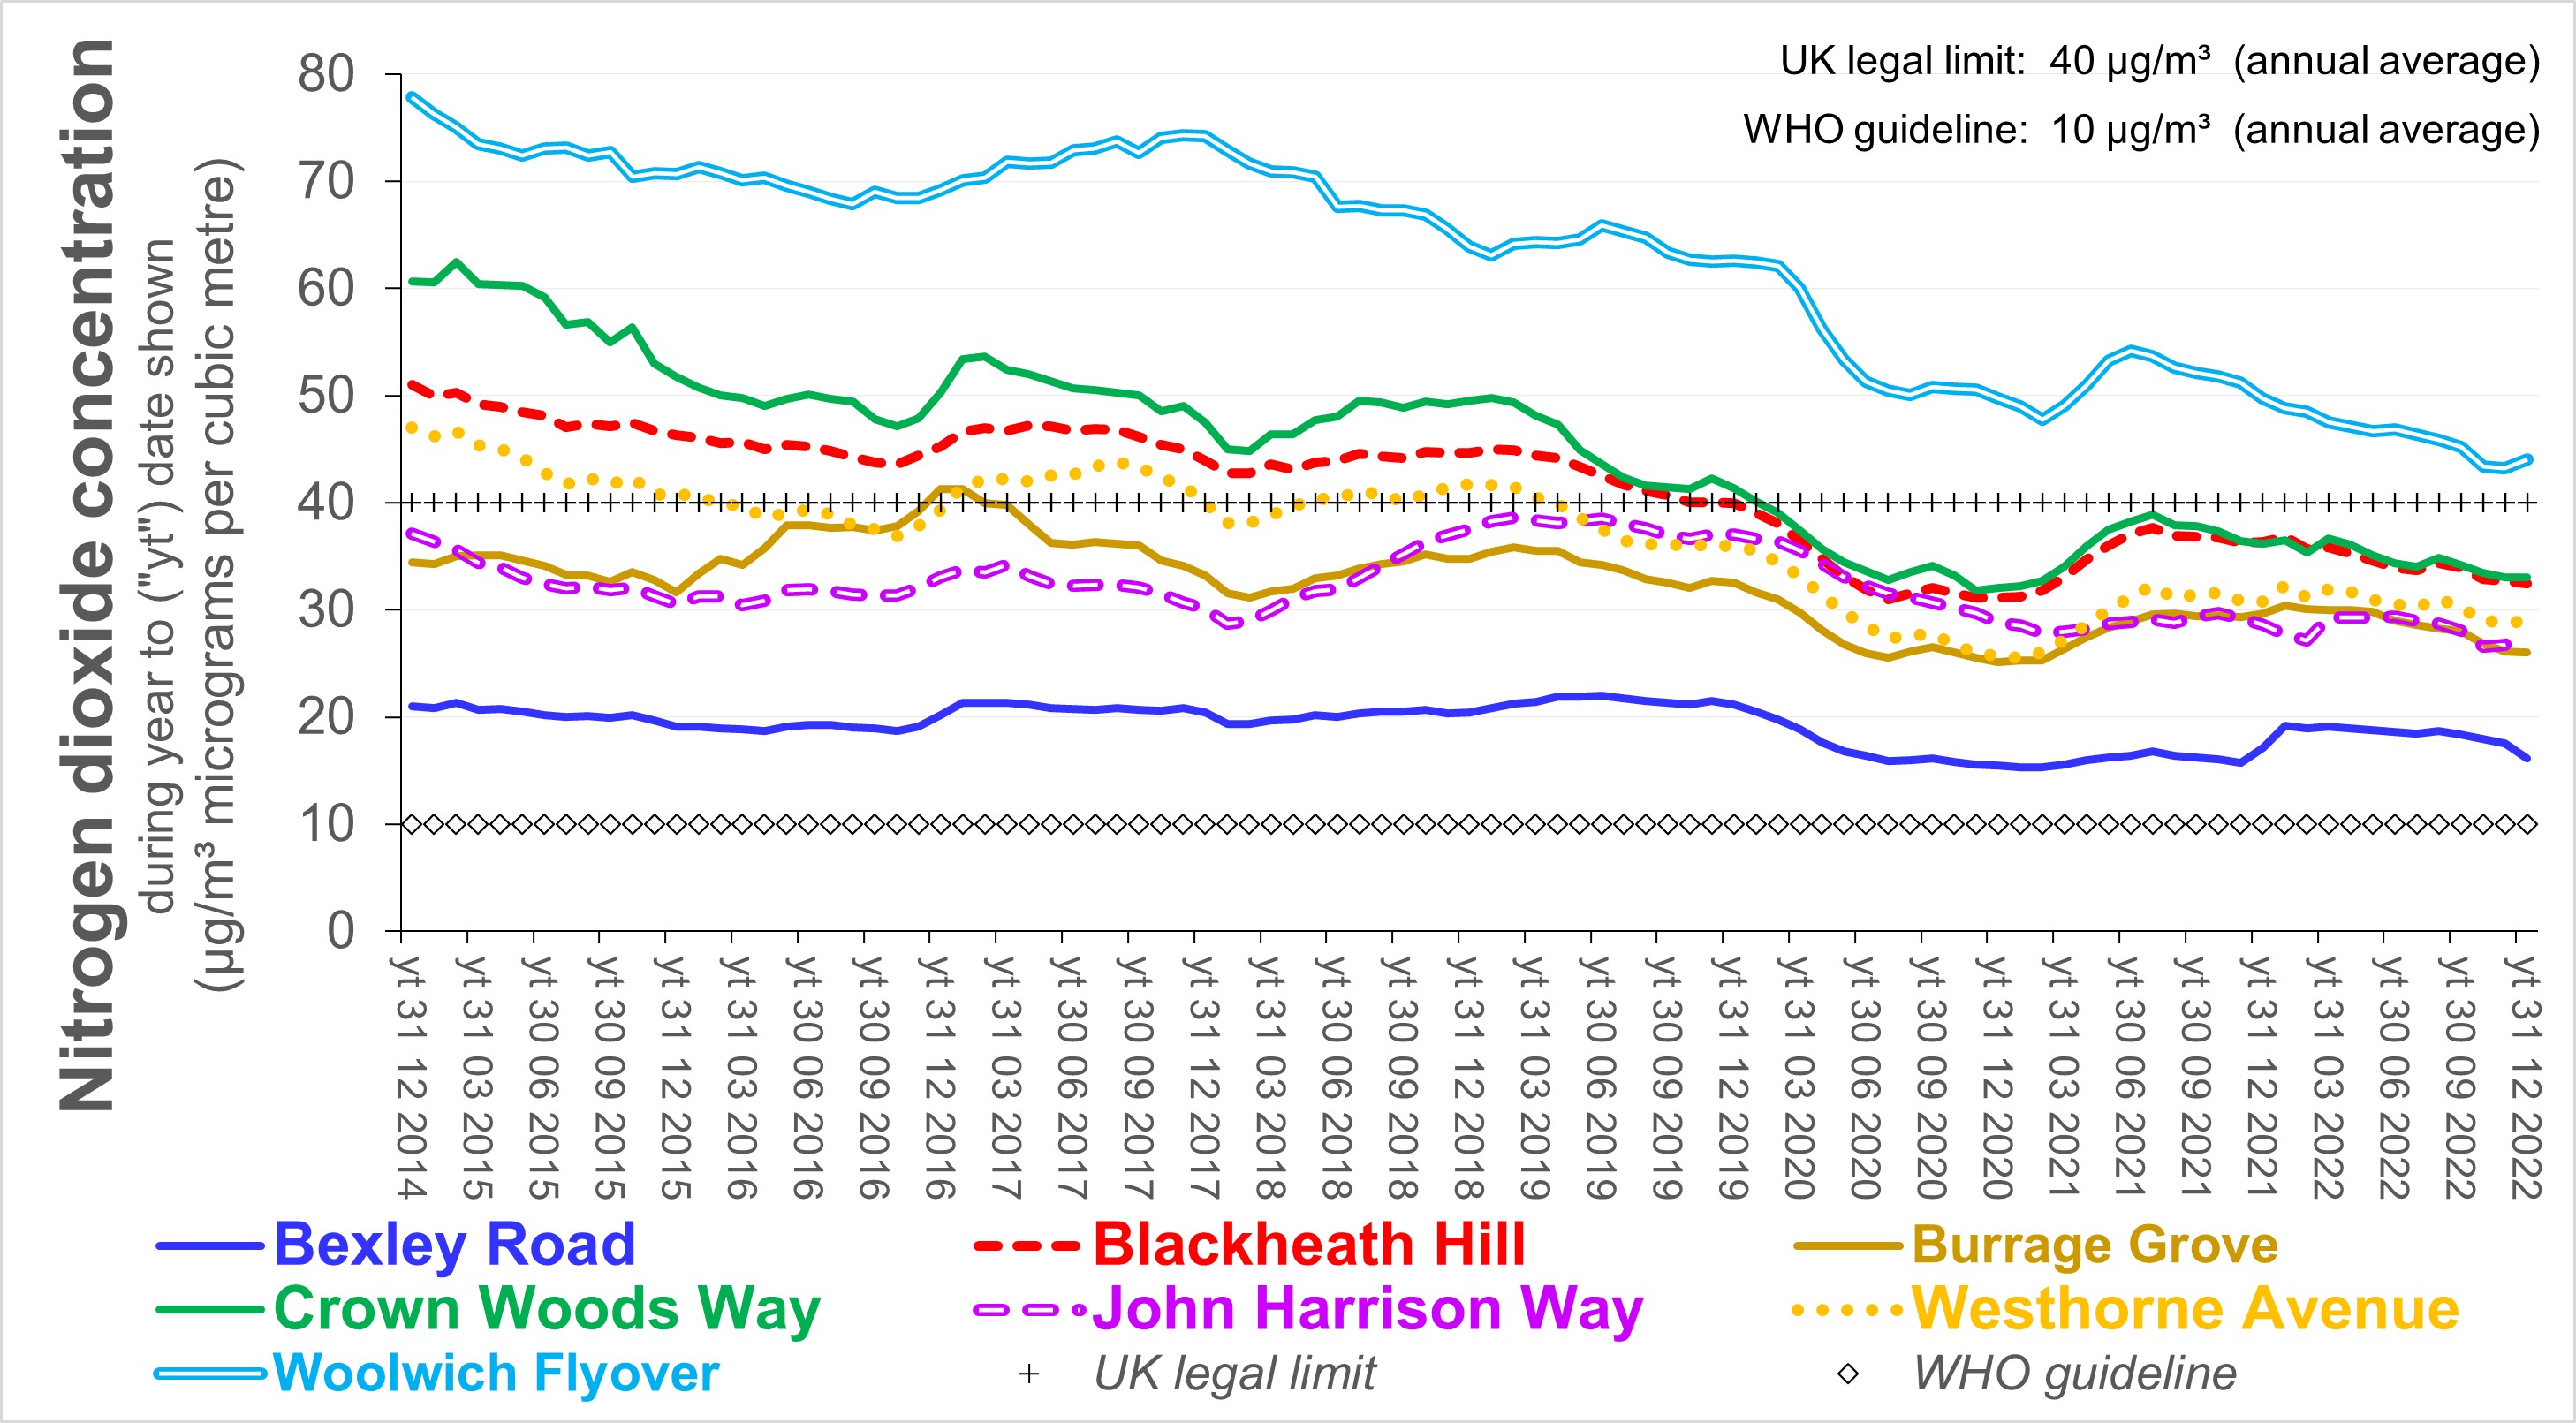
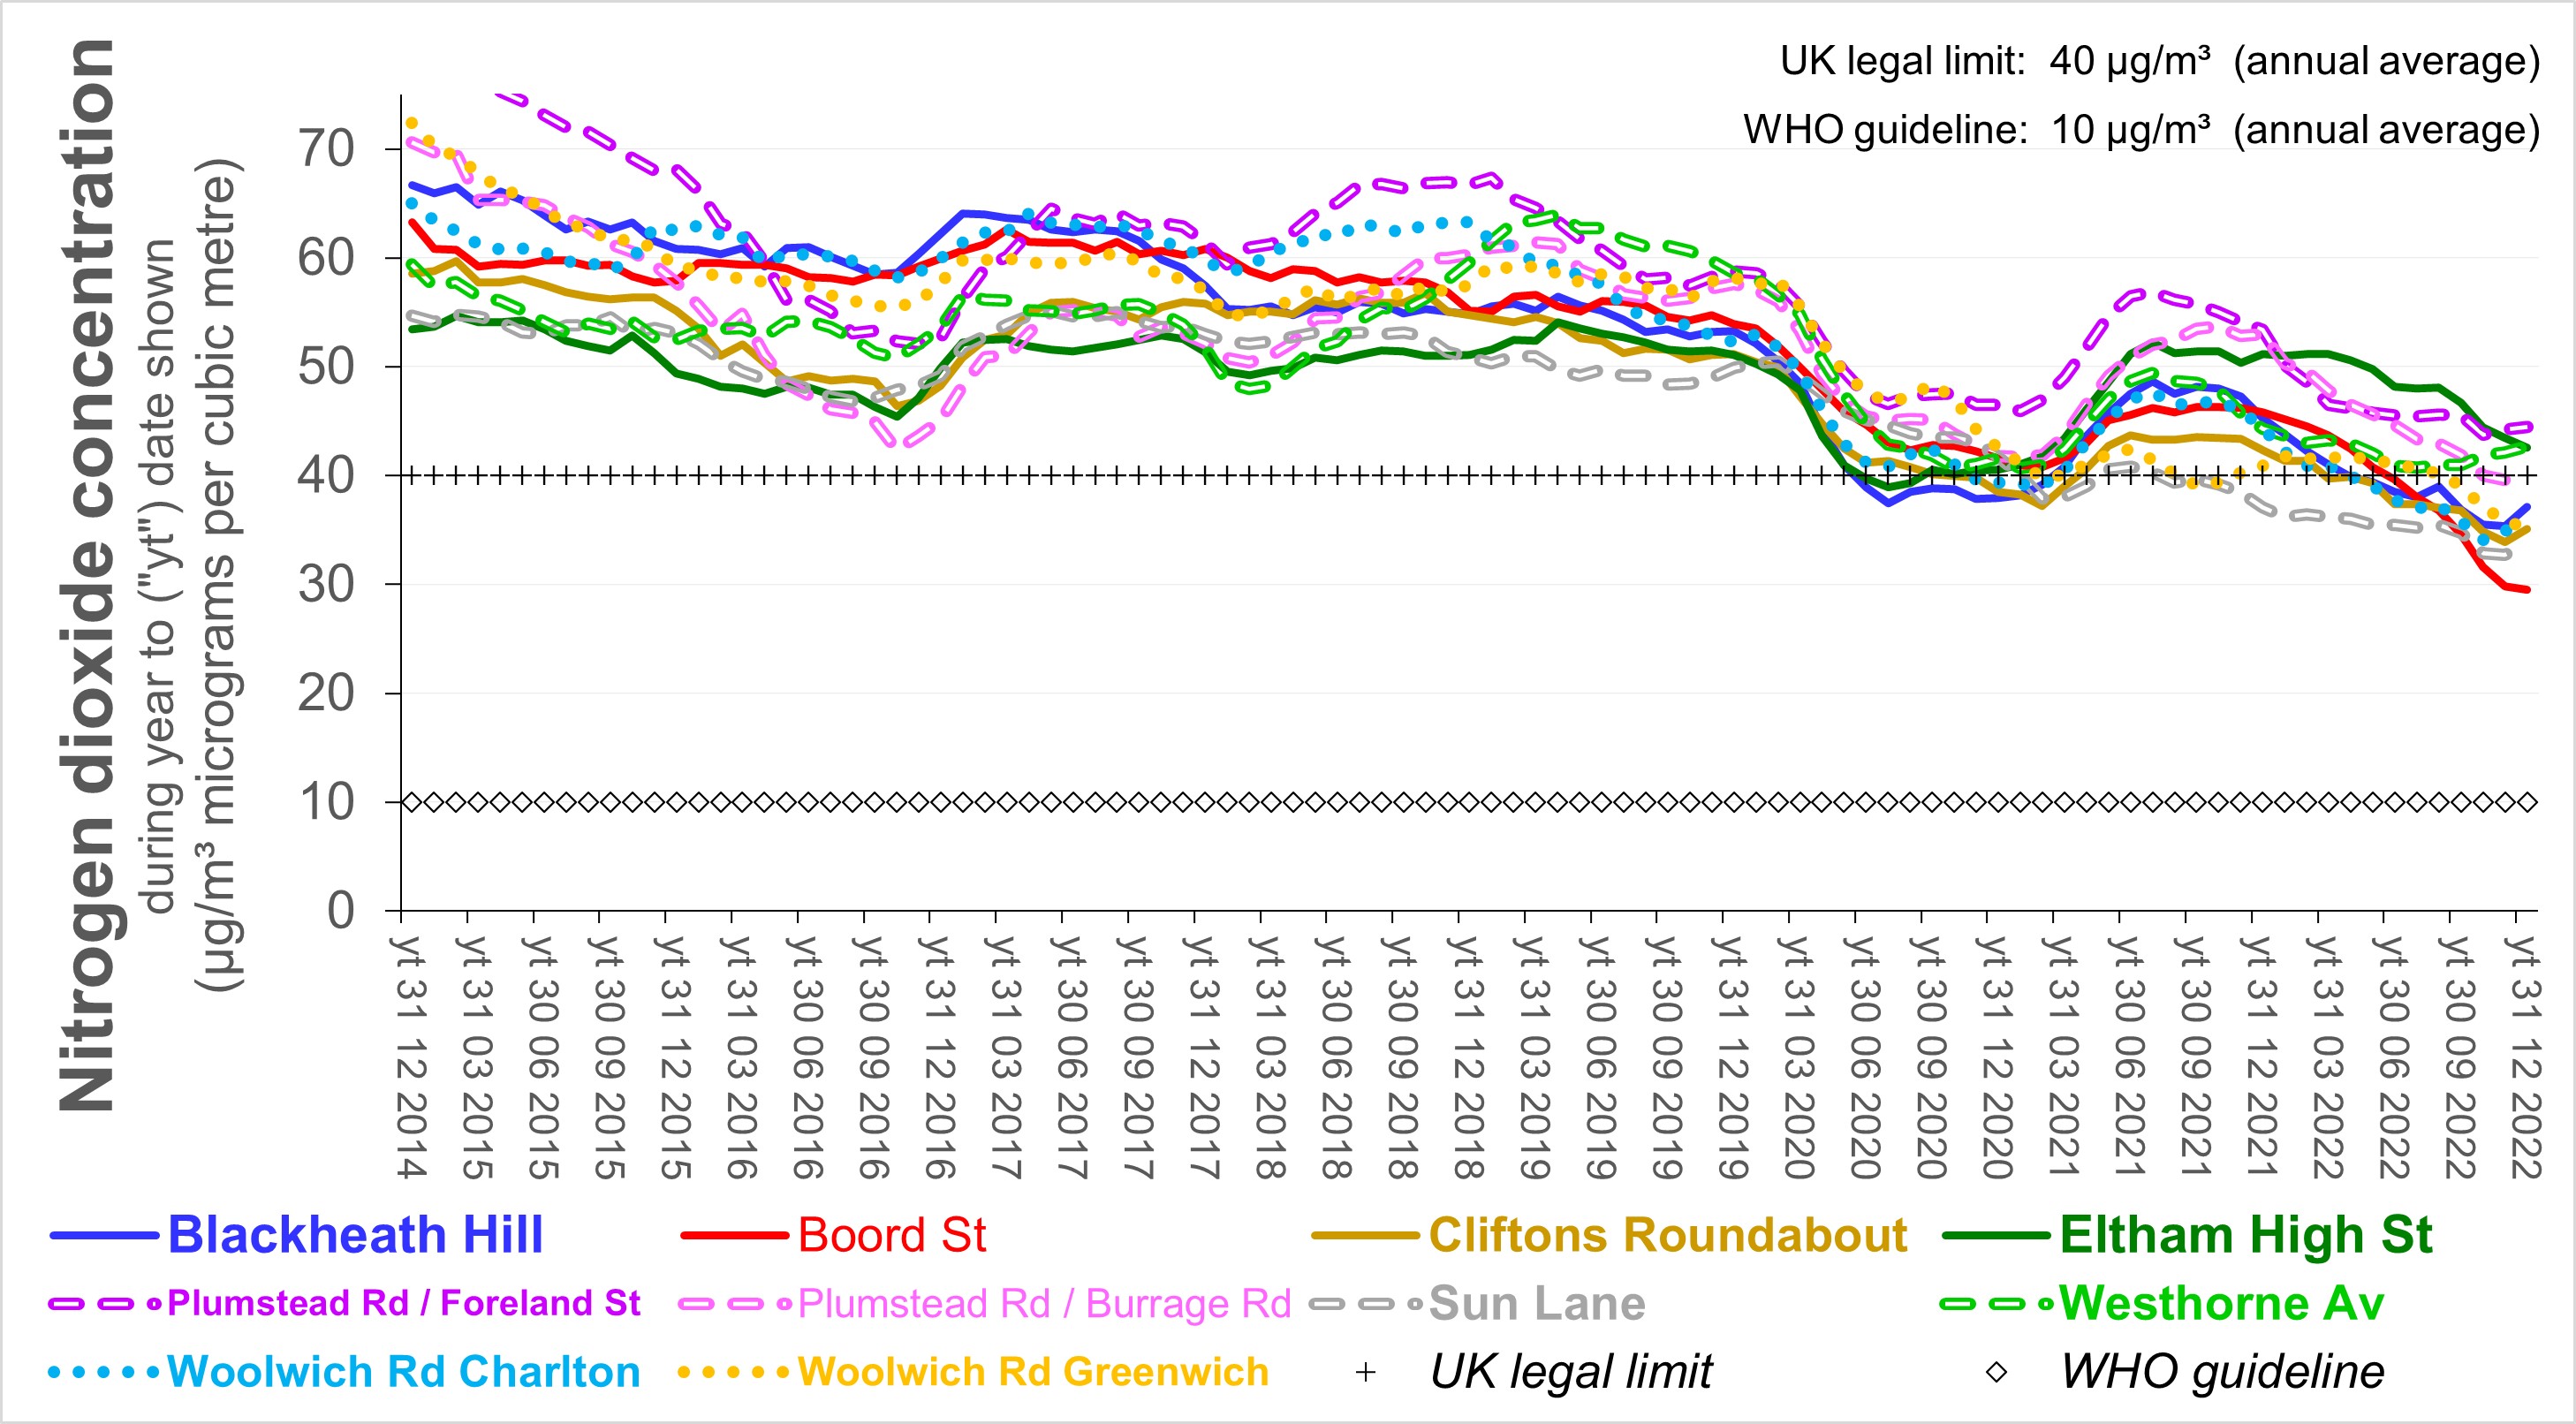
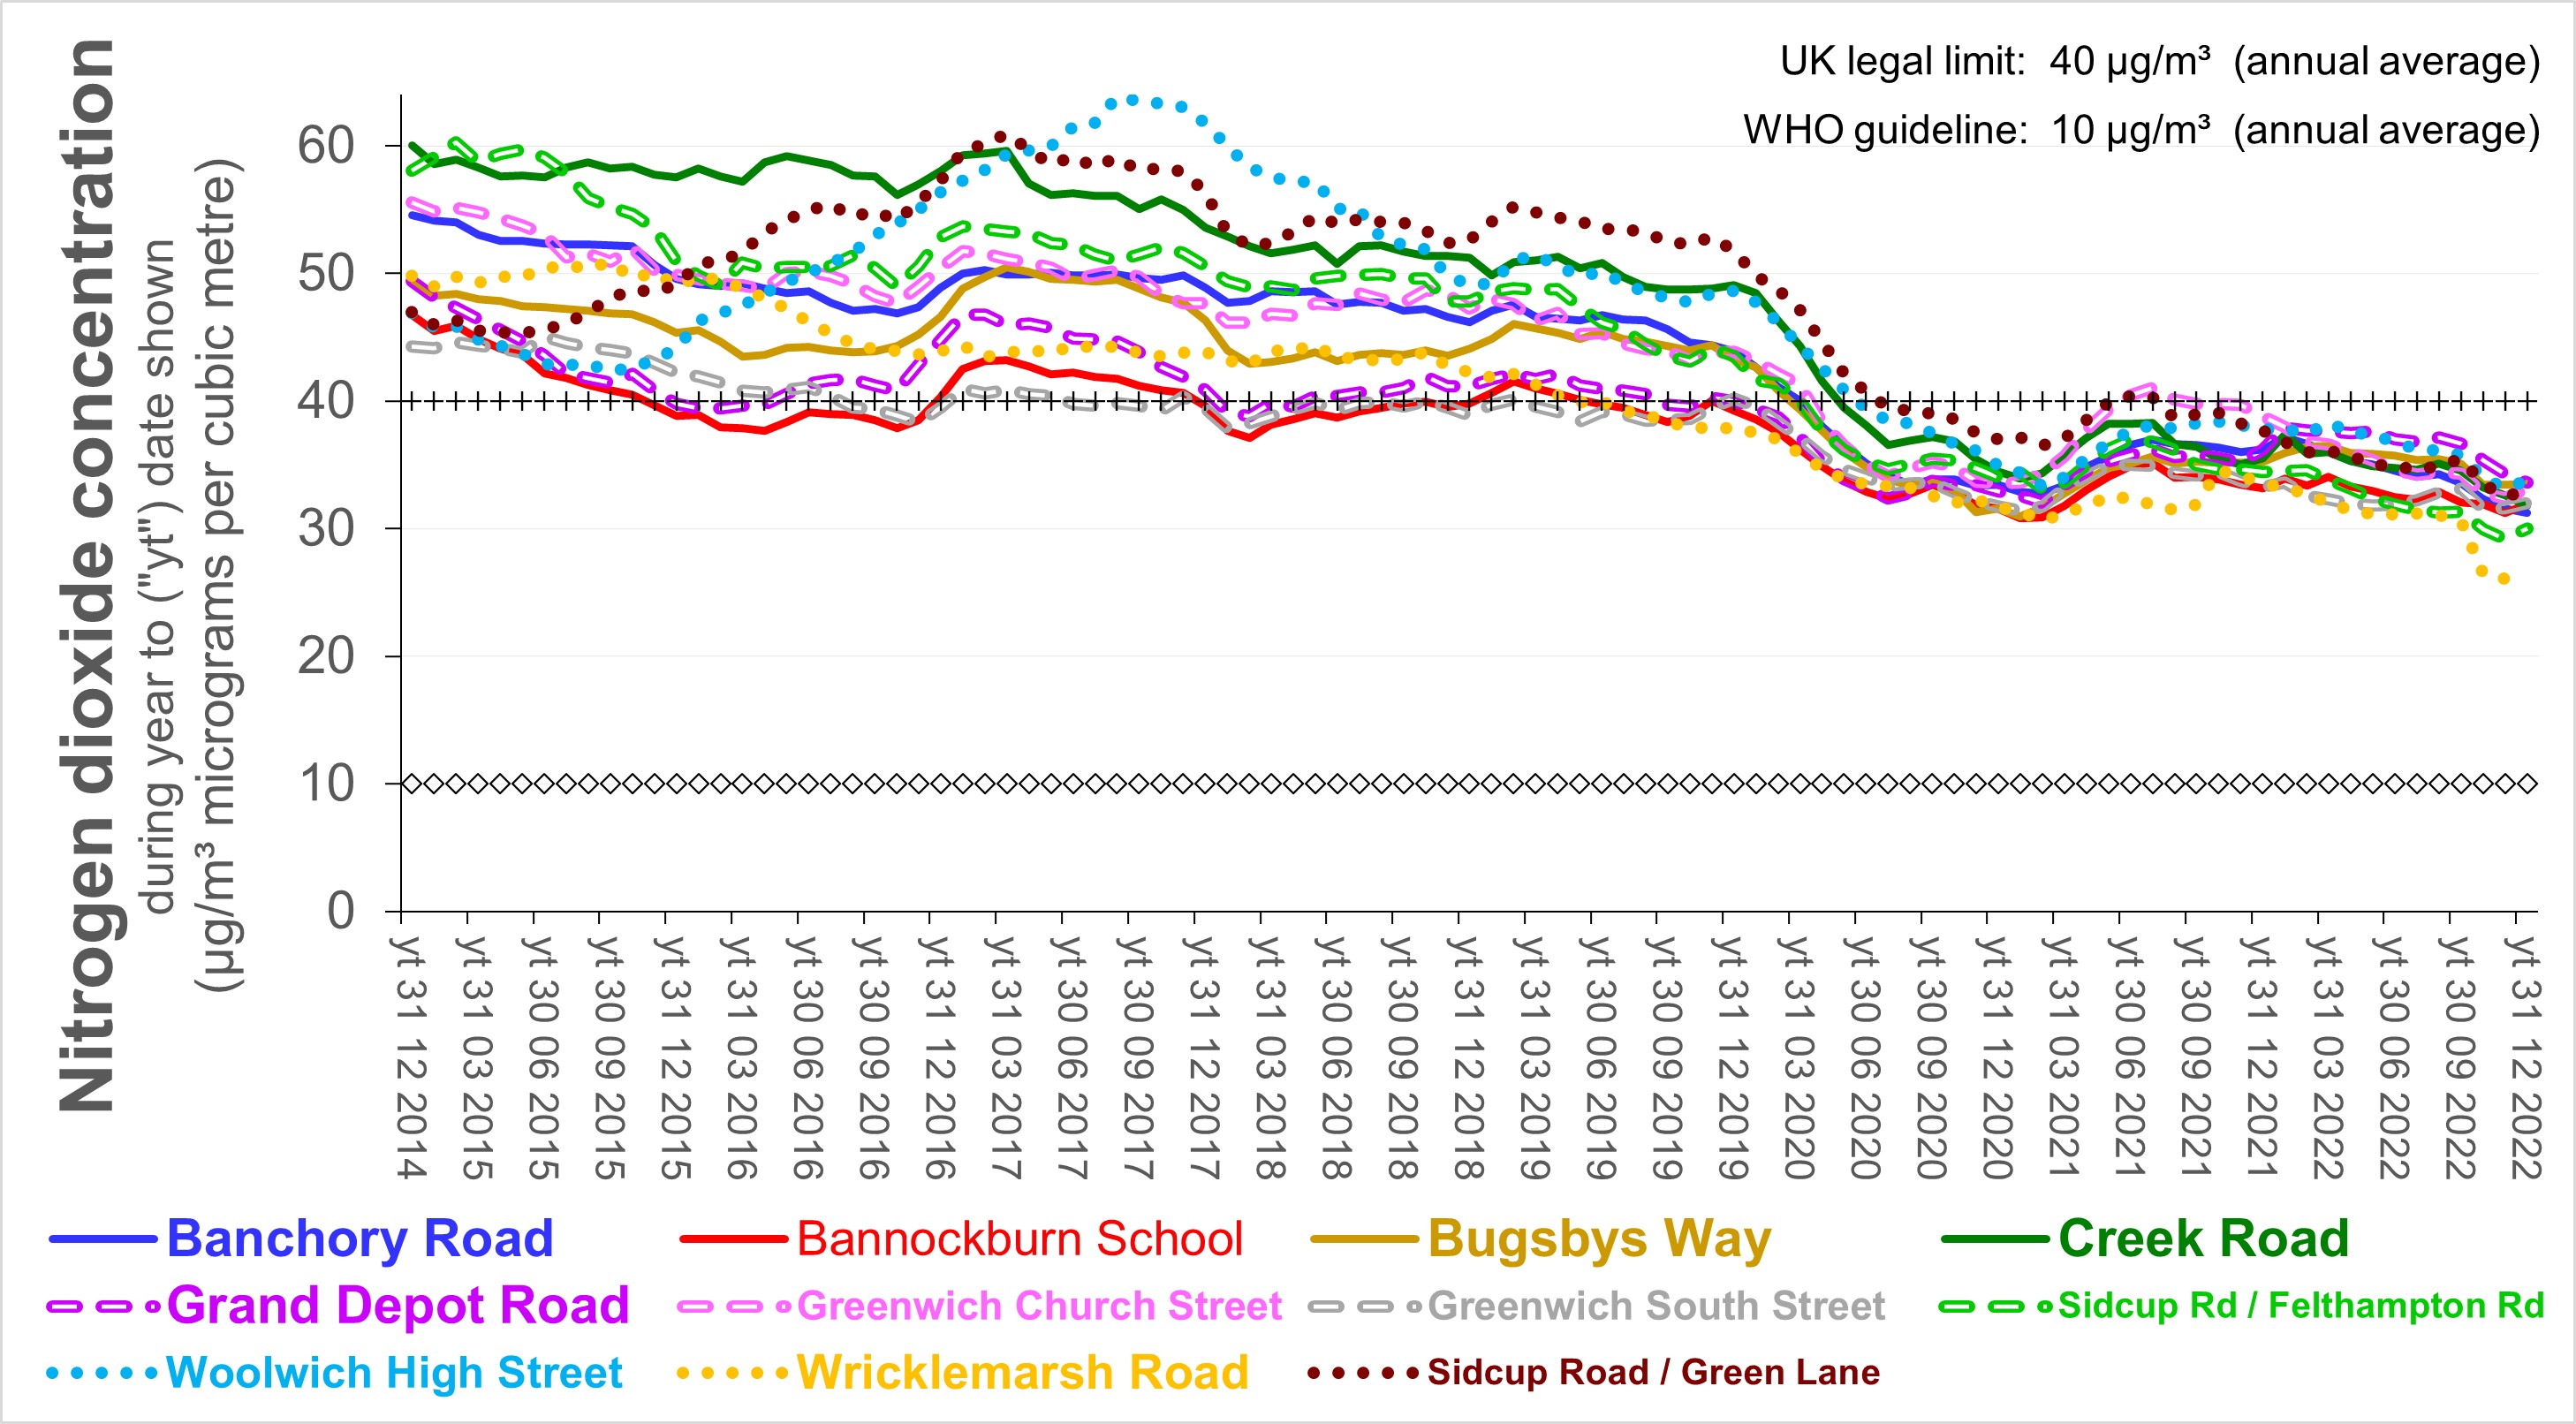
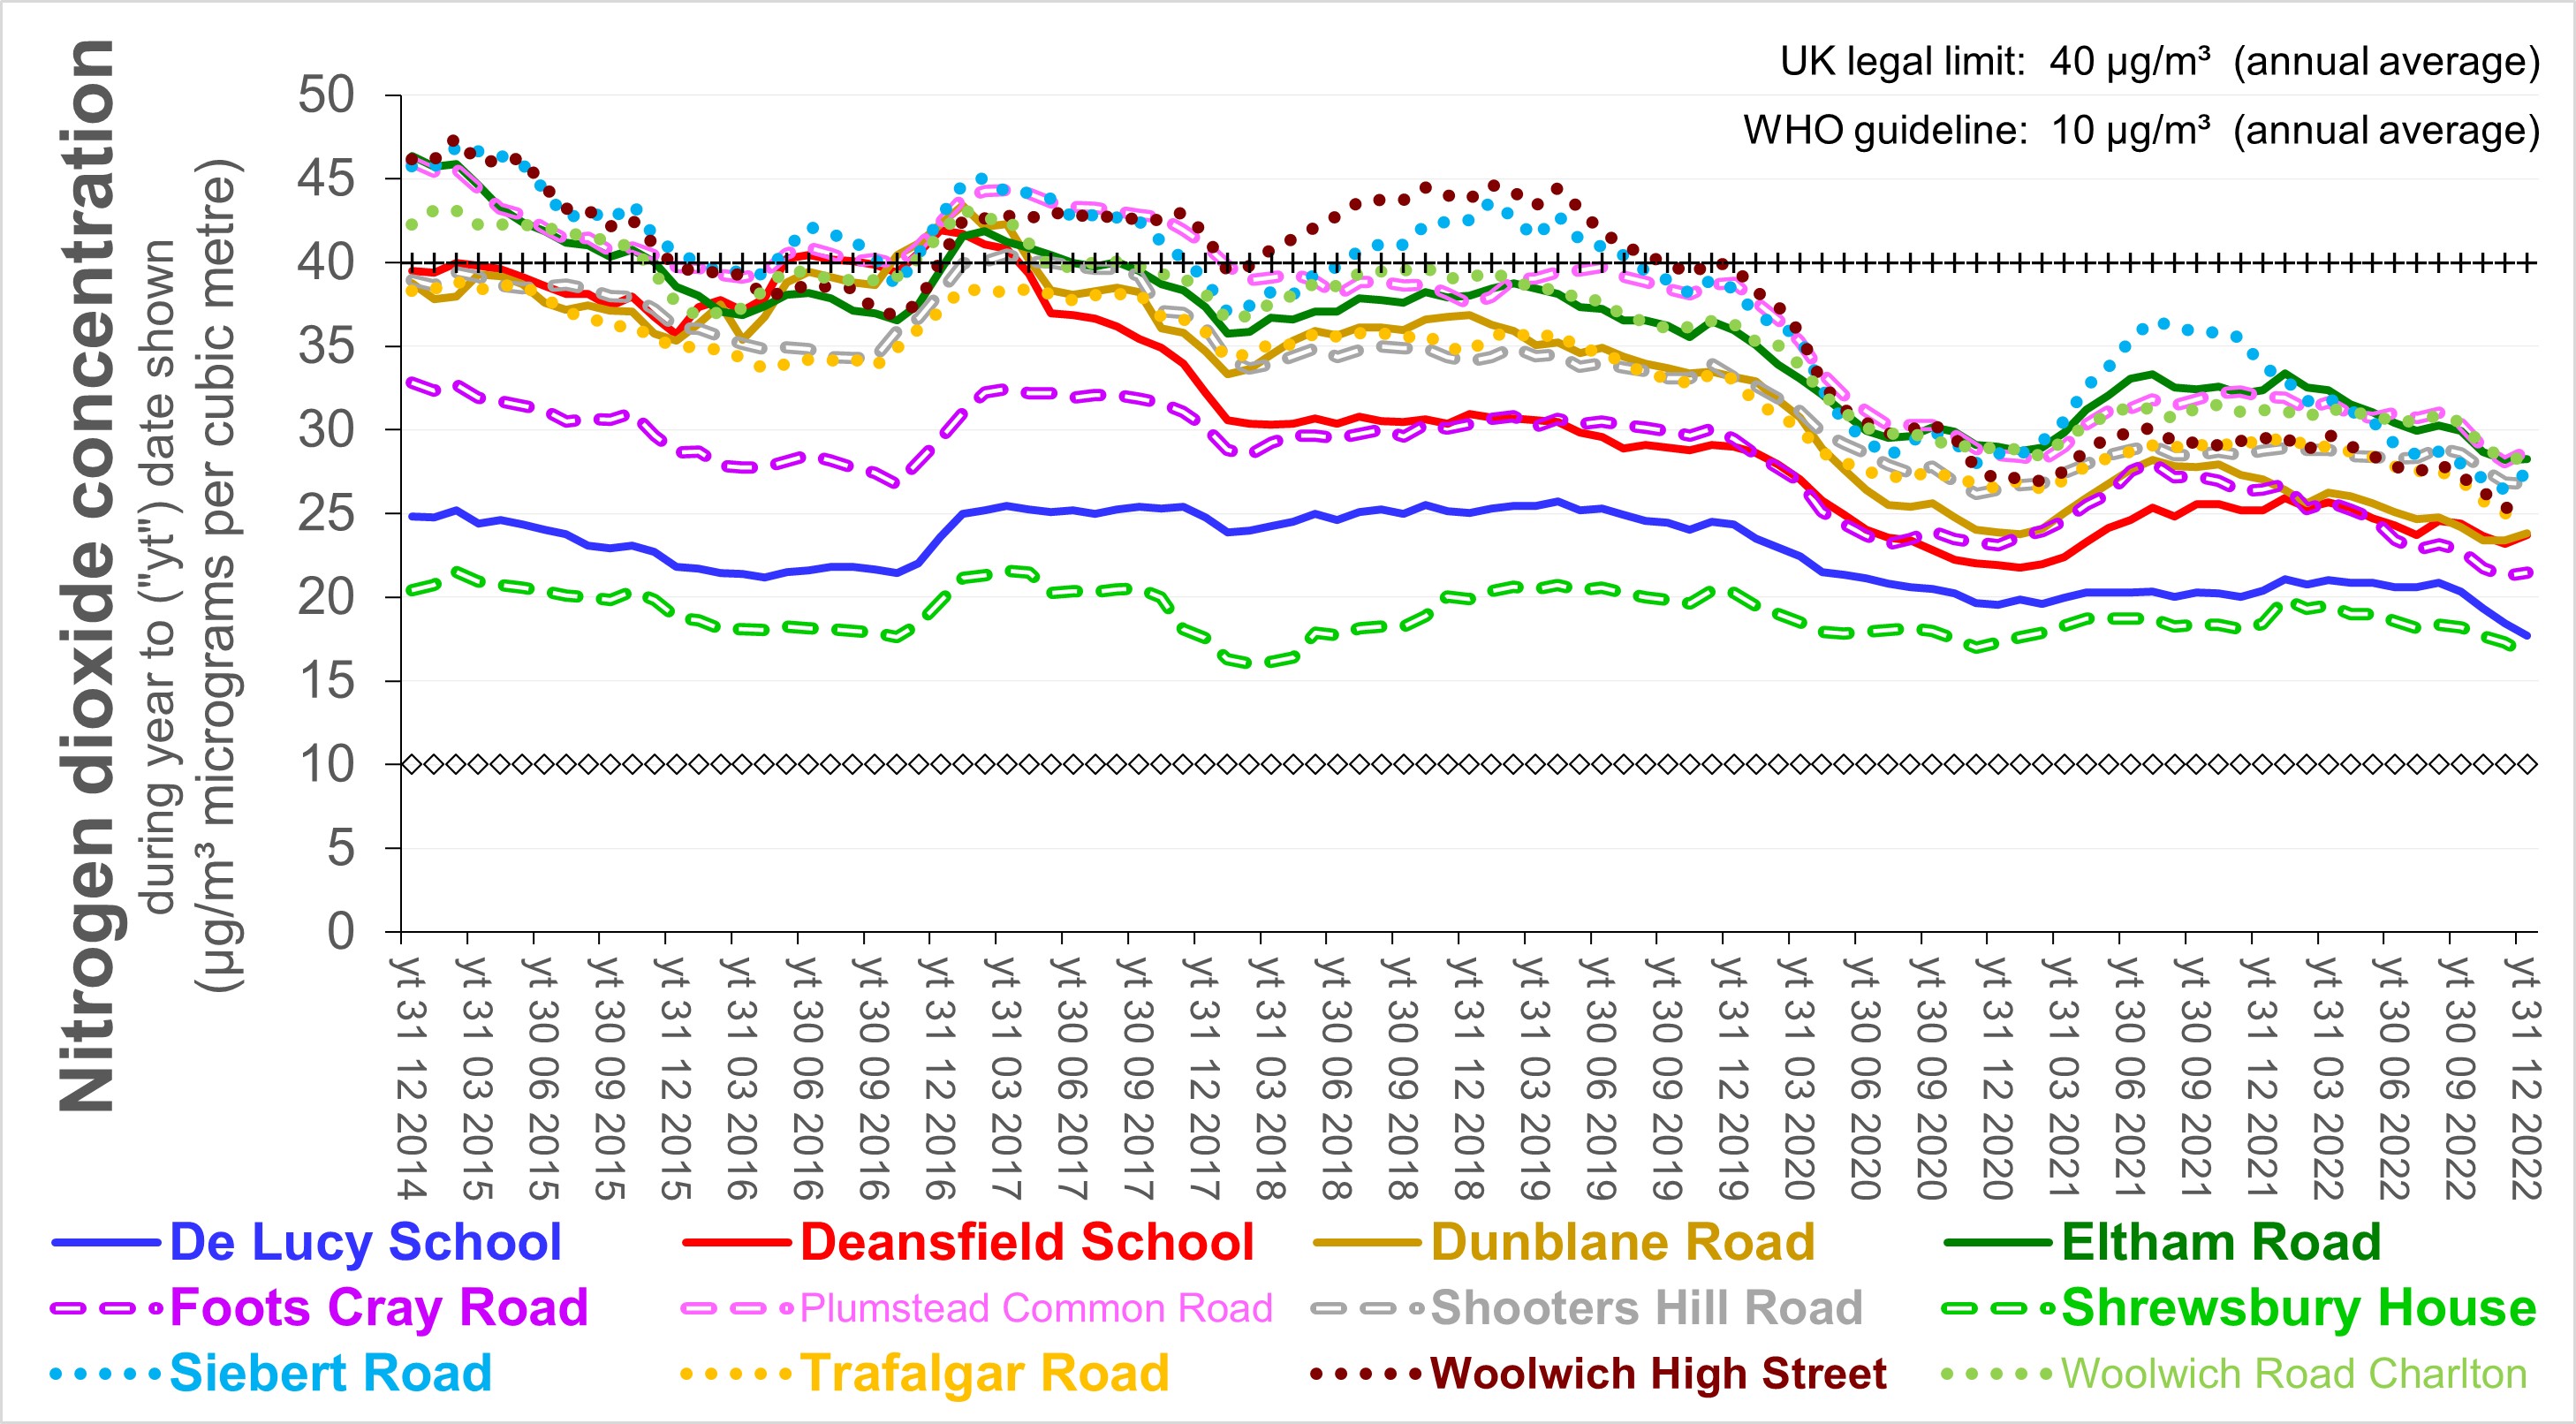
The following four charts illustrate trends in nitrogen dioxide
concentrations as measured since 2014 using diffusion tubes across
Greenwich. Concentrations at all the locations would be
lower than
the current legal limit - once adjusted for bias (see above) -
typically by multiplying by between about 0.7 and 0.9 (as indicated in
the chart above). The data, based on
Royal Borough of Greenwich,
have not been adjustment for bias.
Estimates have been made for March to June 2020 inclusive
(when covid-19 restrictions were in place) and other months if
data is missing or spurious. The uppermost chart refers to
sites where triplicate measurements were made (- see previous
paragraph).
|
|
For further information, please contact: info@airqualitymatters.uk |
| Back |