|
AIR QUALITY MATTERS |
|||
|
City of London |
|||
|
Low-hanging fruit gone? Resting
on laurels? Promoting CO2?
|
|||
|
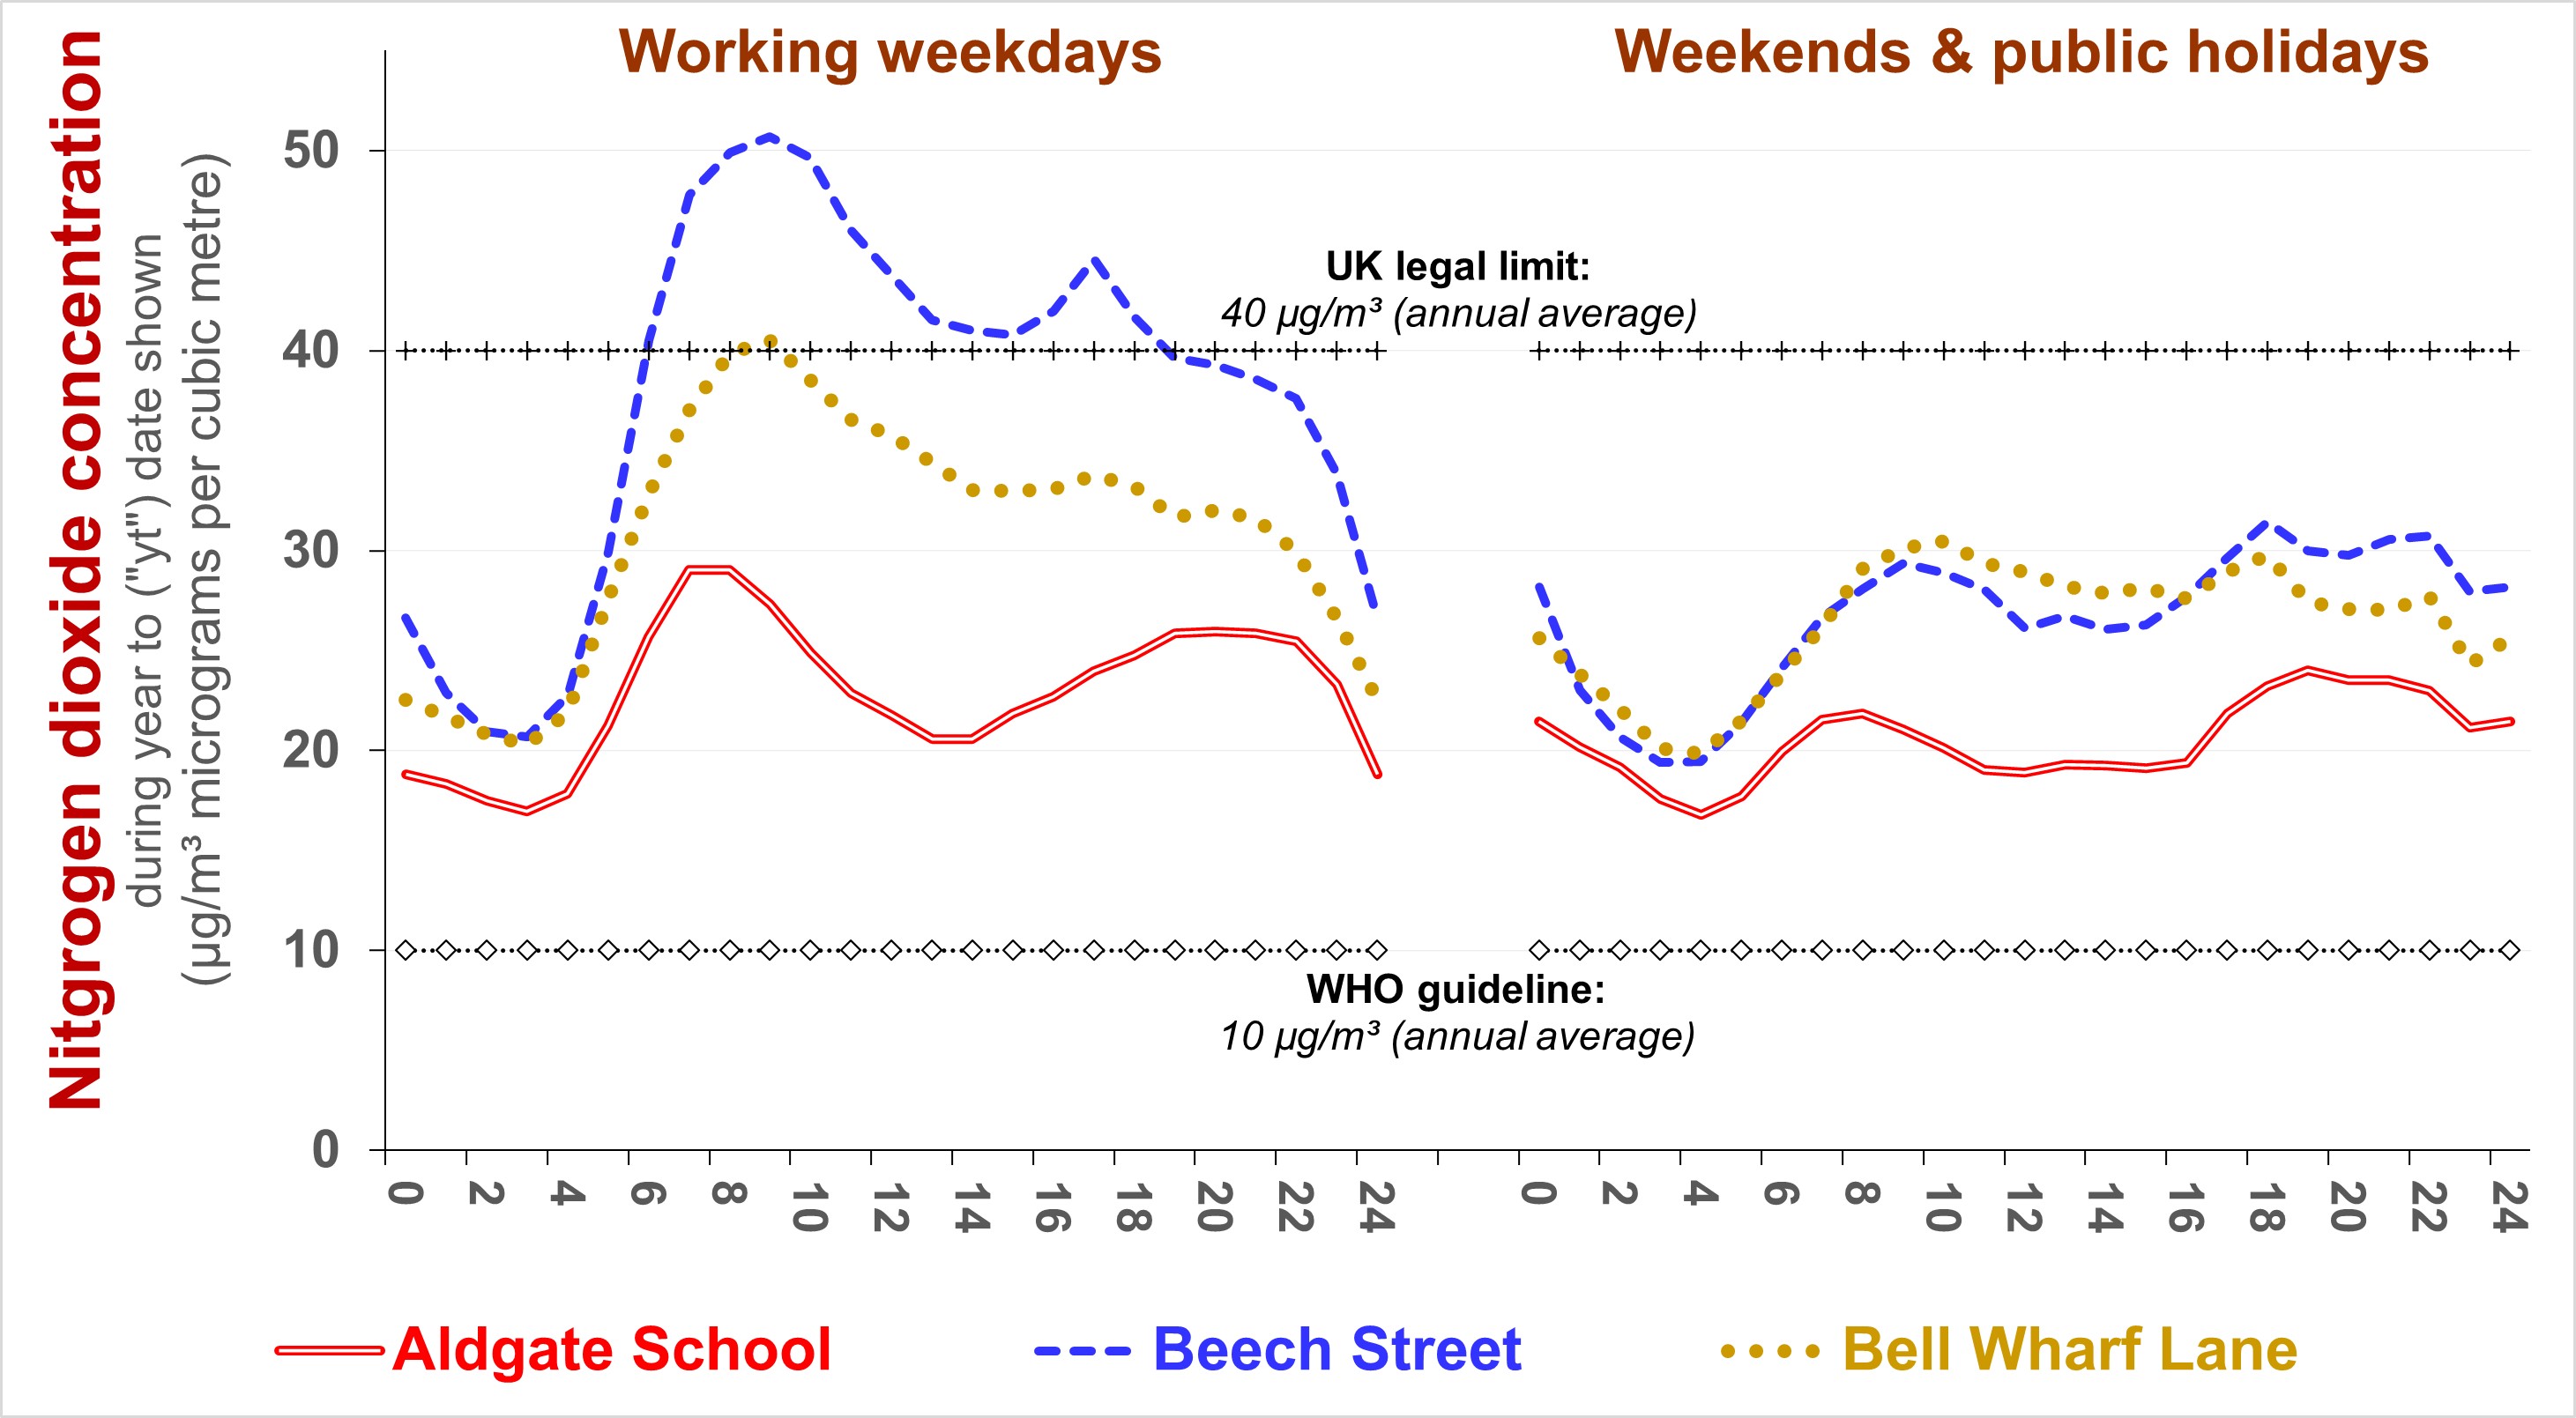
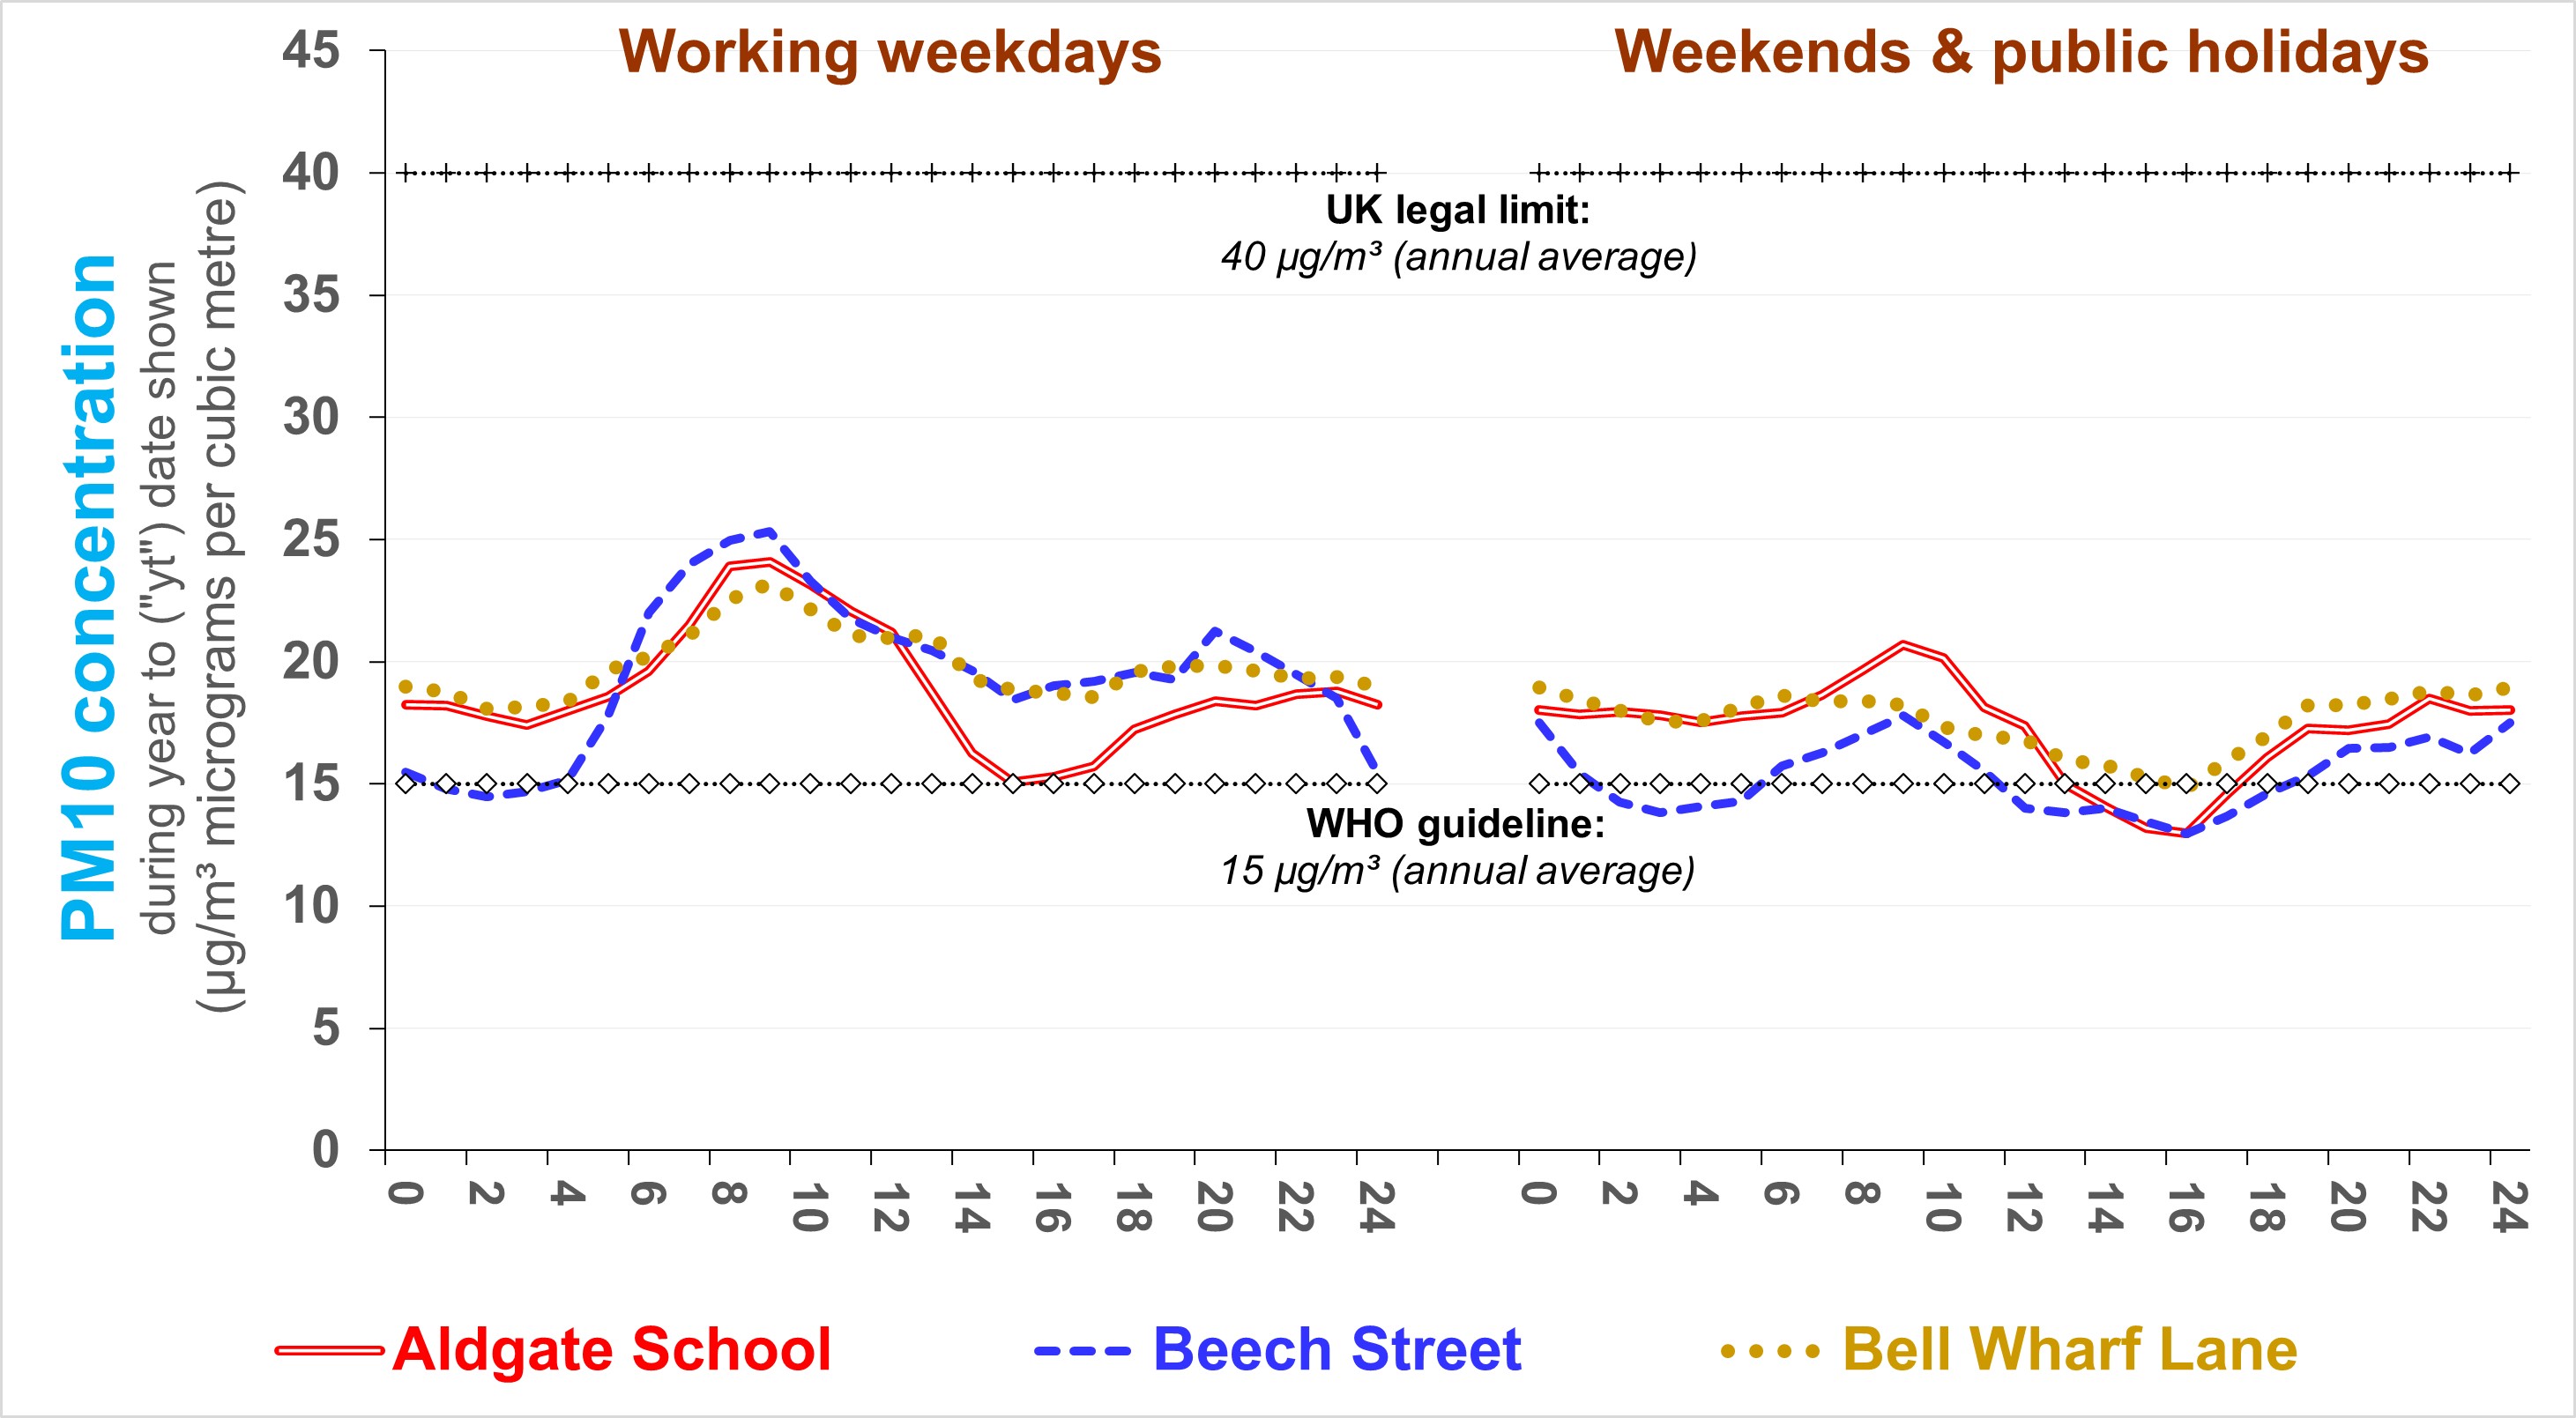
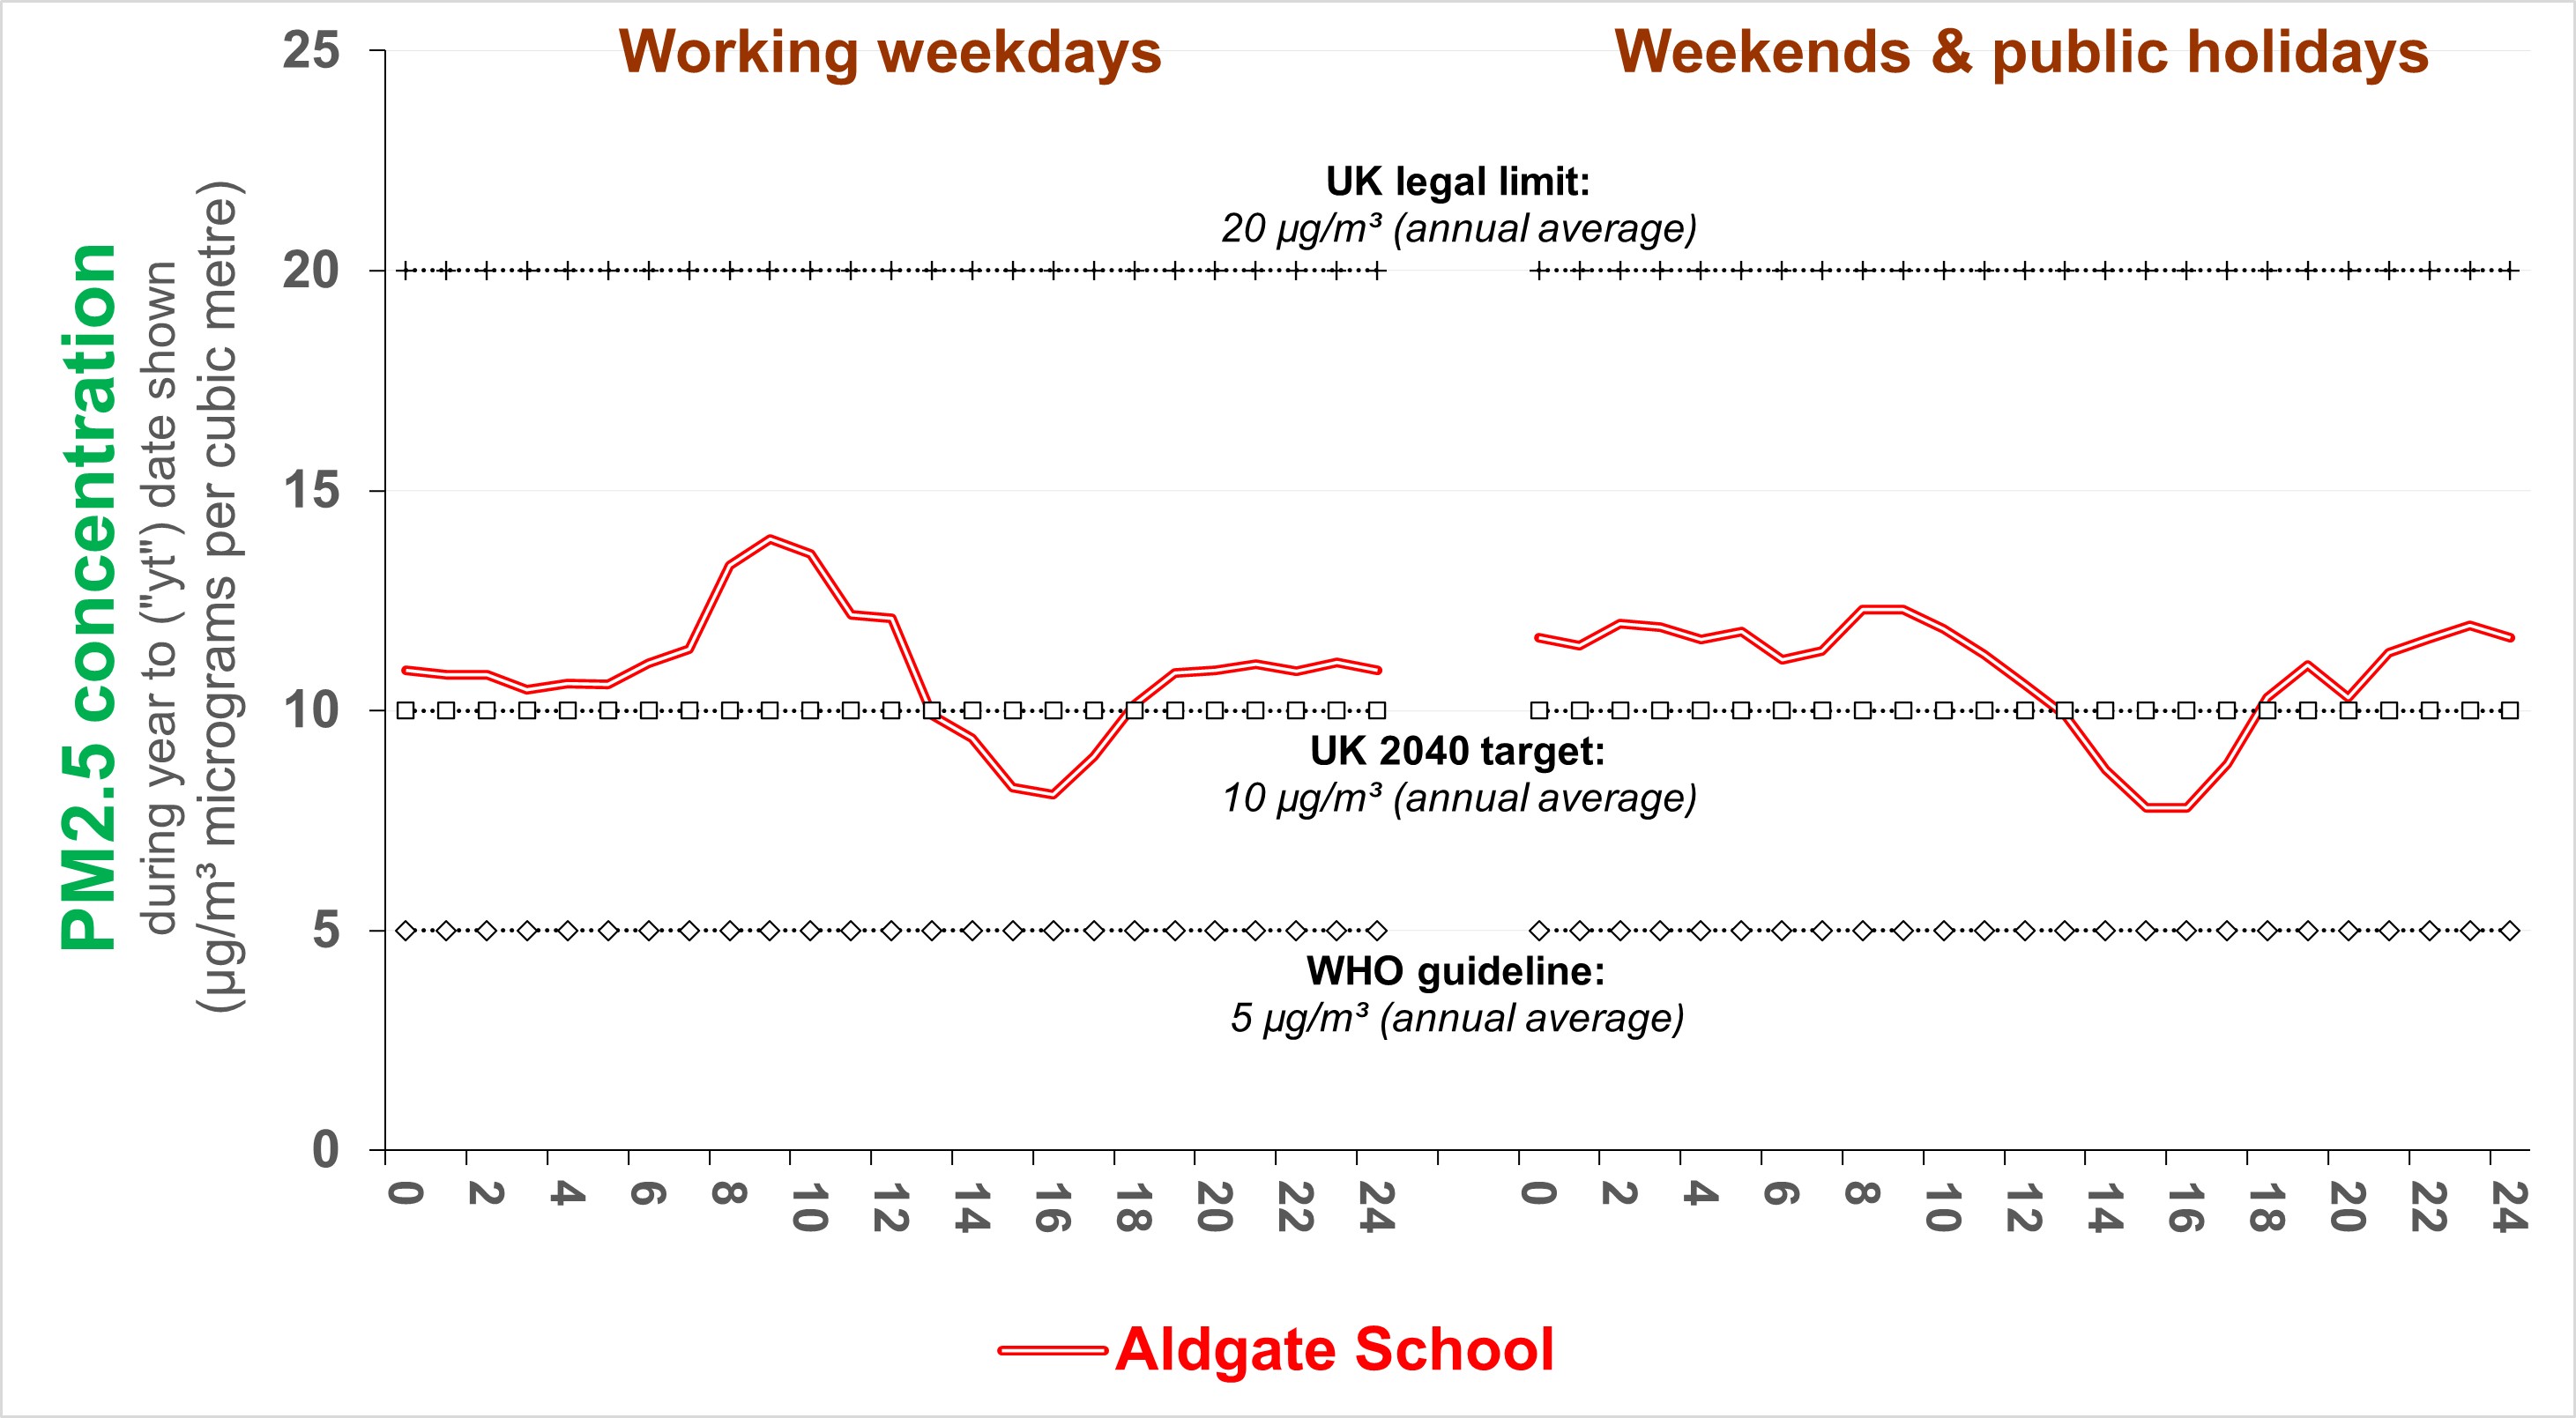
Reference monitors
The following three charts illustrate how
concentrations of NO2, PM10 and
PM2.5 - at each hour of the day - varied on average during the 12
months 01 October 2024 to 30 September 2025. The charts
contrast working weekdays with weekends & public hoildays.
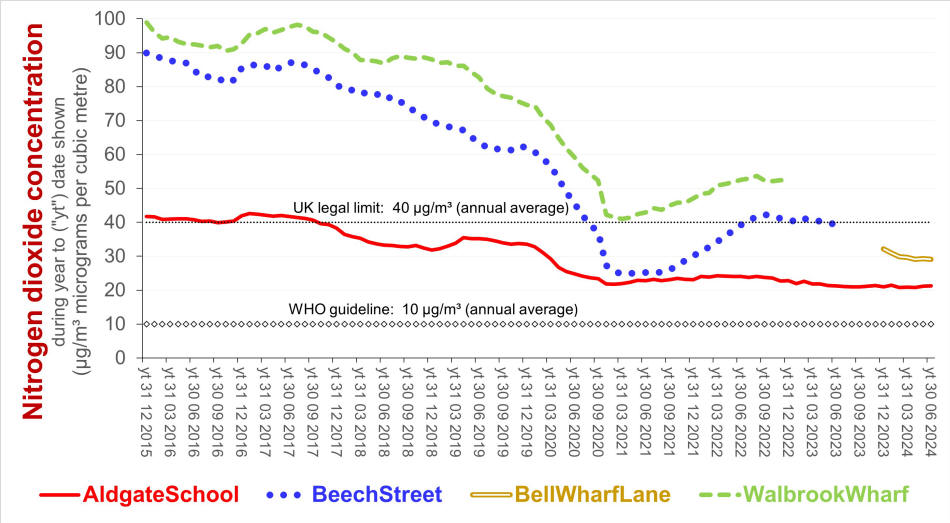
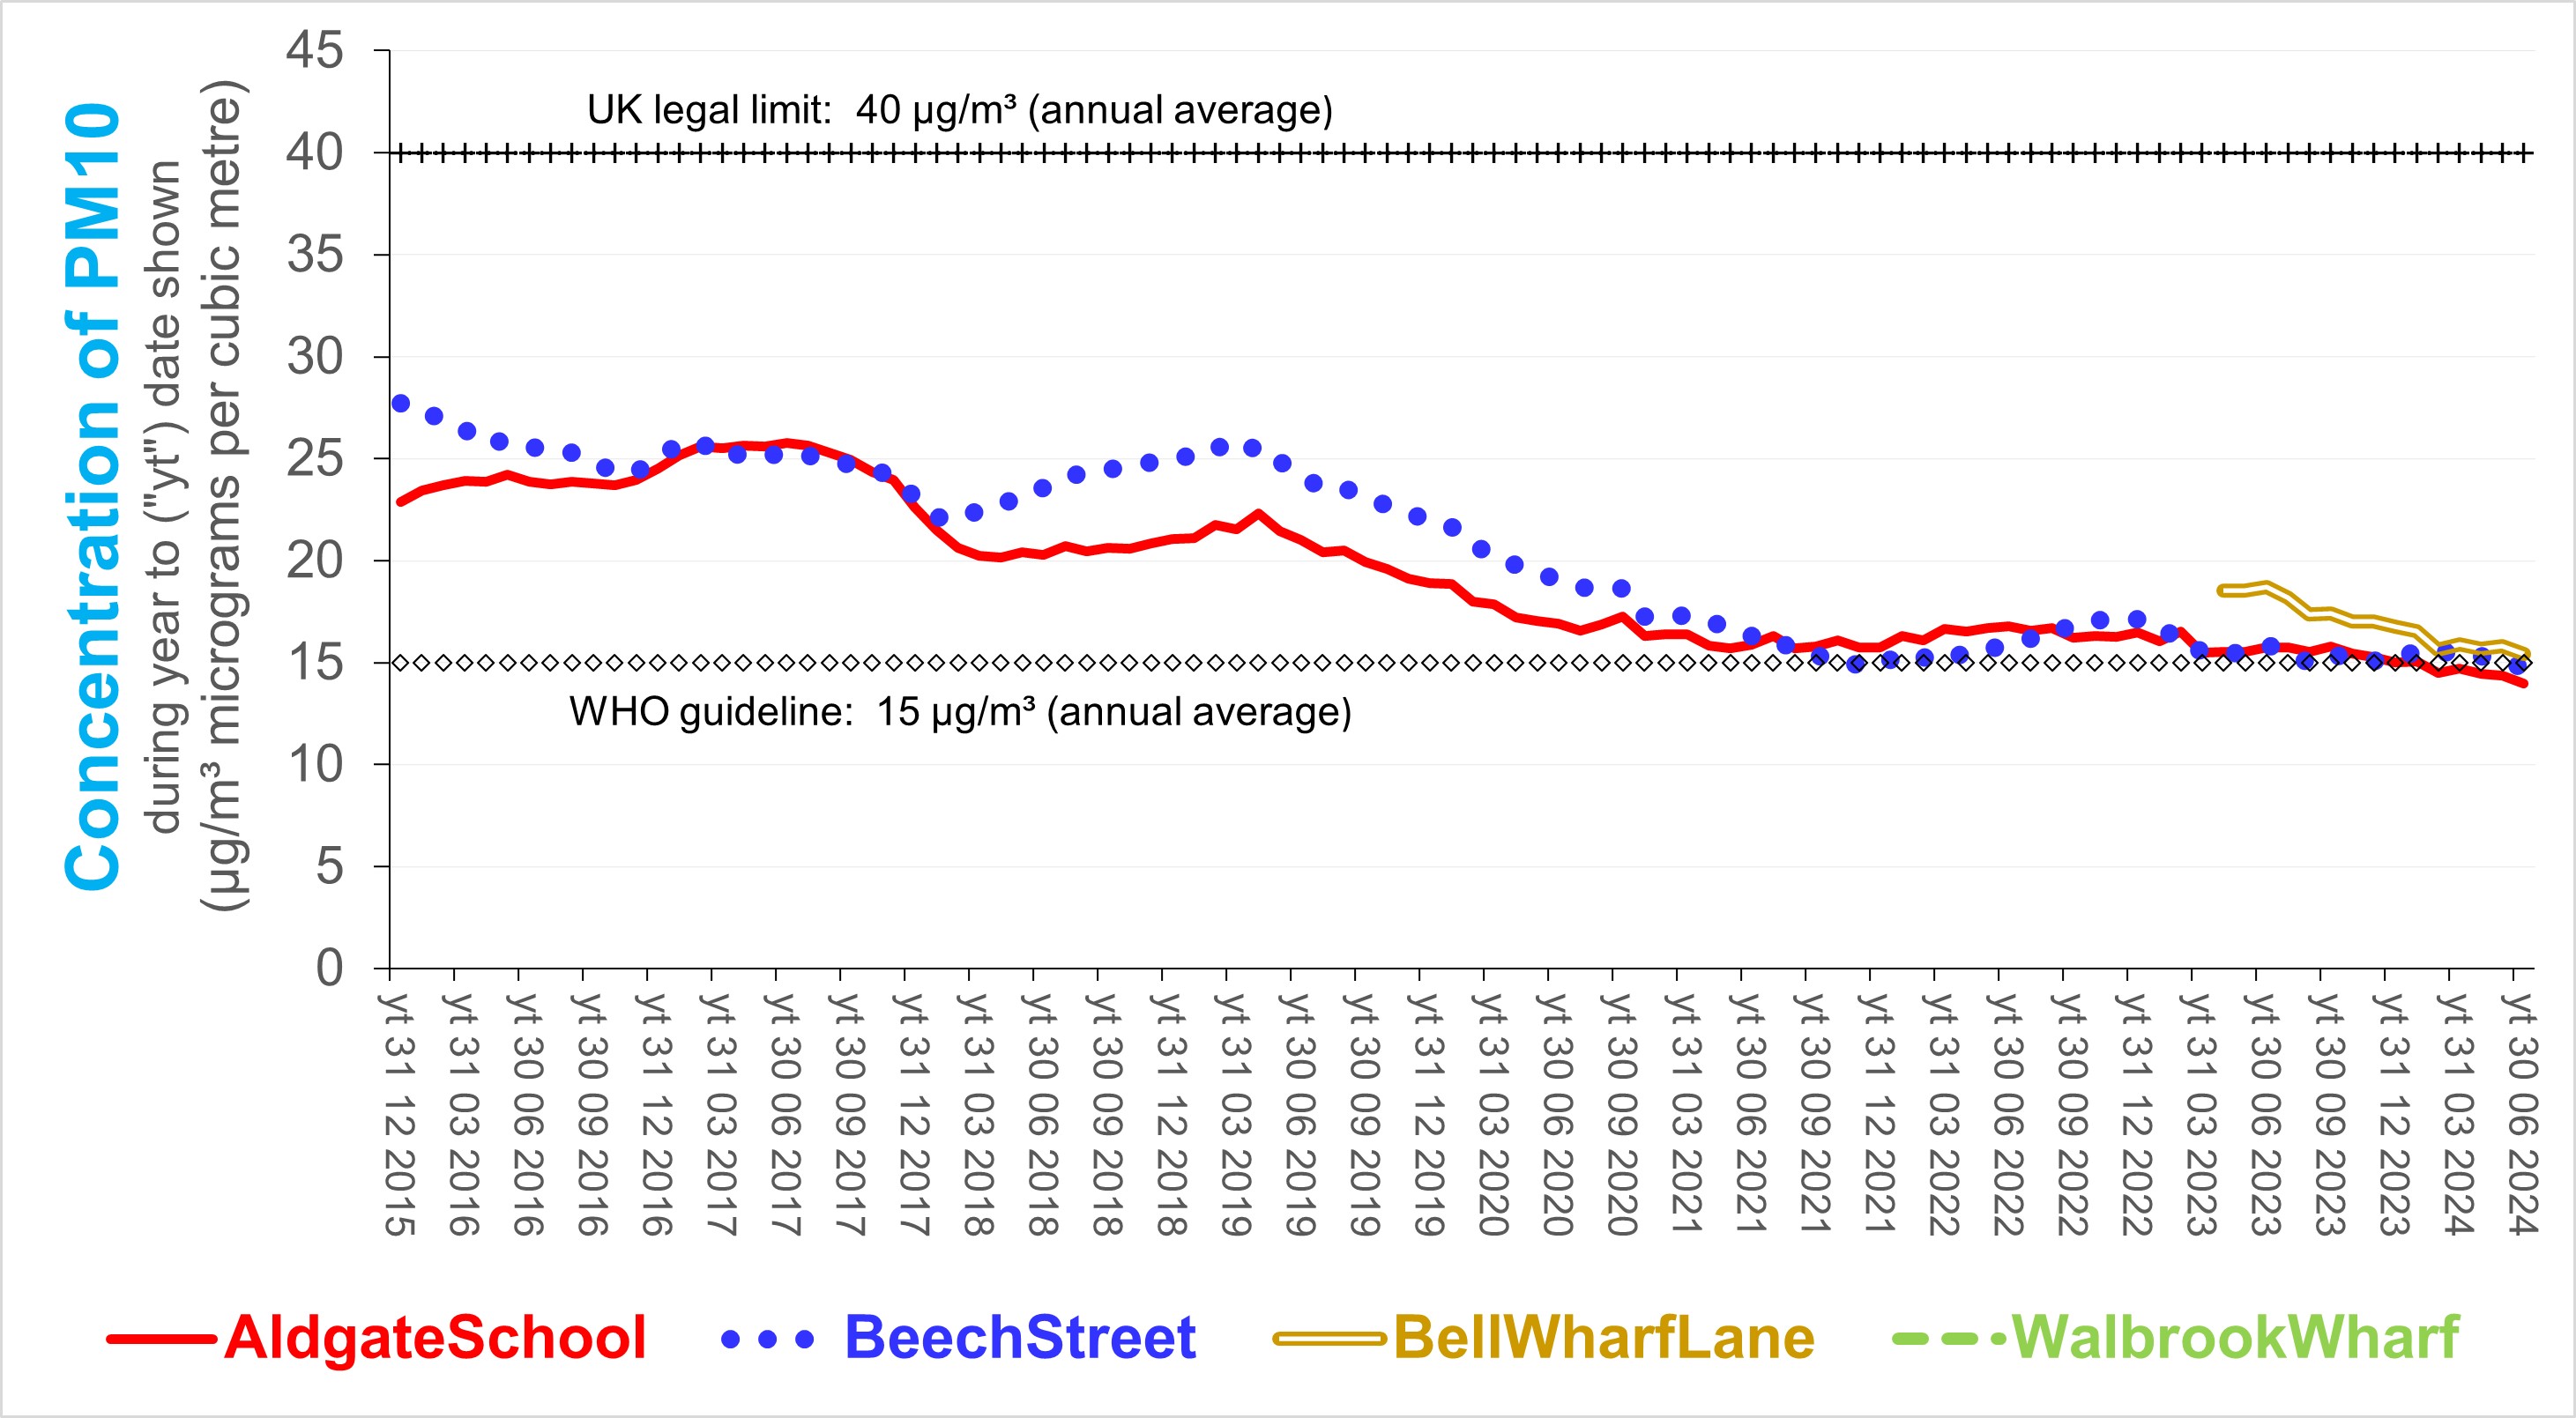
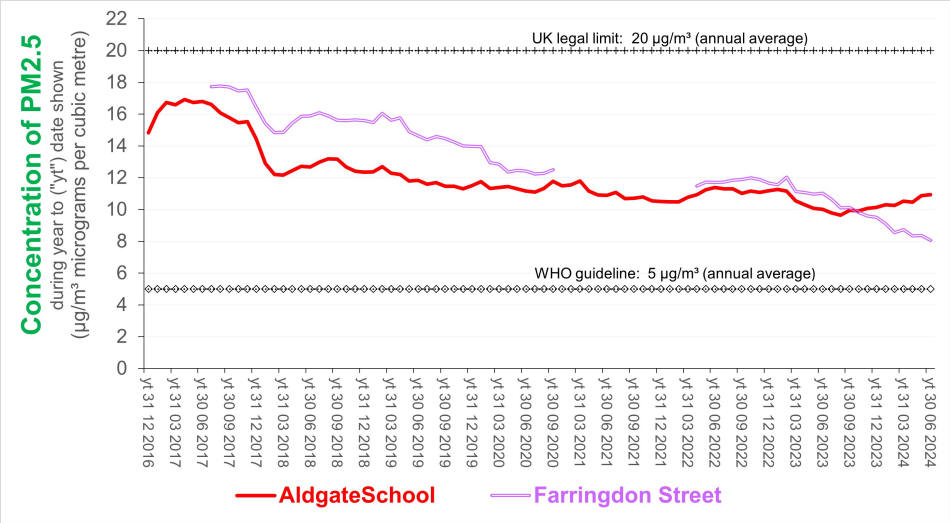
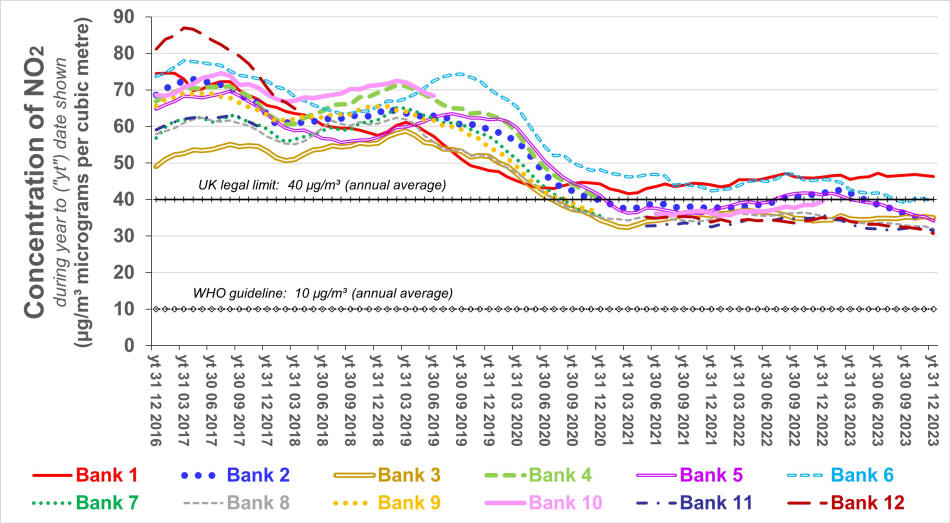
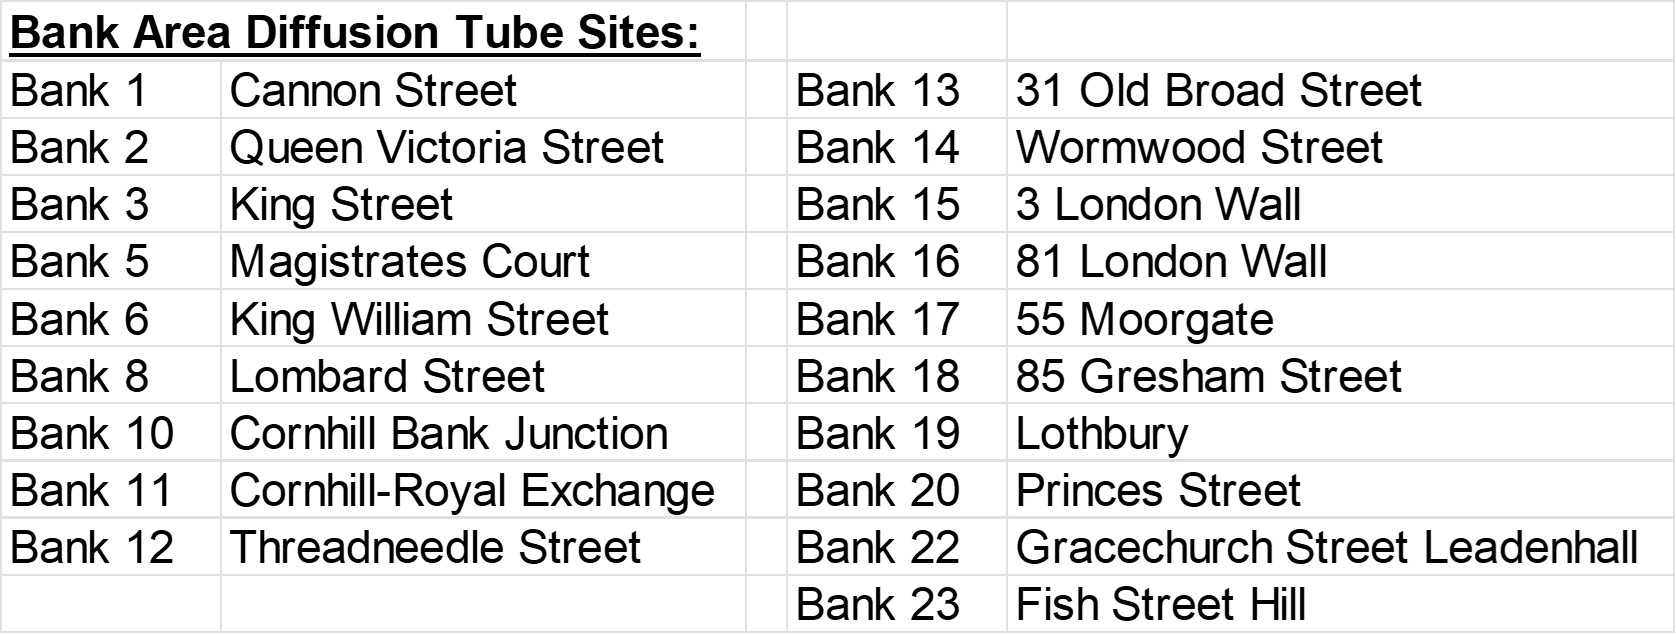
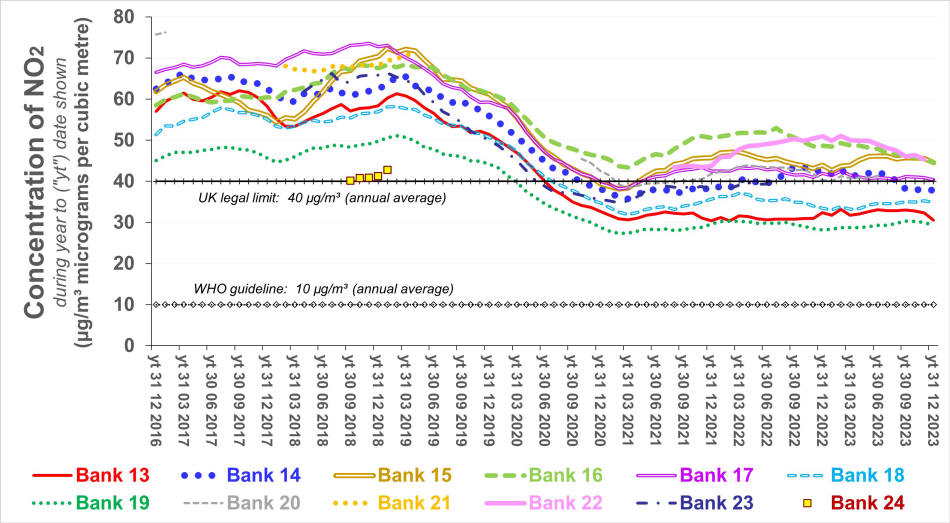
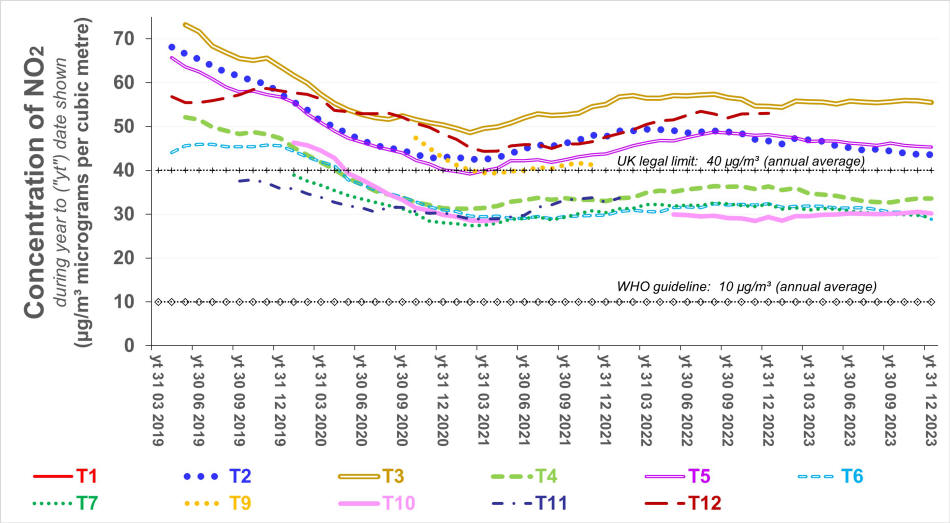
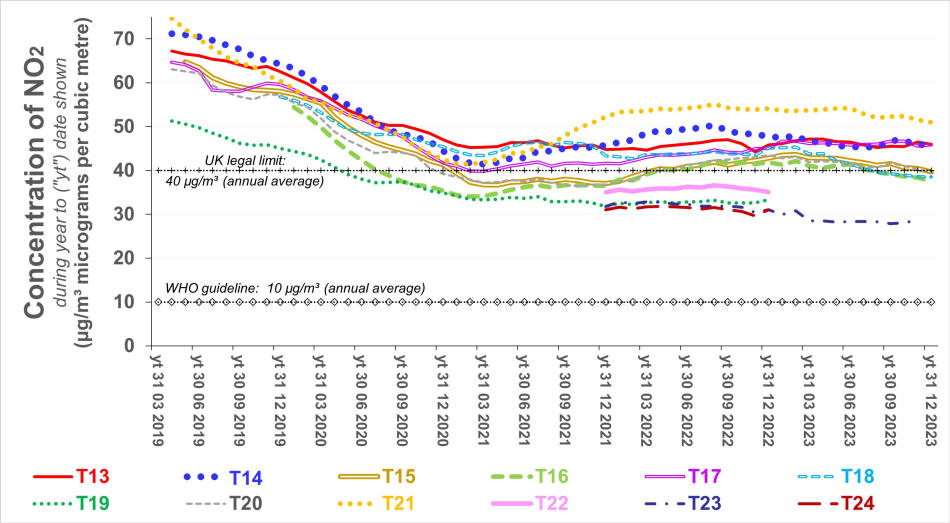
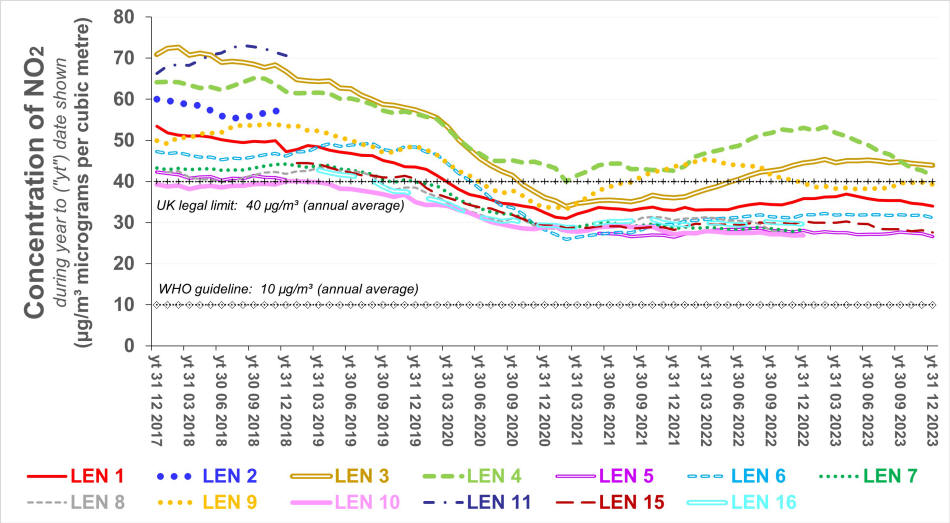
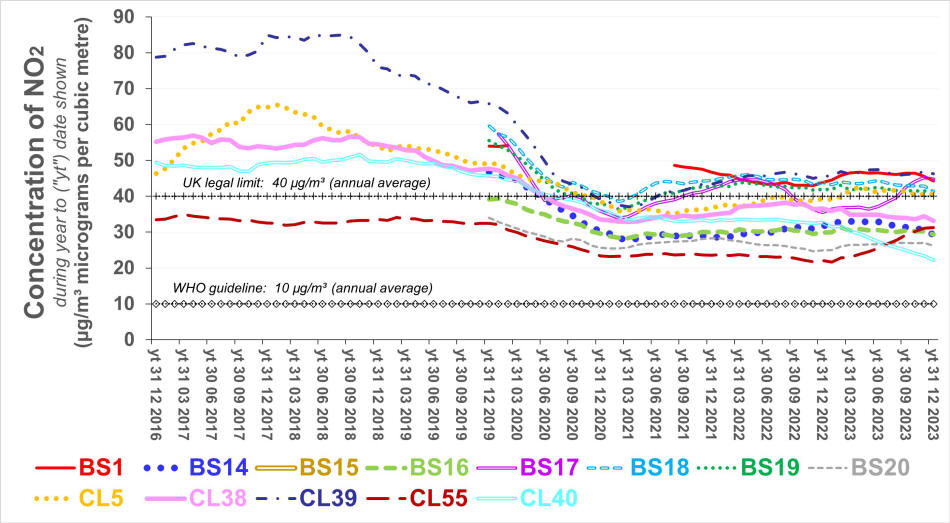
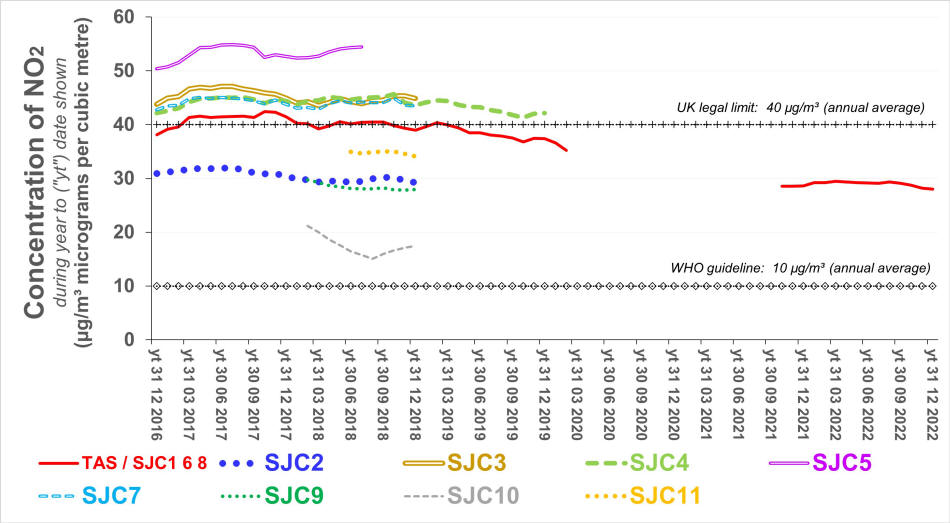
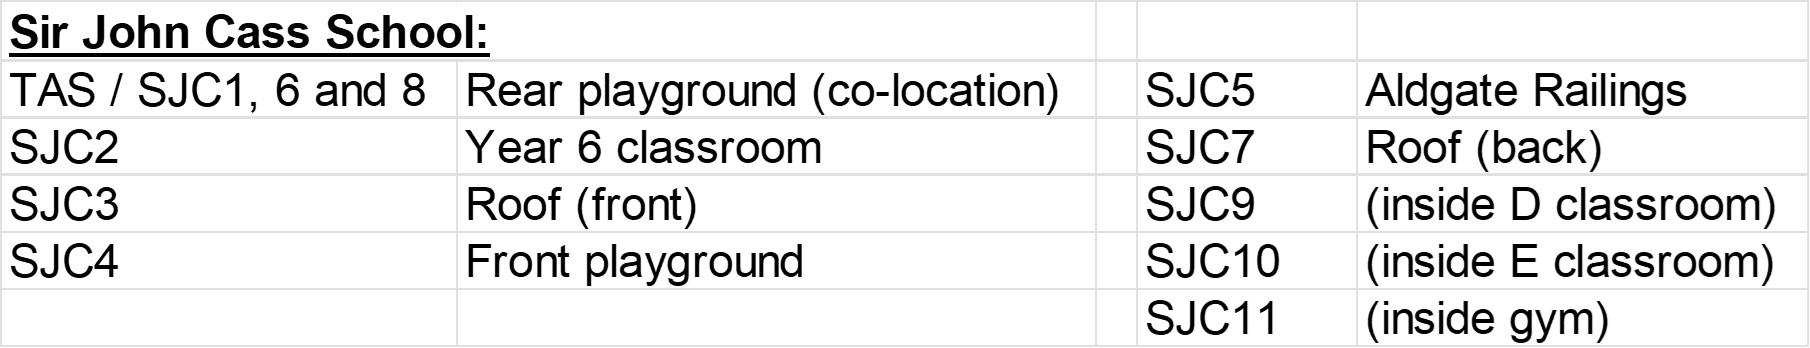
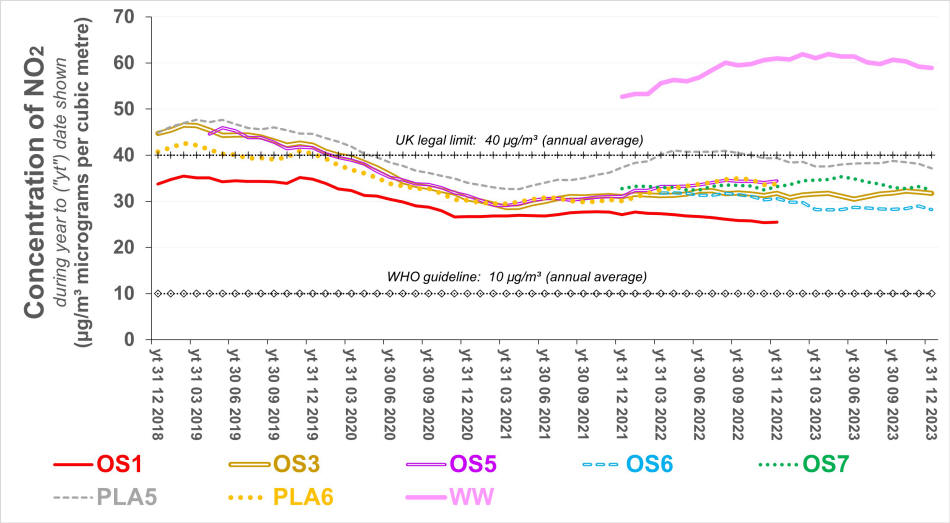
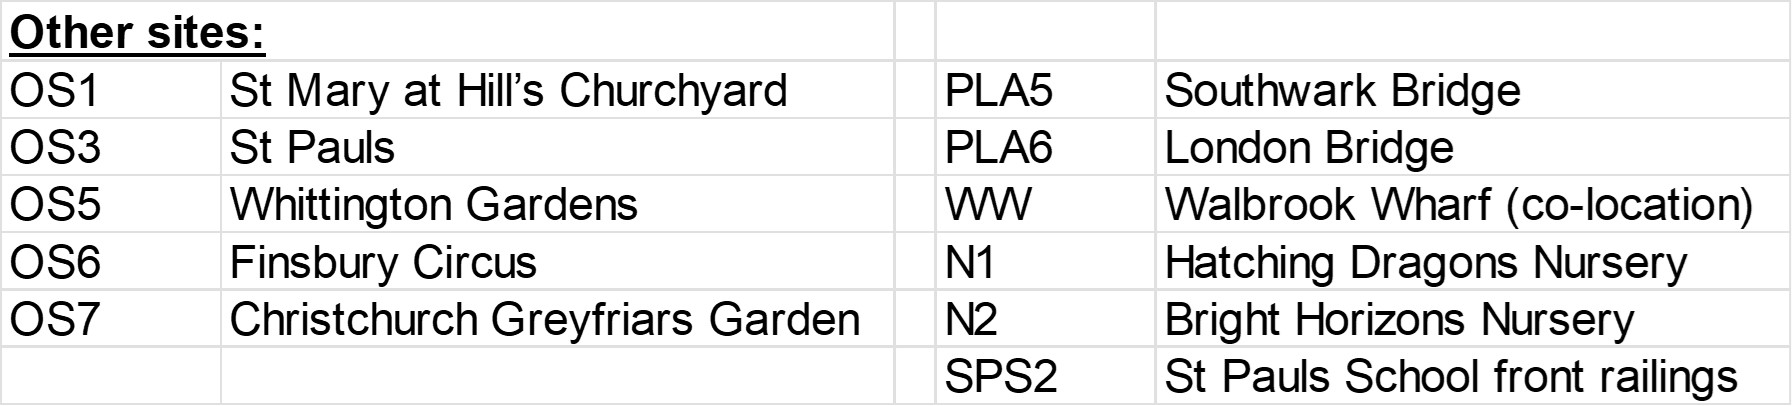
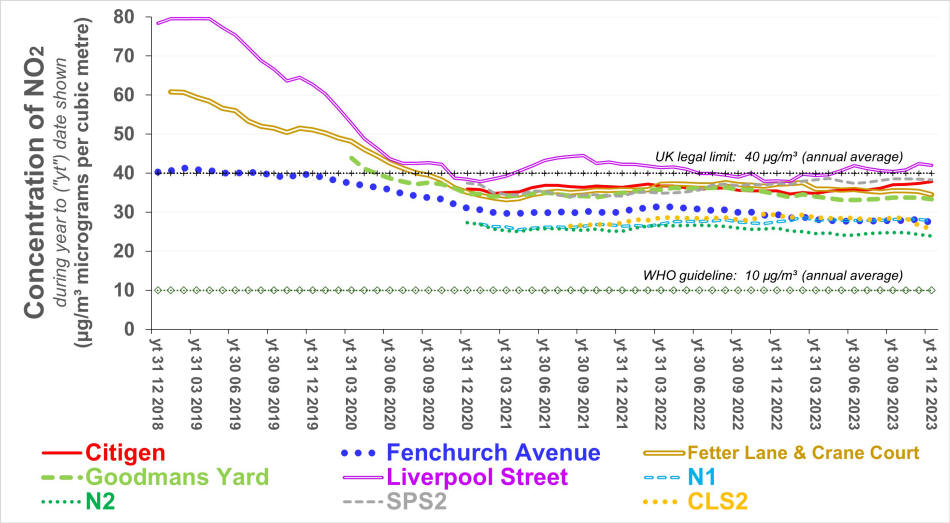
Diffusion tubes
The data shown includes estimates where the source data is either
missing or likely to be erroneous. The data shown is "raw" -
it has not been "adjusted for bias". 12-monthly average concentrations have
declined substantially since early 2020. However, after
adjusting for bias (by multiplying raw data by between 0.8 and
0.9), concentrations at a few locations approximate to
the UK legal limit - as indicated on the charts below. That limit is four times greater than
the World Health
Organisation guideline (which is based on seveal more recent years
of evidence and research). . The recent trend is - at most
locations - slowly towards lower concentrations.
  Nitrogen dioxide emissions tend to be associated with combustion - along with carbon dioxide. The lack of progress since the climate emergency was recognised reflects that progress towards Net Zero is lagging well behind where it should be (- government is not heading the warnings of the Committee on Climate Change). Delay is not negotiable. The following chart does not take into account (i) greenhouse gas emissions associated with projects, businesses, etc. outside the City of London which receive services from businesses in the City - likely to be huge - or (ii) travelling to the City. The chart indicates that the great majority of the City's emissions derive from electricity and gas. Emissions from gas are tending to increase as LNG displaces "natural" gas. As with wood pellets (and wood-based biogenic waste), emissions associated with production of LNG are large but ignored simply because they occur outside UK jurisdiction. The energy generated by burning those fuels is not low-carbon / clean / decarbonised. The source of the chart's data was published 18 months after the end of the most recent year shown - despite an obvious need to audit progress at intervals of at most six months given the Climate Emergency. The GLA tends to release the data to London local authorities six months after they are published. 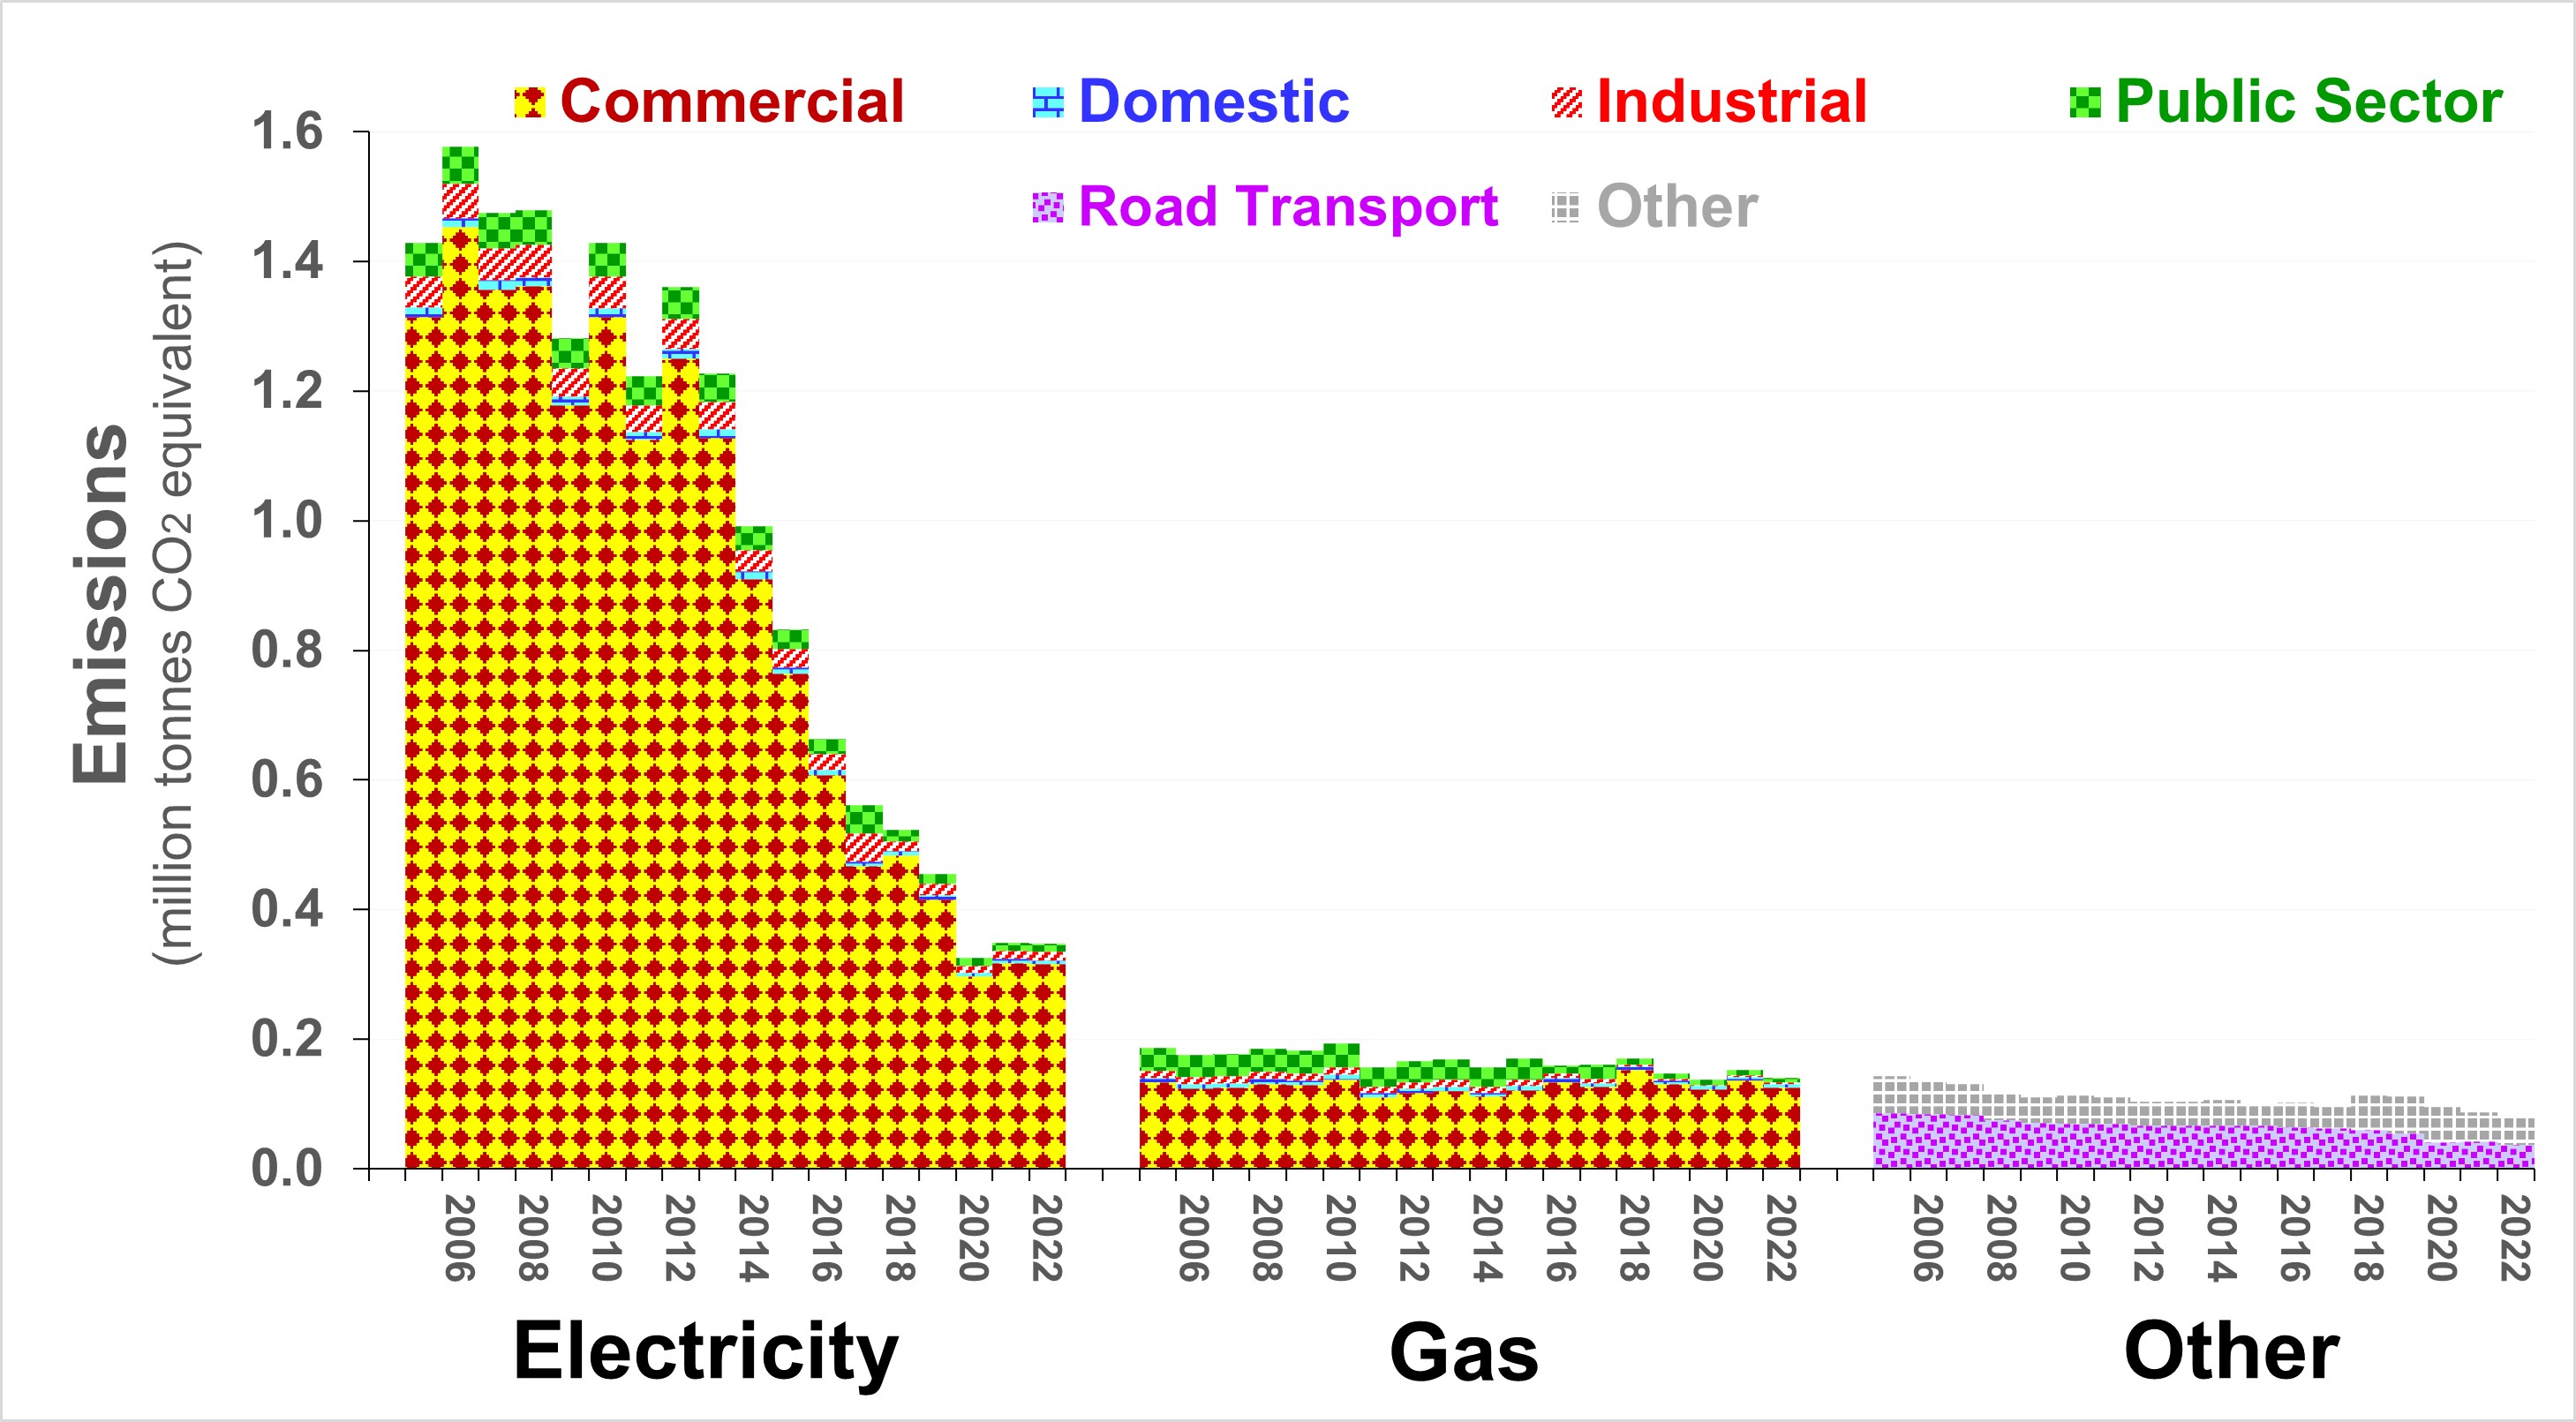 |
|||
|
For further information, please contact: info@airqualitymatters.uk |
|||
| Back | |||