|
AIR QUALITY MATTERS |
|
Borough of Bexley |
|
|
|
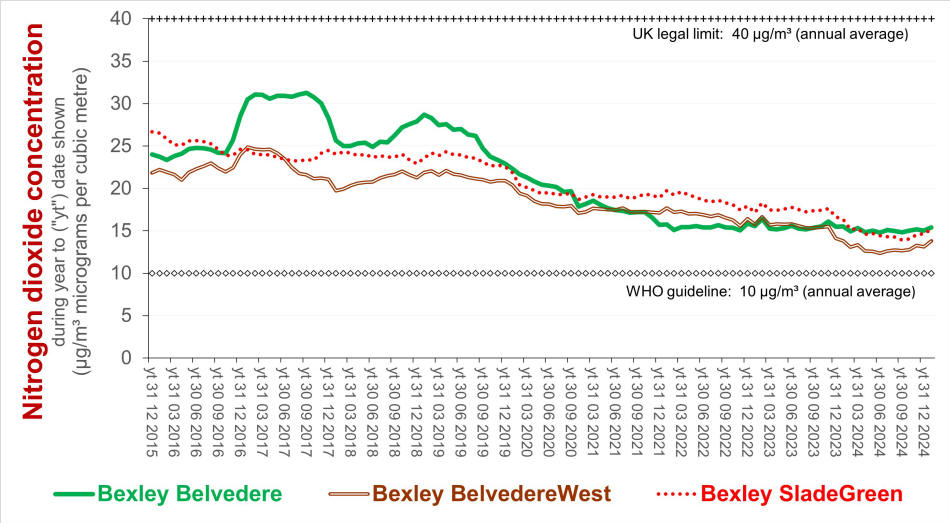
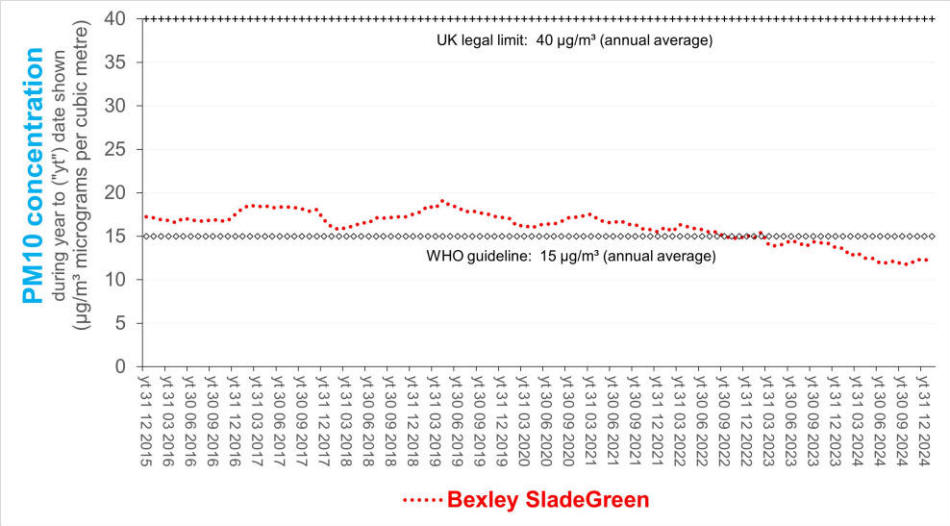
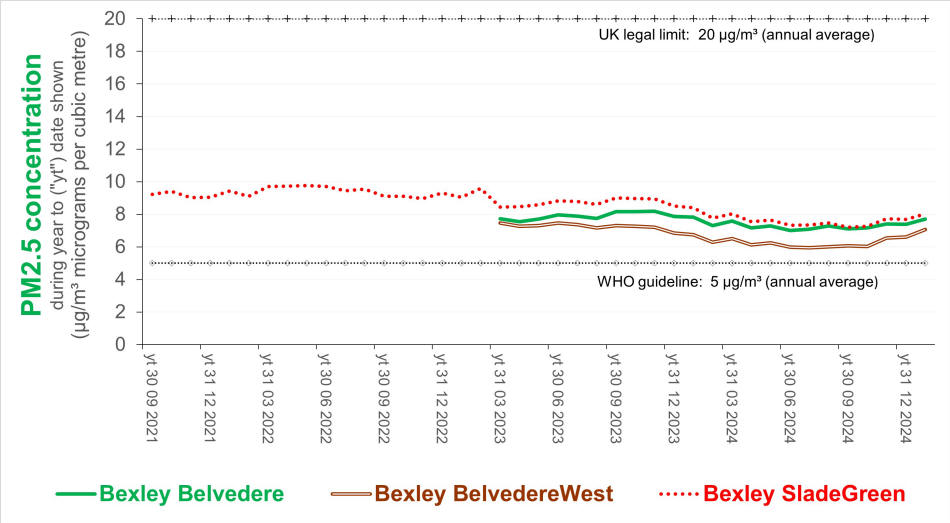
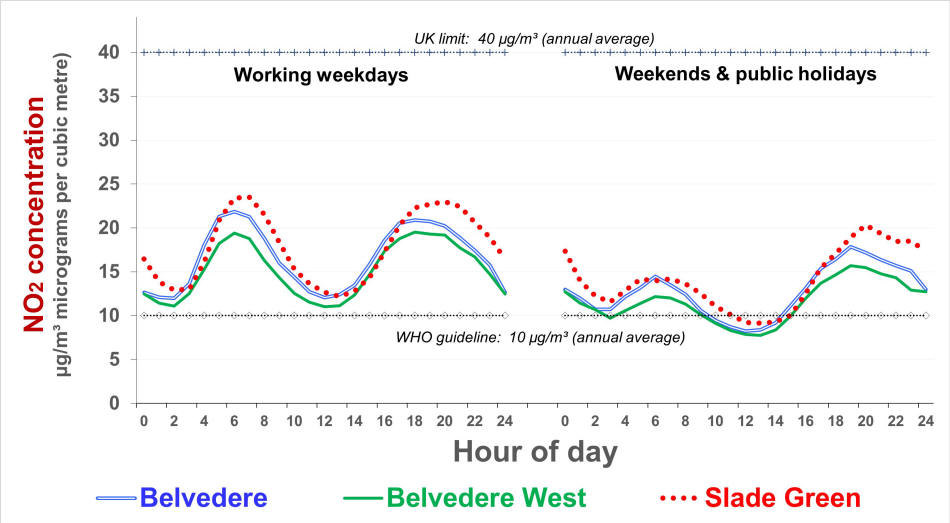
Keeping the public in the dark - London Borough of Bexley's way of saying No! to NO2 ? Unlike most other London Boroughs, Bexley does not use diffusion tubes to monitor borough-wide concentrations of nitrogen dioxude ("NO2"). That said, it does do so occasionally for projects at specific sites. NO2 is one of two air pollutants of greatest public concern, especially on account of its health impact. Particulate matter PM2.5 is the other. In default of Air Quality Annual Status Reports (other than for calendar 2021 and 2022), the following charts may provide insights about air quality in the borough. The charts derive from data reported by londonair.org.uk for the three reference monitors. The data for 2025 and most of 2024 has yet to be ratified. Although the charts indicate cleaner air than in much of the rest of London, the monitors are located well away from the traffic which blights the borough. Why?
What sources
of pollution contribute most to concentrations NO2
and PM2.5? Burning (in engines, central heating boilers,
commercial cooking, waste incinerators), vehicles (tyres, breaks,
road surfaces), construction and other industries (including
farming), etc. Most of the sources for NO2 are local (and
decline quite steeply away from hotspots). Sources outside
London and the UK tend to contribute more to PM2.5 than to NO2.
Meteorological conditions (e.g. wind, temperature, sunshine) also
affect concentrations.
|
|
For further information, please contact: info@airqualitymatters.uk |
| Back |