|
AIR QUALITY MATTERS |
|
Borough of Barnet |
"Diurnal
variation beyond the
North Circular"
|
|
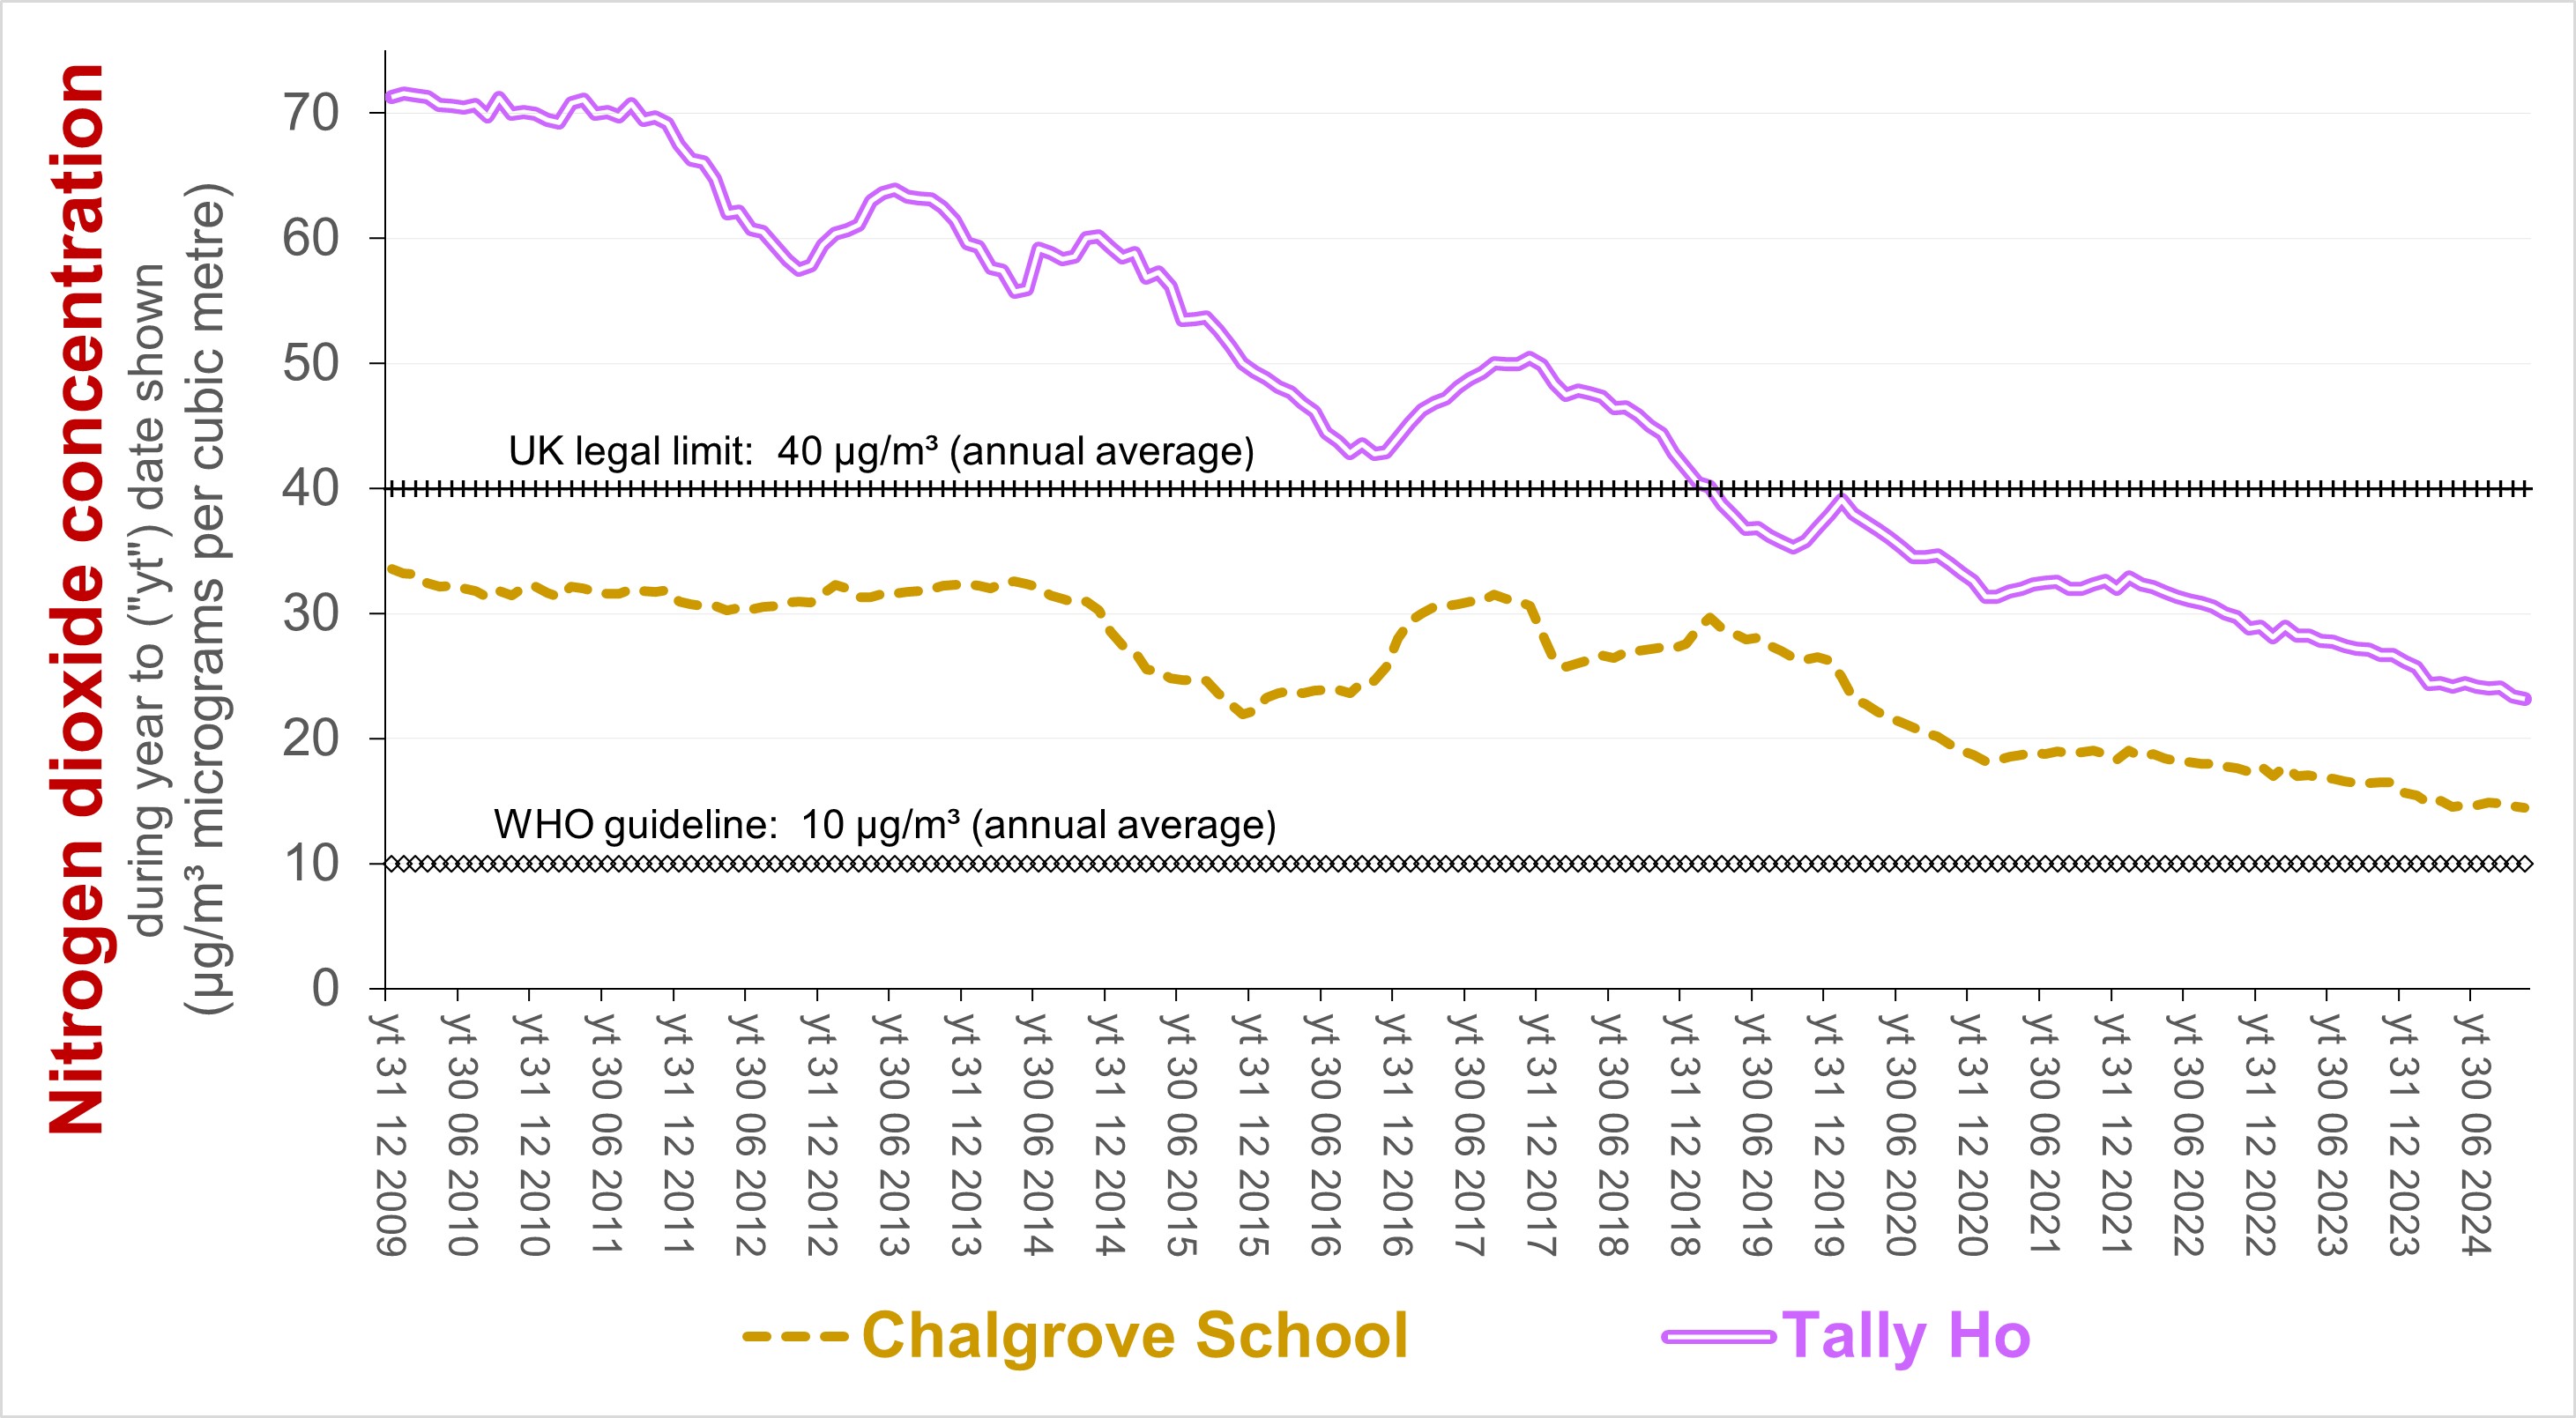
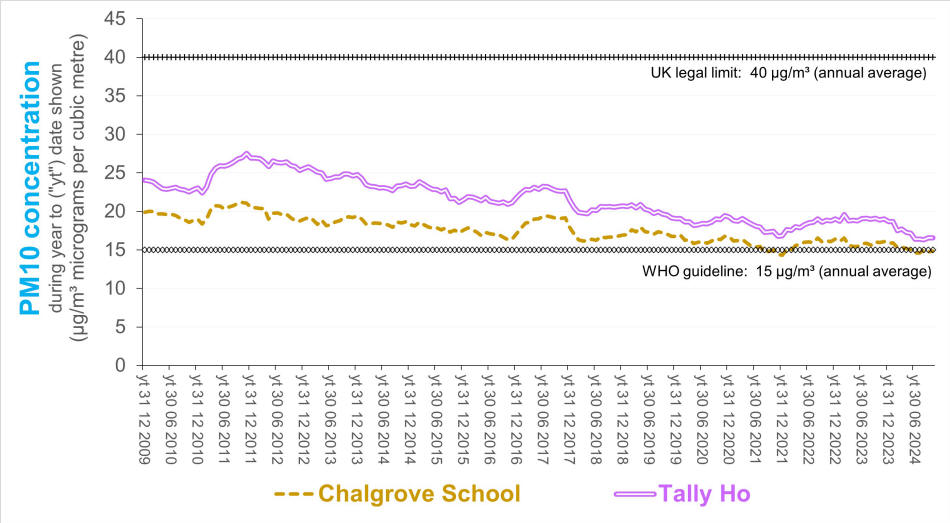
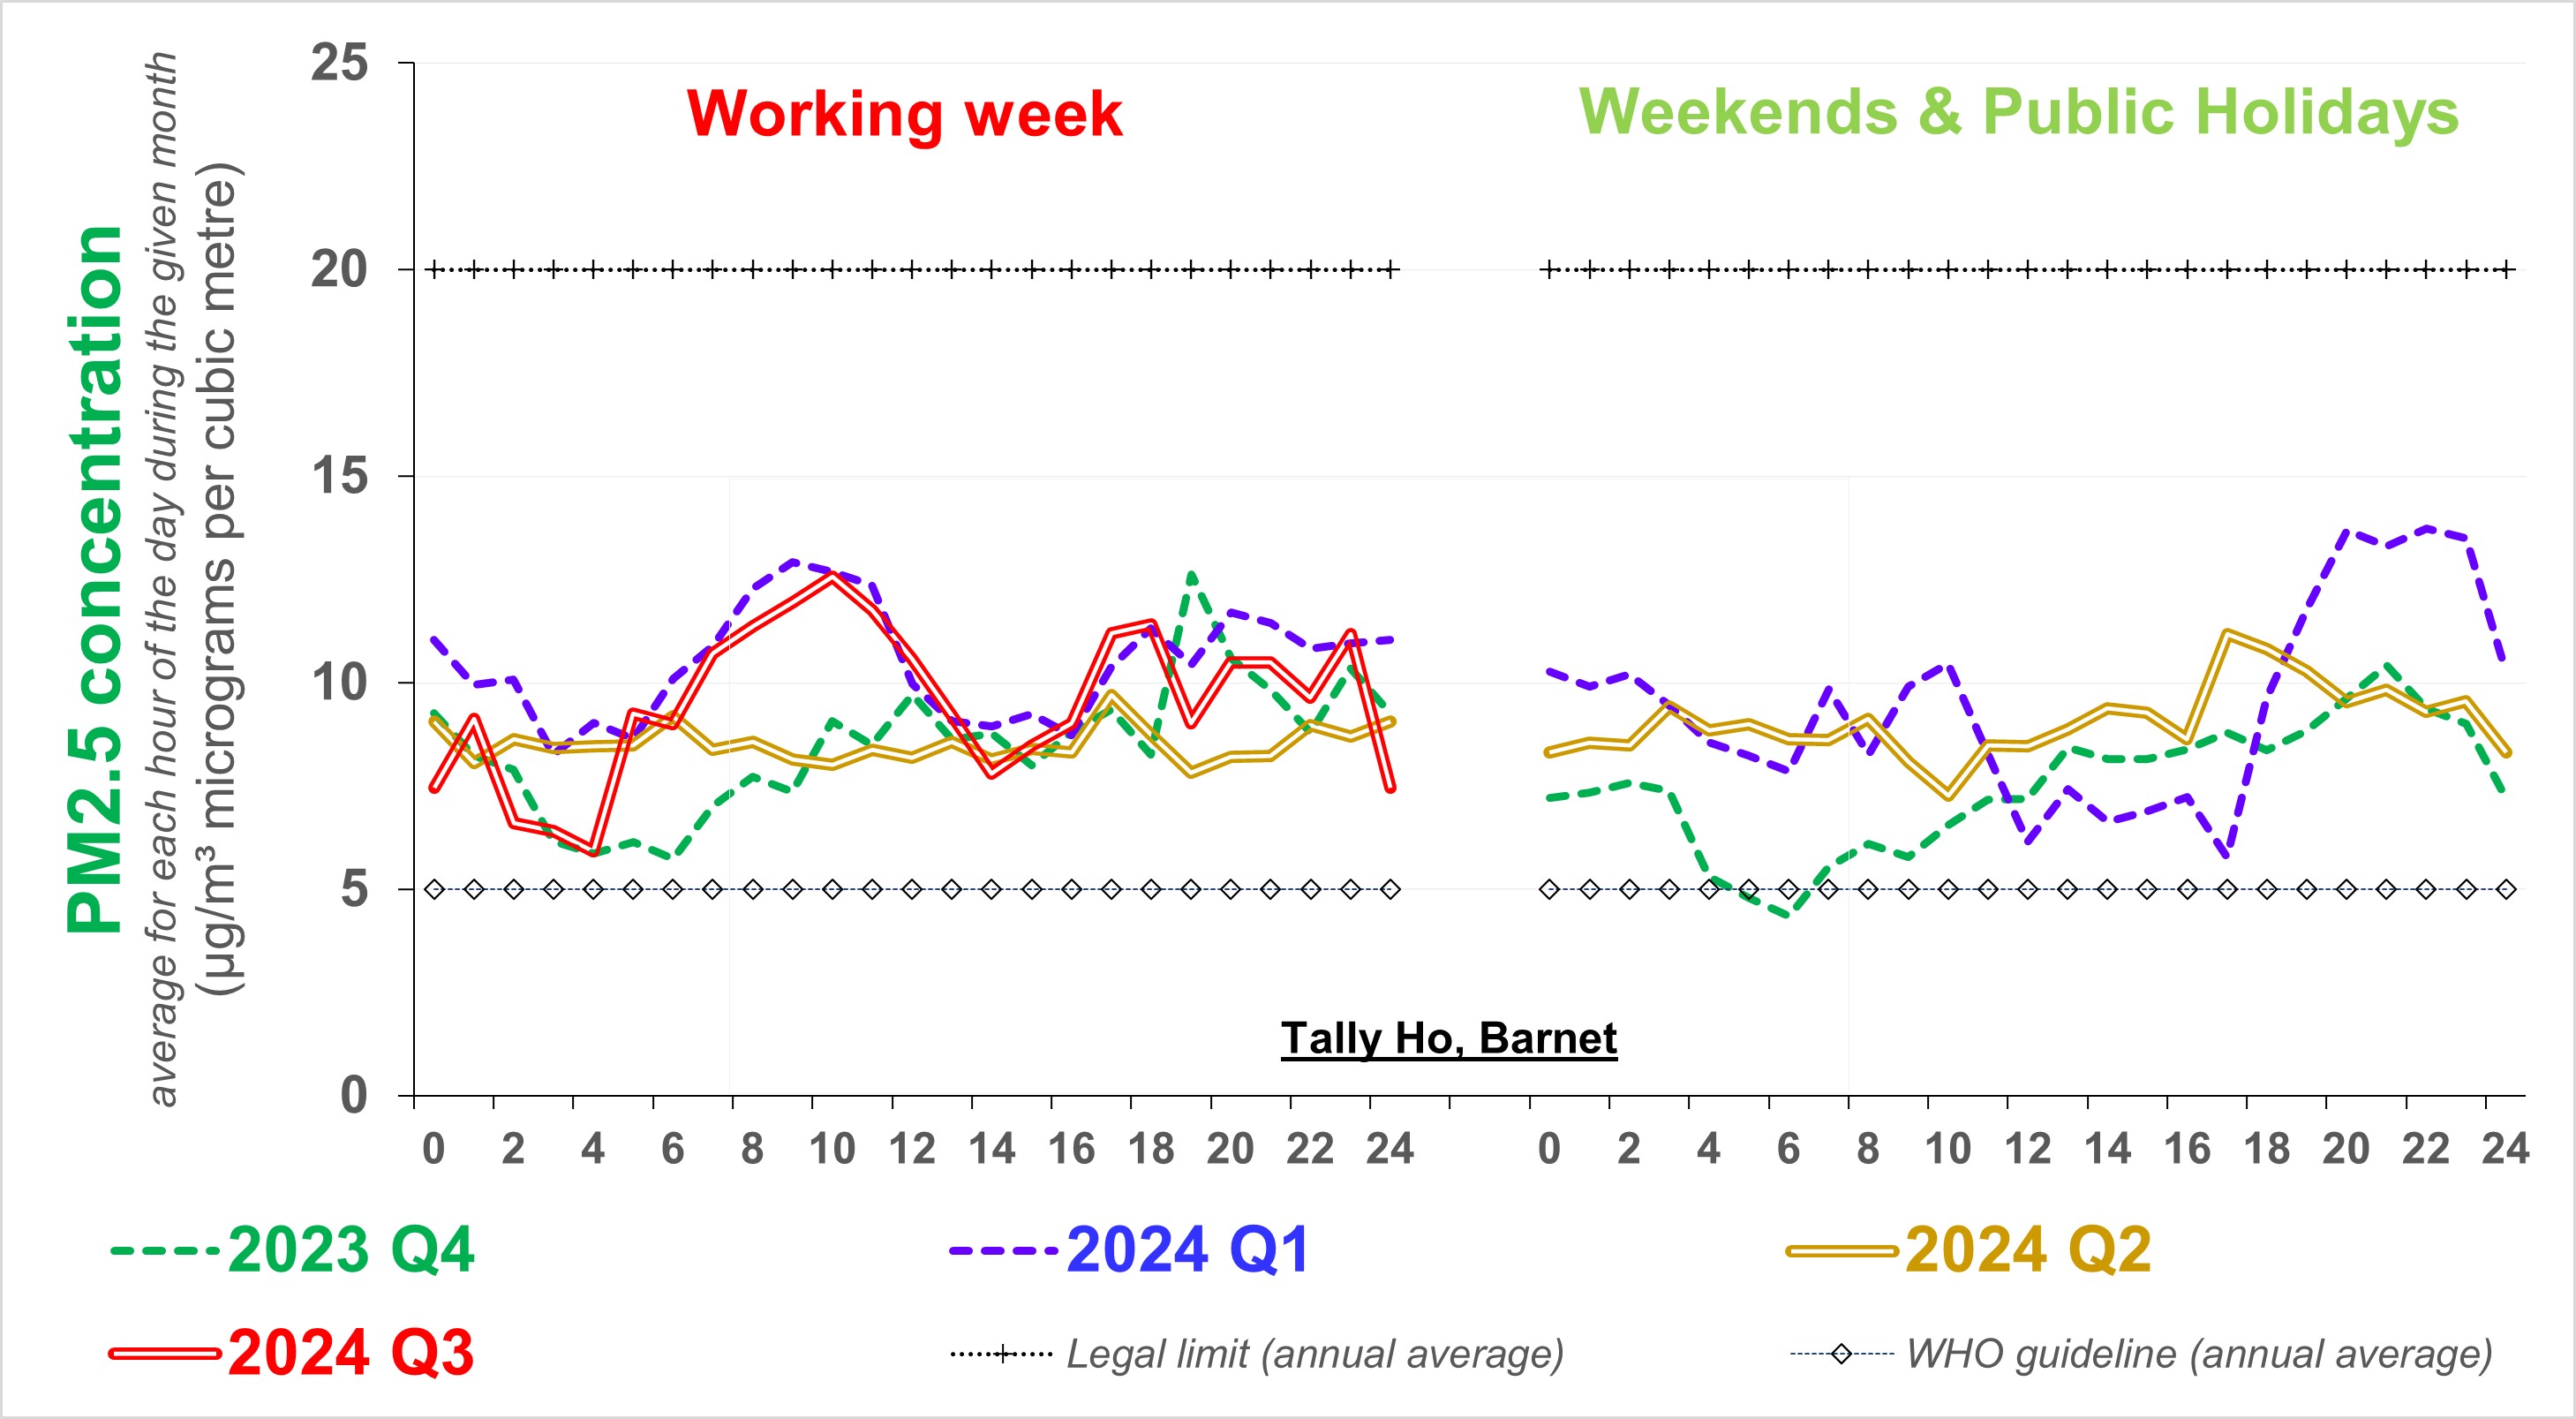
The following charts illustrate trends in emissions of the two air pollutants having greatest current concern, nitrogen dioxide ("NO2") as particulate matter - specifically PM10 and PM2.5. Measured for Barnet Council using diffusion tubes. In the London Borough of Barnet, those pollutants are measured using reference quality monitors at Chalgrove School (a background location) and Tally Ho (a heavily trafficked roadside location) and a number of other devices which generate data indicating the concentration of those two pollutants. The latter predominantly comprise those deployed especially for community interest under the current Breathe London project. Air Quality England is the source from which the following two charts derive. Data for Chalgrove School and Tally Ho has been ratified upto the end of June 2024 and March 2024 respectively. (PM2.5 concentrations have been monitored at Tally Ho since the end of November 2023.)
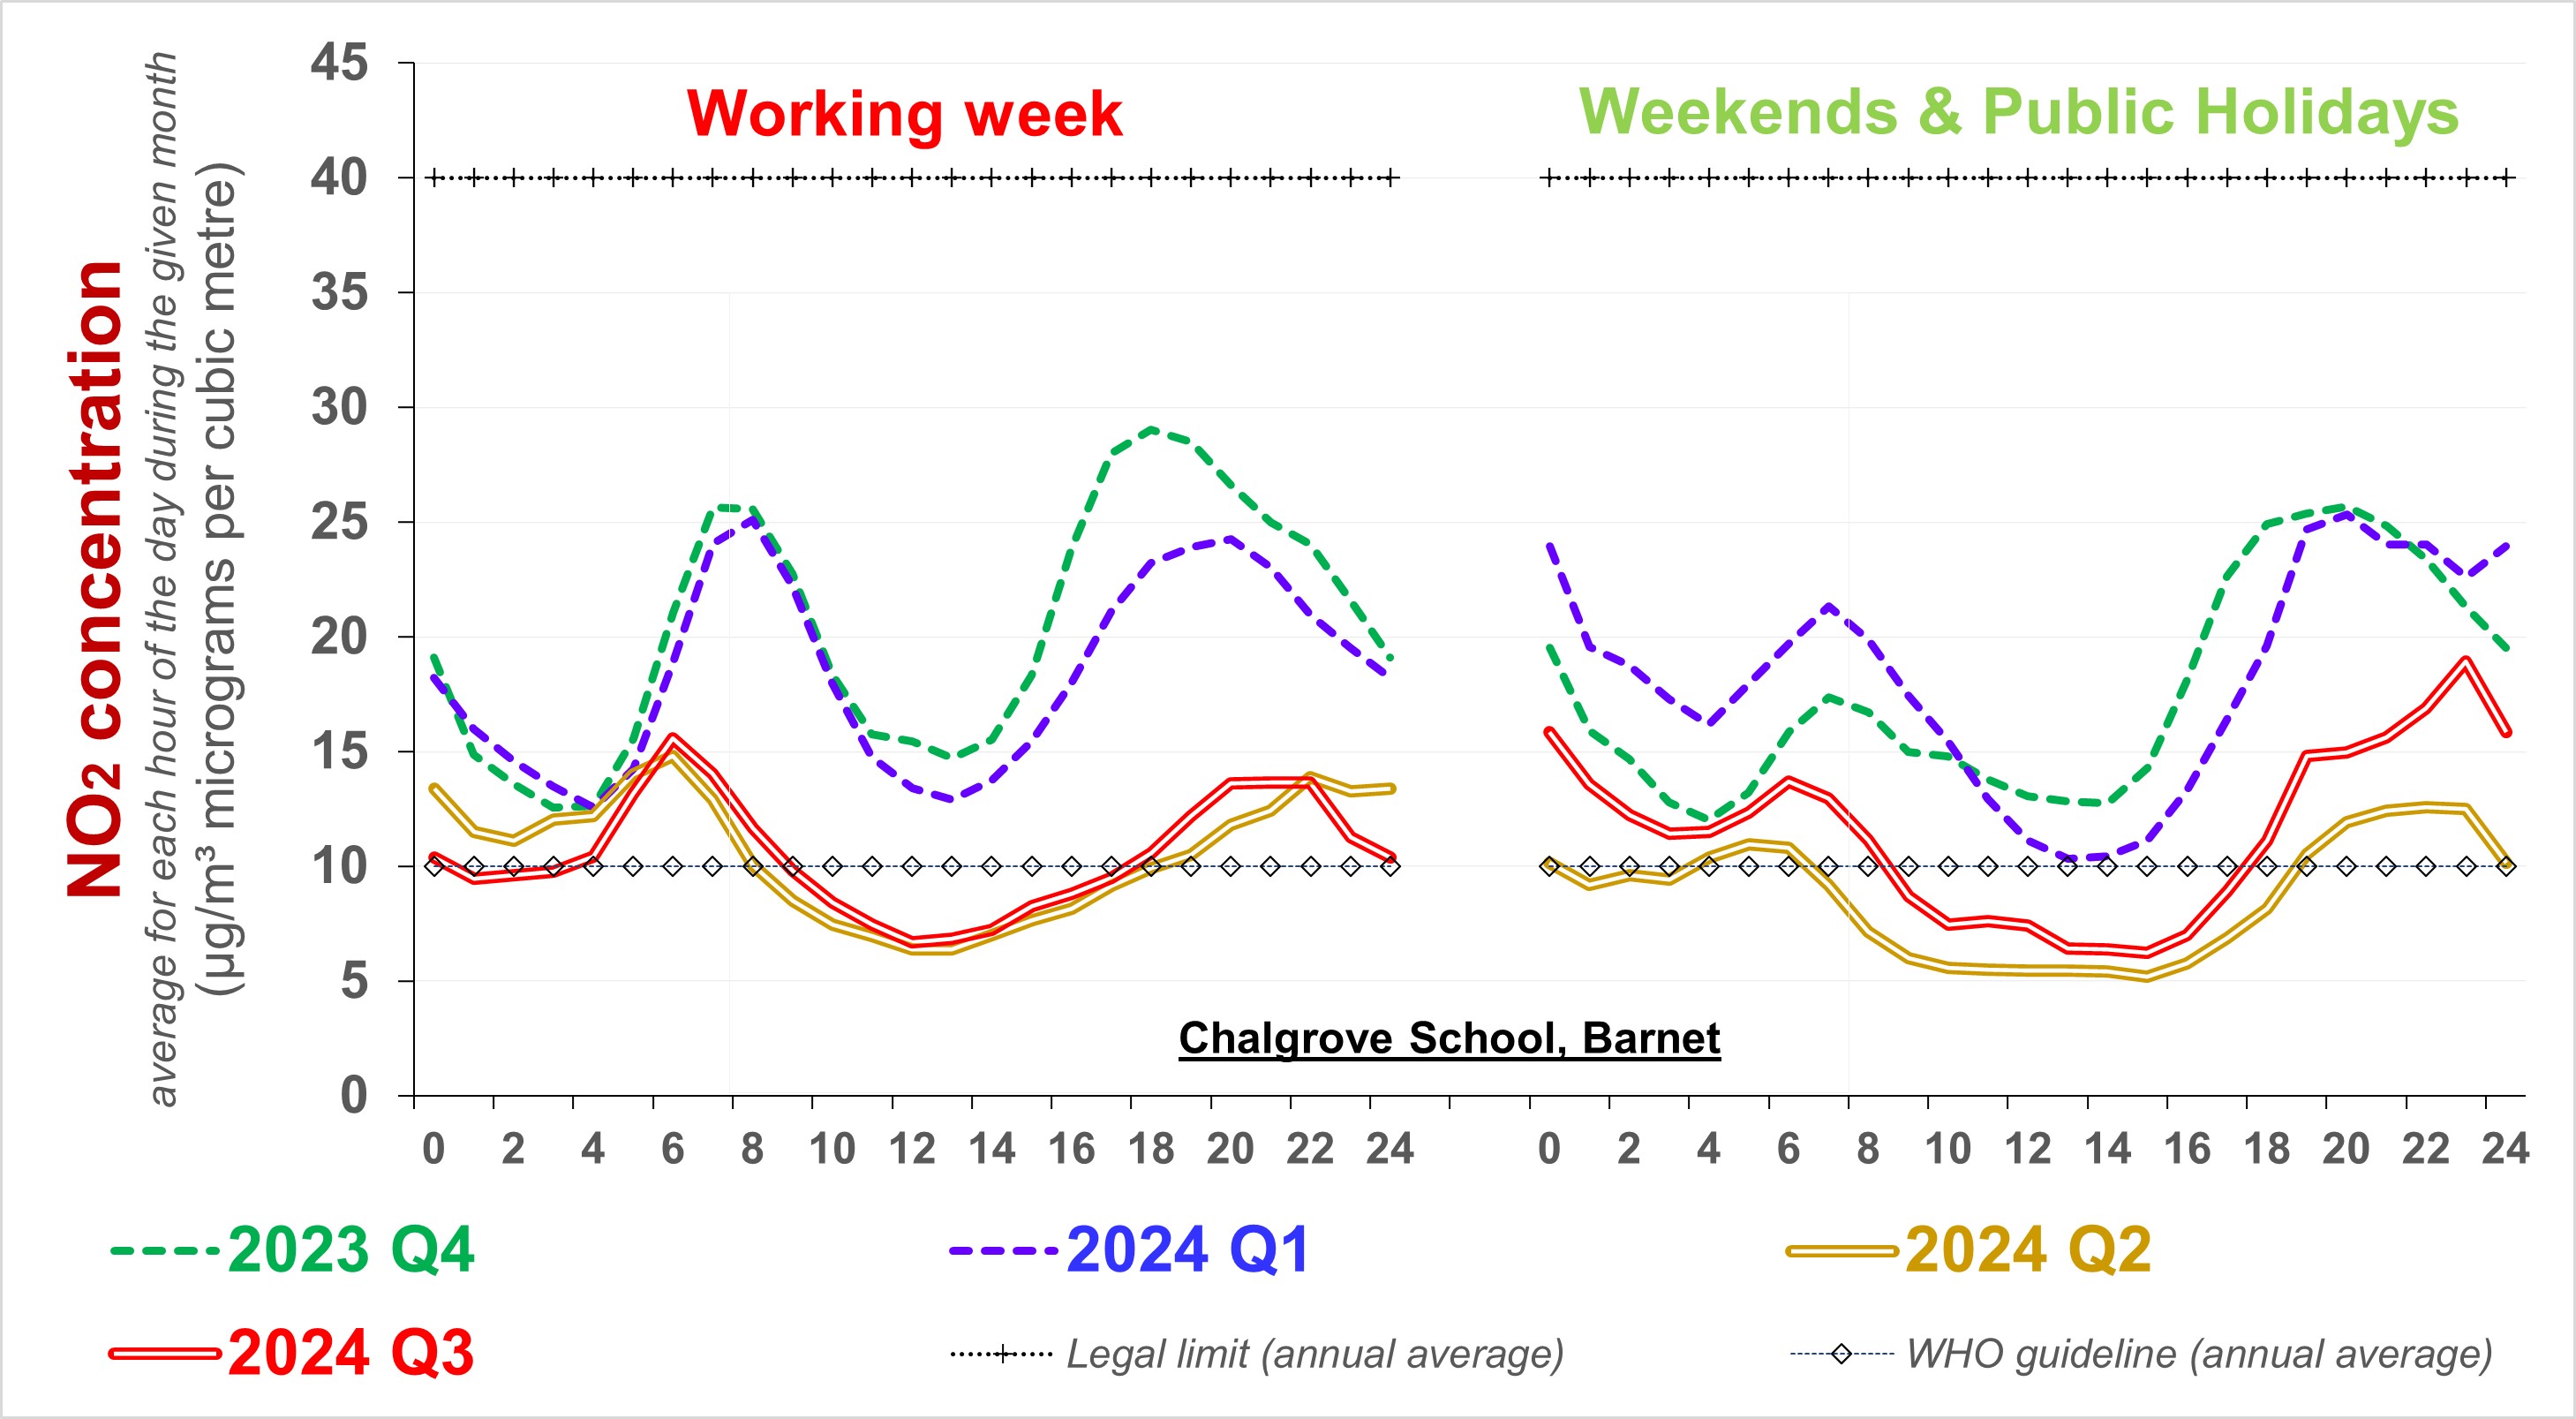
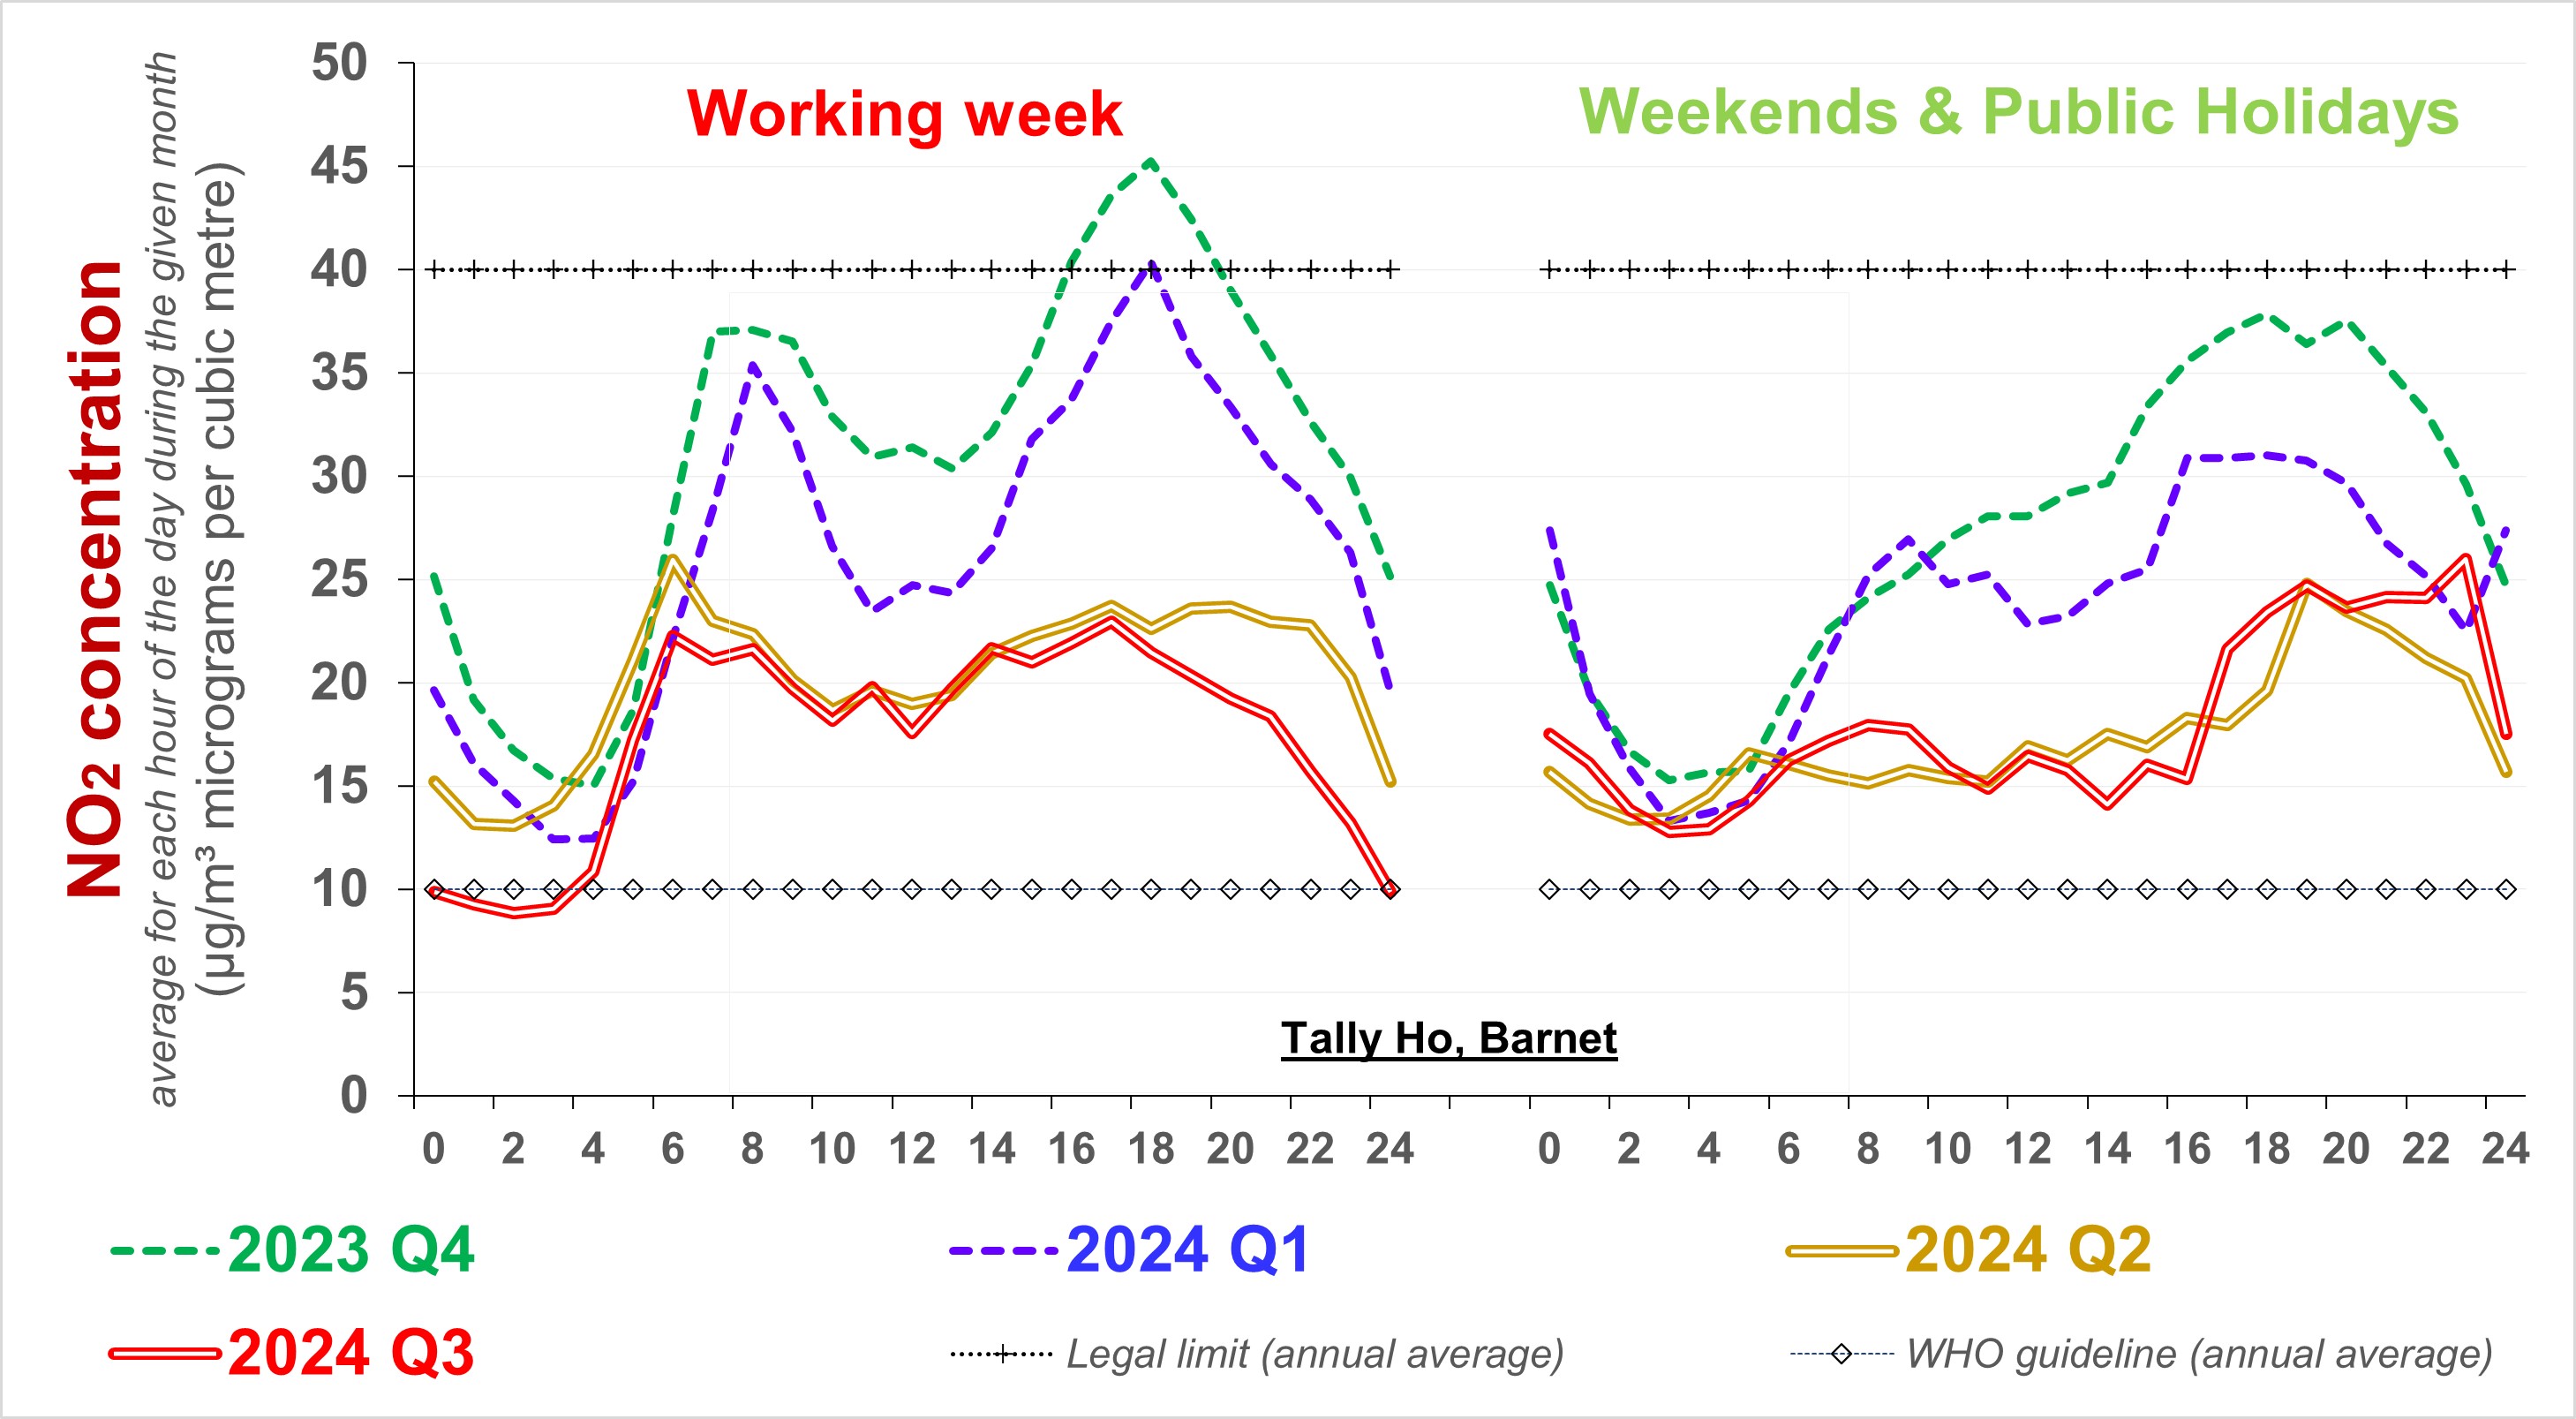
The following two charts illustrate how concentrations of NO2 and PM2.5 tend to vary hour by hour throughout the day. They distinguish between the working week and other days. The data are averages for the most recent complete quarters of the year. Please not that much of no data is available for long periods (some of which exceed a month). Unlike the upper pair of charts, the lower three do not include estimates where data is unavailable. The lowermost of the three excludes Q3 2024 data for Weekends & Public Holidays because that (provisional) data seems anomalous.
Click here for similar charts deriving from - indicative - data for Breathe London devices.
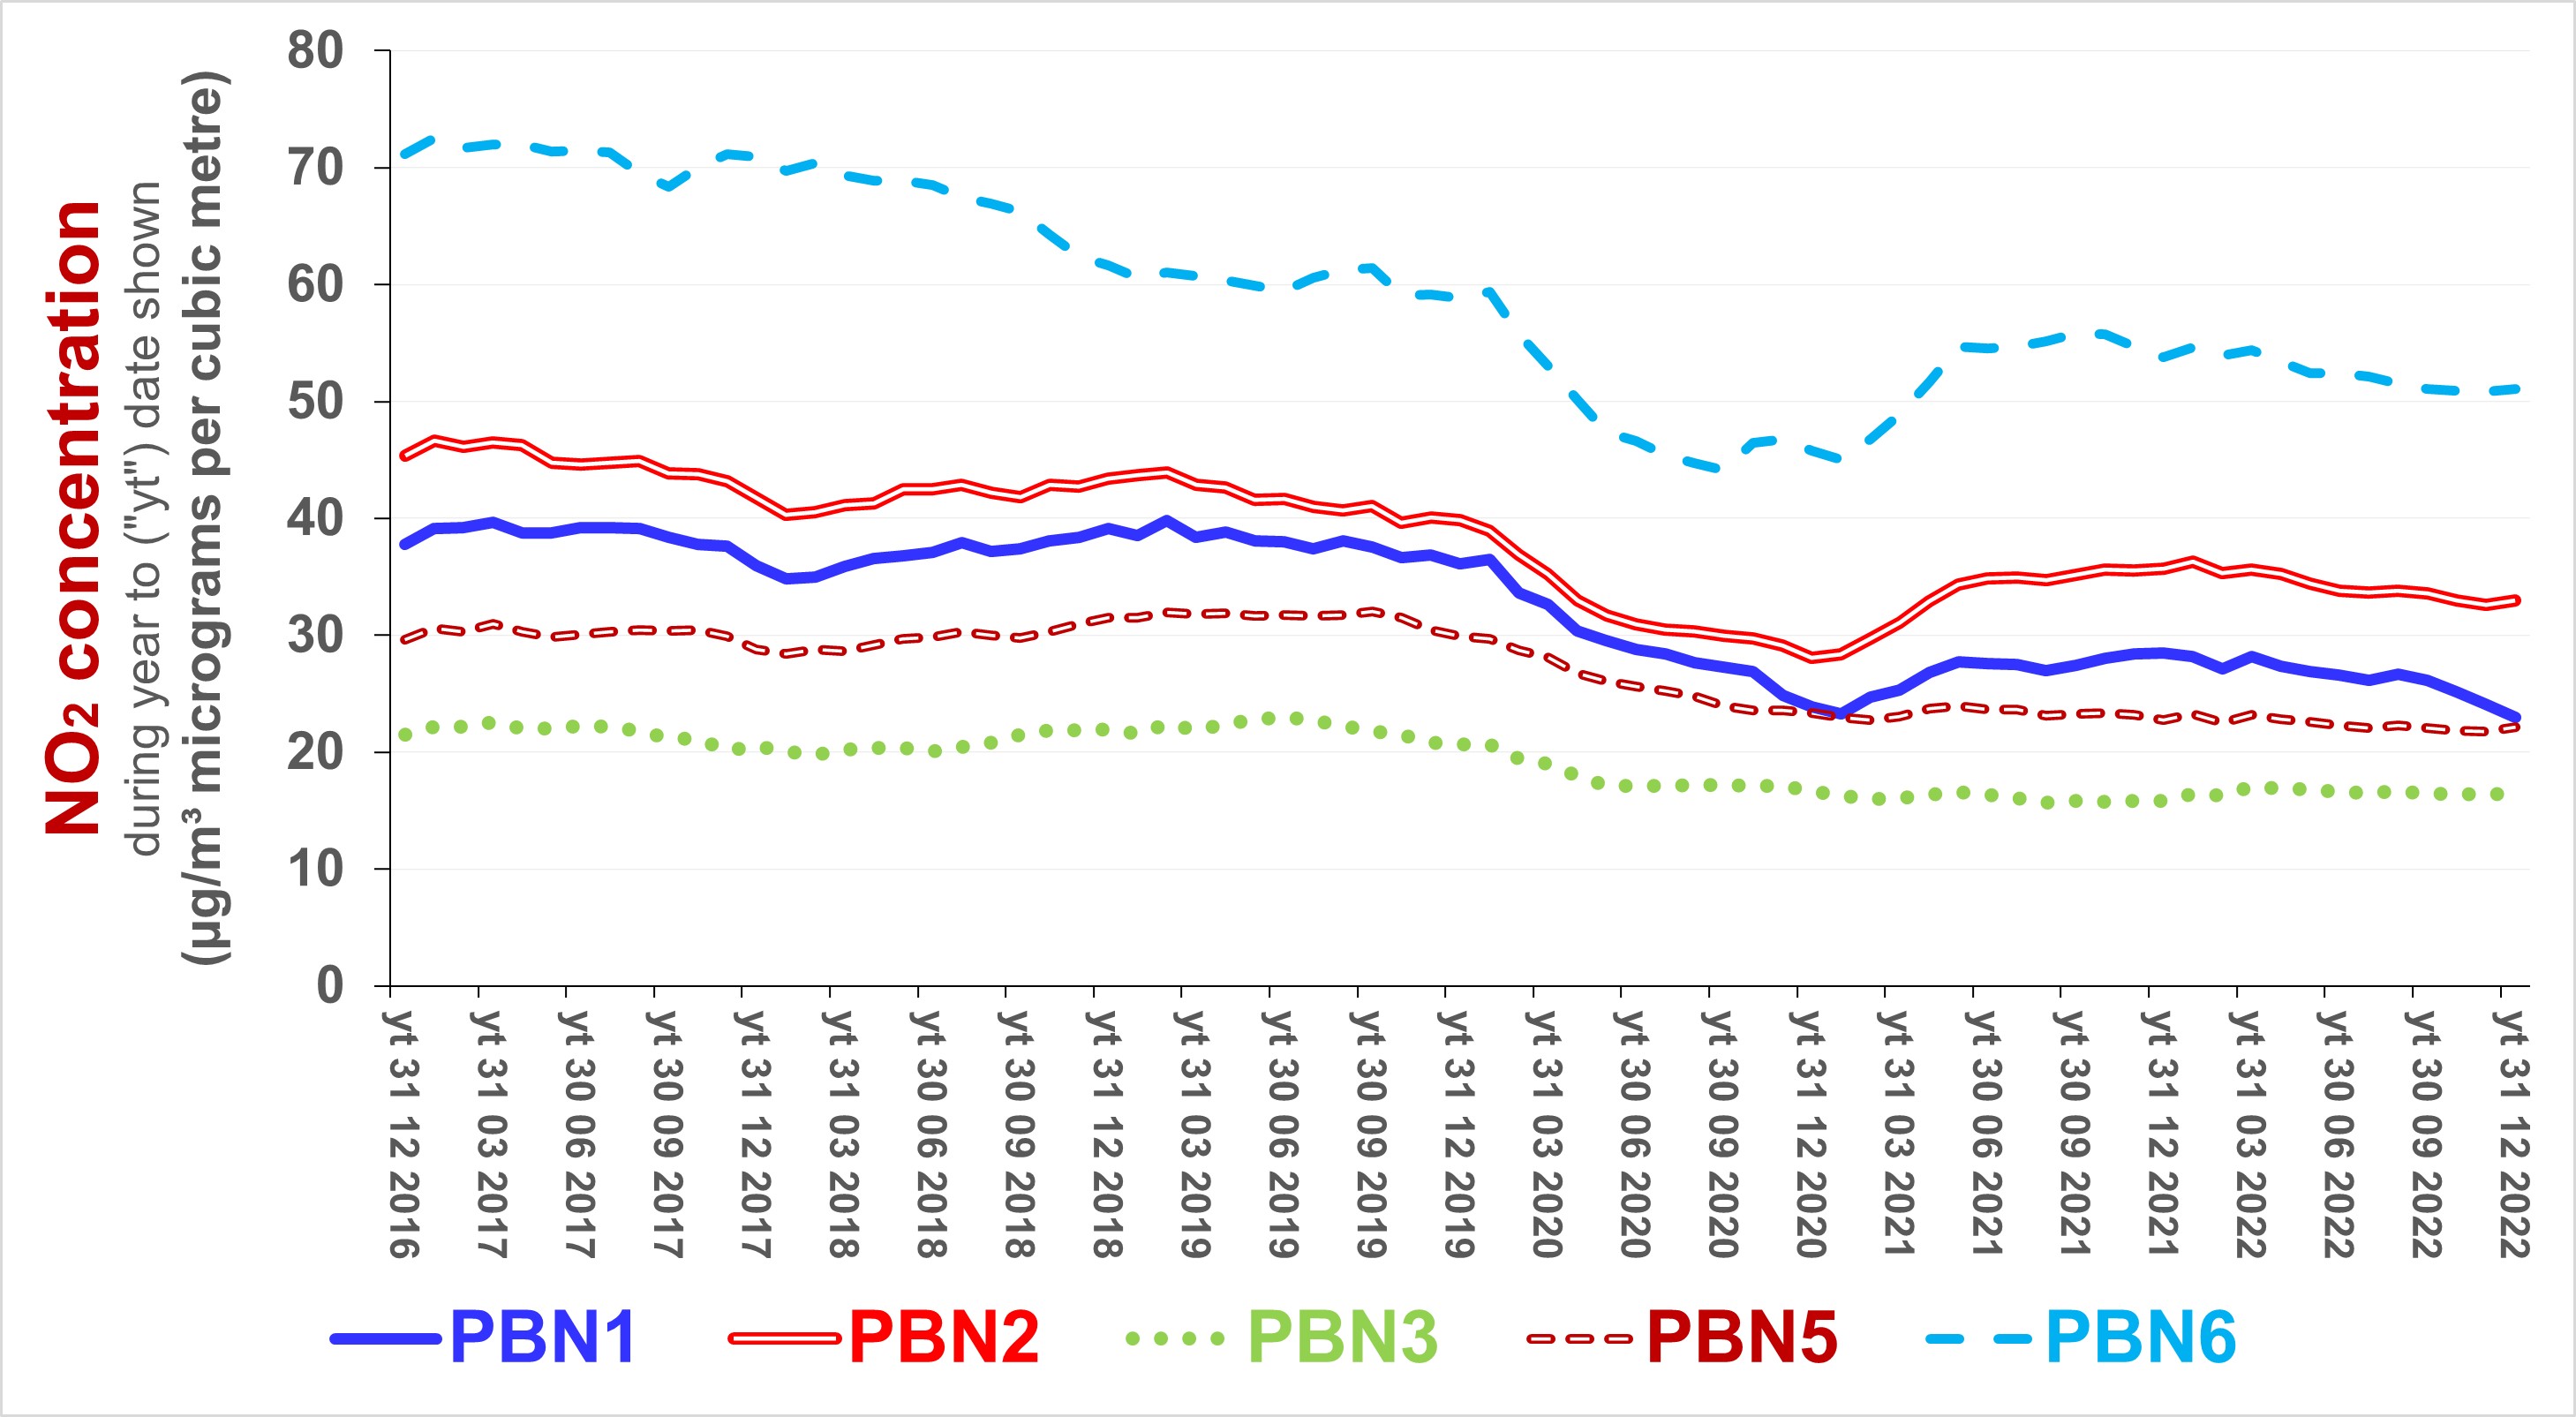
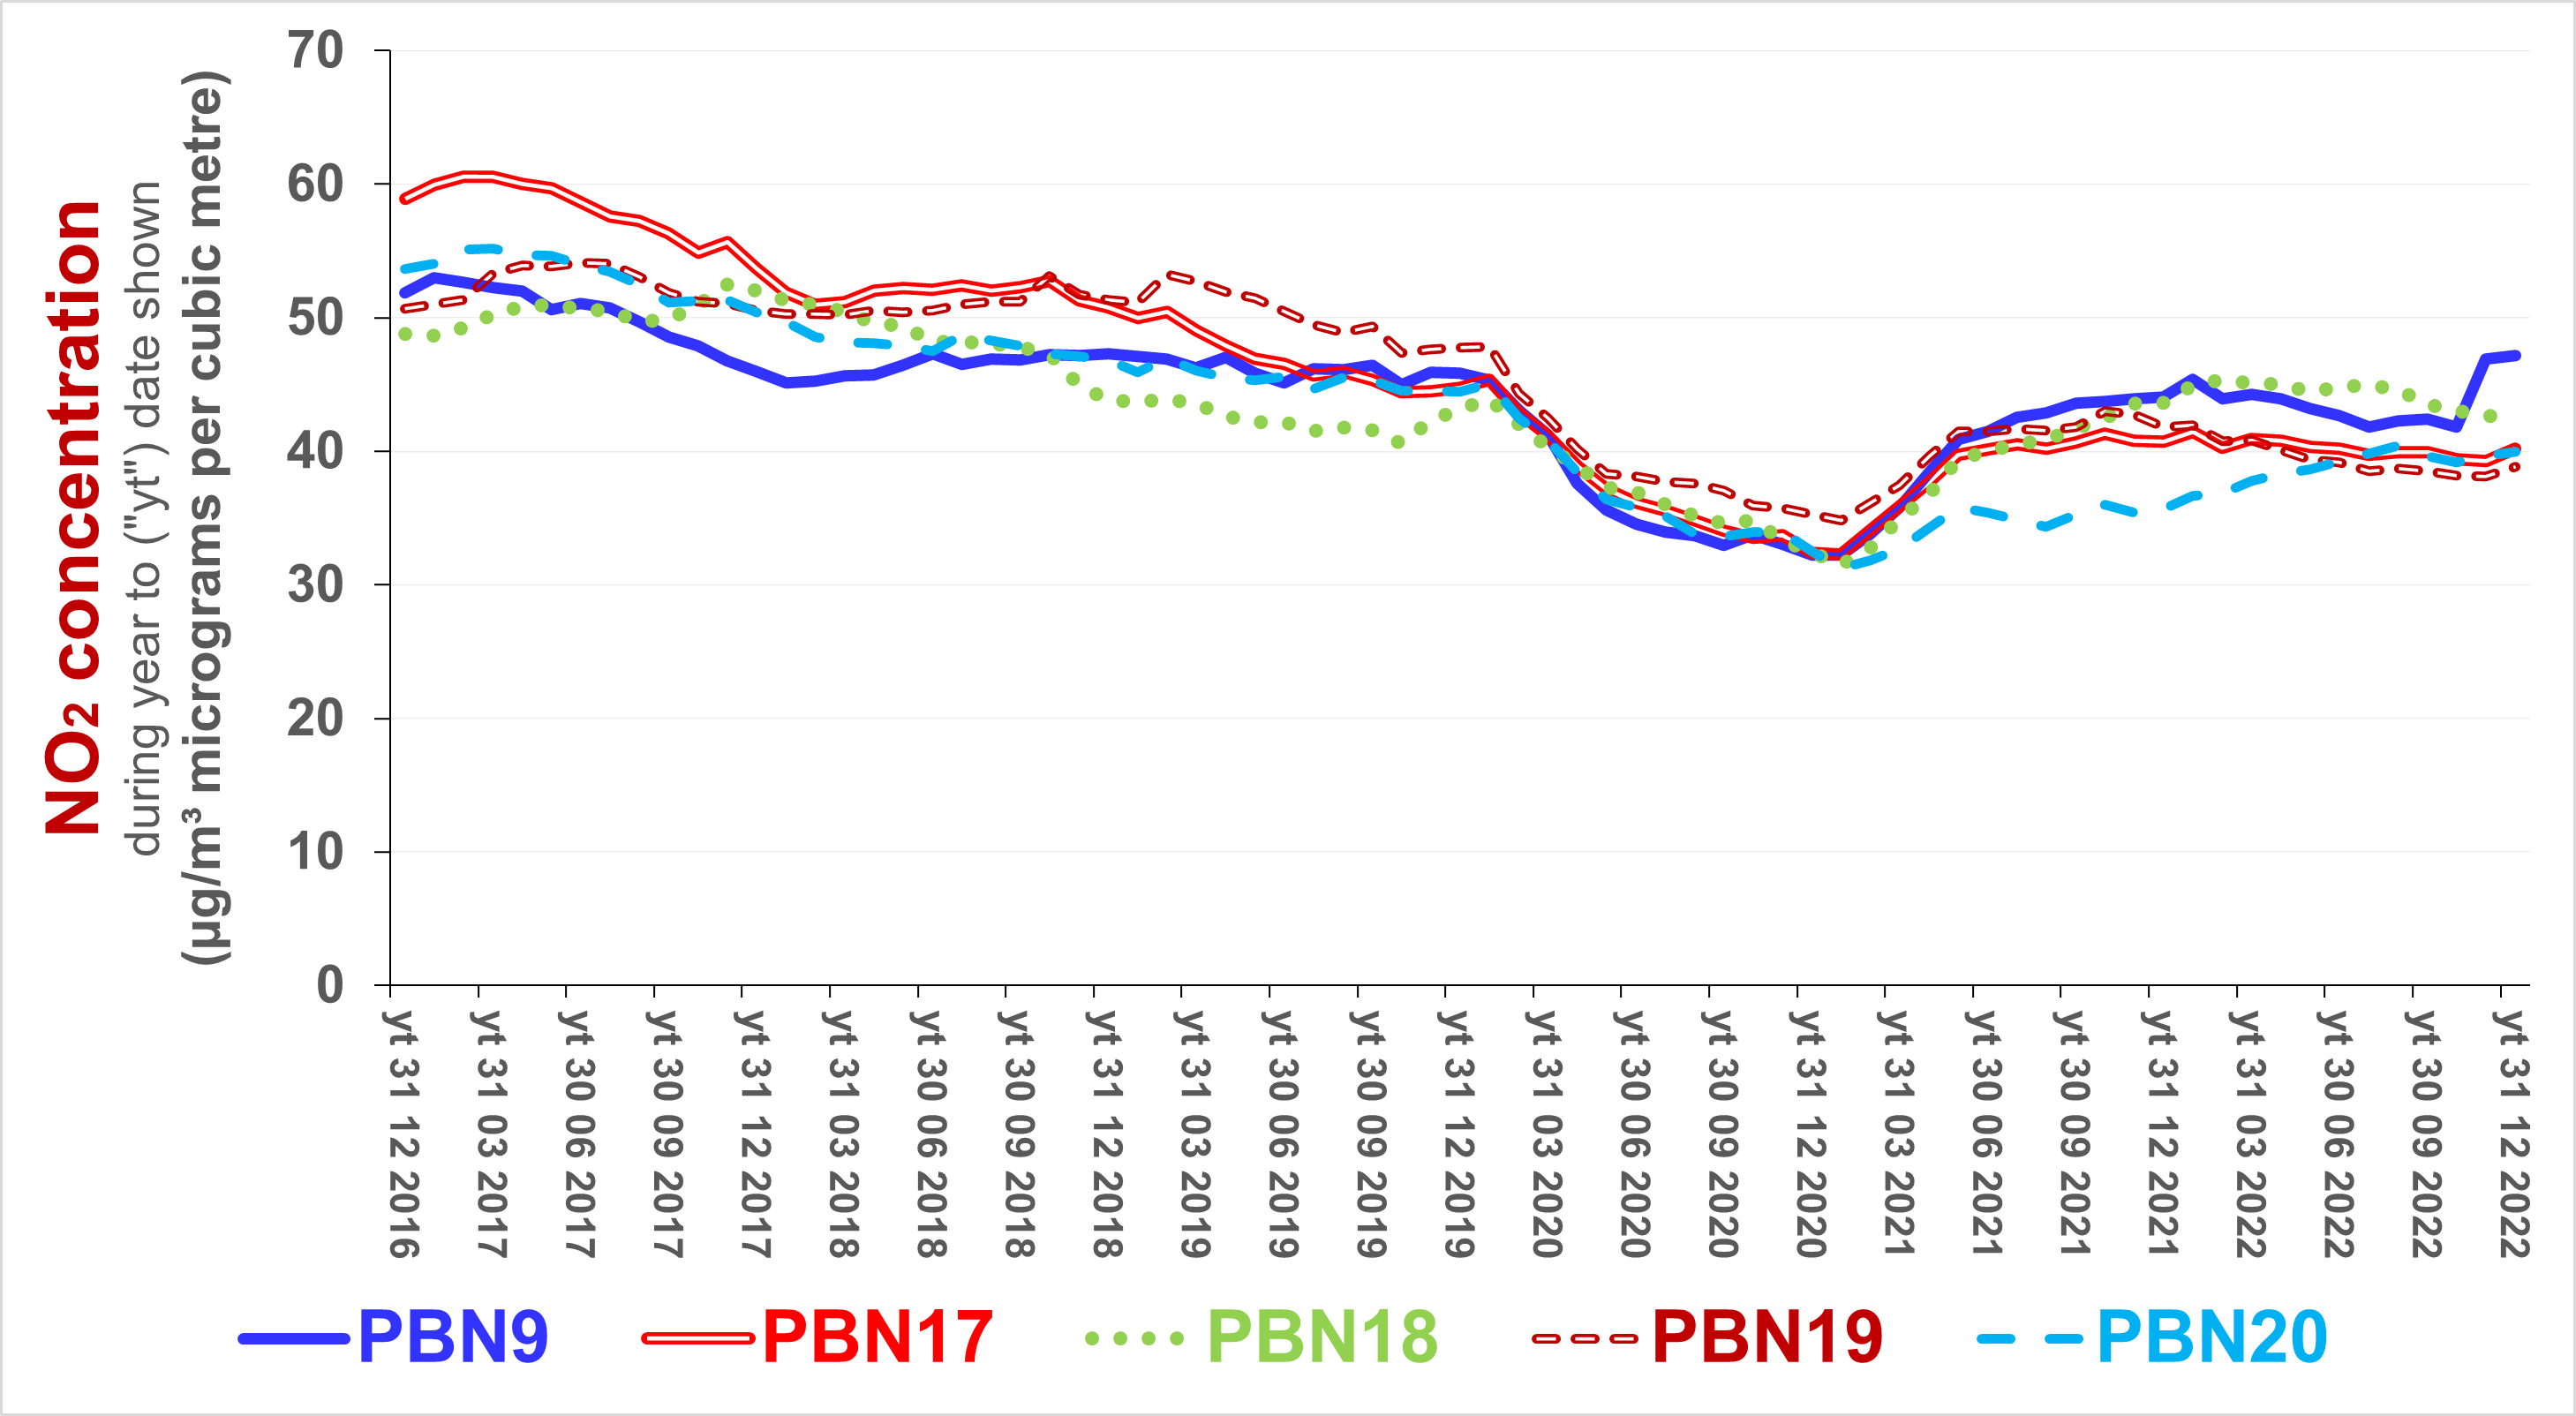
The following charts illustrate trends in NO2
concentrations as indicated by diffusion tubes deployed across
Barnet.
|
|
For further information, please contact: info@airqualitymatters.uk |
| Back |
