|
AIR QUALITY MATTERS |
|
Pembridge ward (Royal Borough of Kensington and Chelsea) |
|
|
|
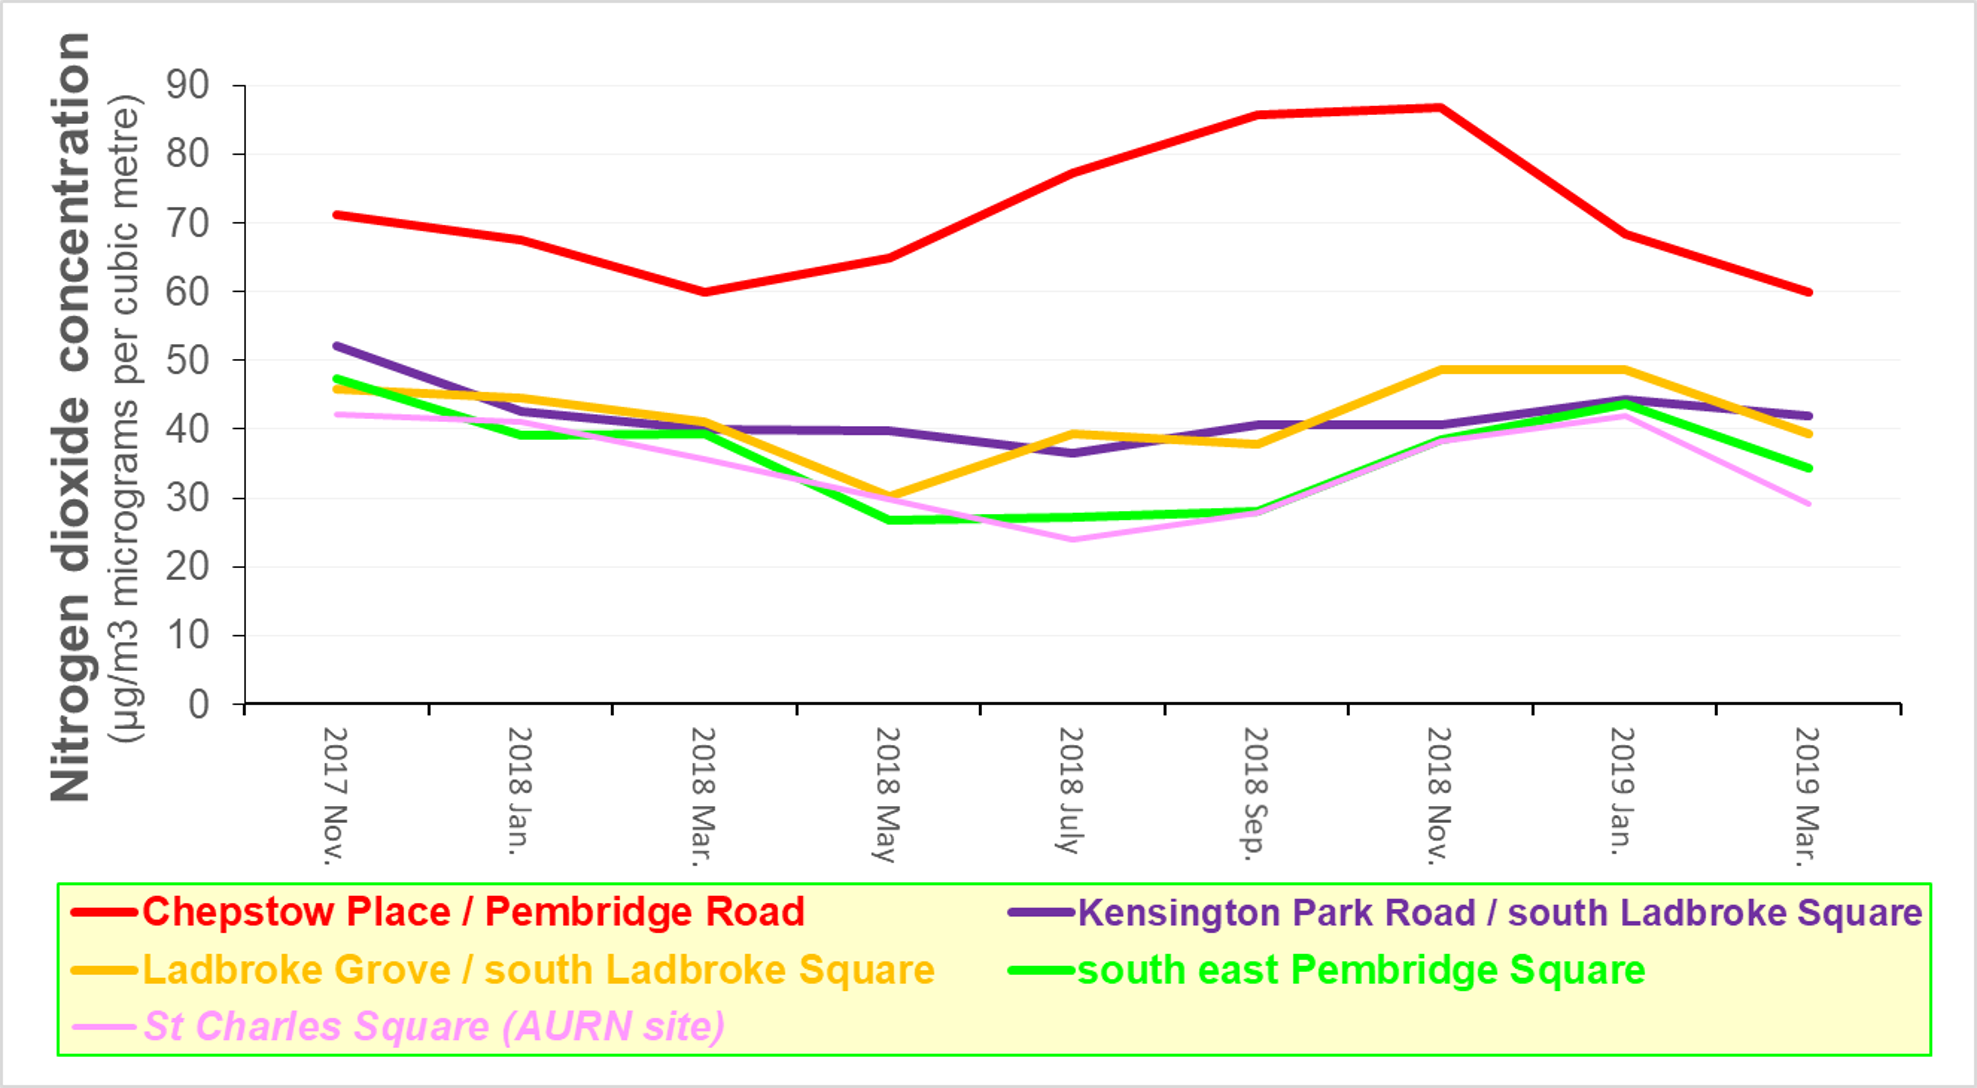
The following chart shows how
NO2
concentrations (measured by diffusion tubes) at four sites within
Pembridge ward every second month have changed since November
2017:
Of the four sites shown, much the most polluted is the road intersection between Pembridge Road, Chepstow Road, and Westbourne Grove. The other three sites are close to schools - young children are particularly vulnerable to poor air quality. The data indicate that the NO2 concentration at those three sites (when calculated over a 12 month period) is declining very slowly and is at, or a little less than, the legal limit (40 micrograms per cubic metre, as an annual average). NO2 concentrations in the UK vary with the season, and tend to be smaller during summer than during winter. This explains why the legal limit is an average for a year.
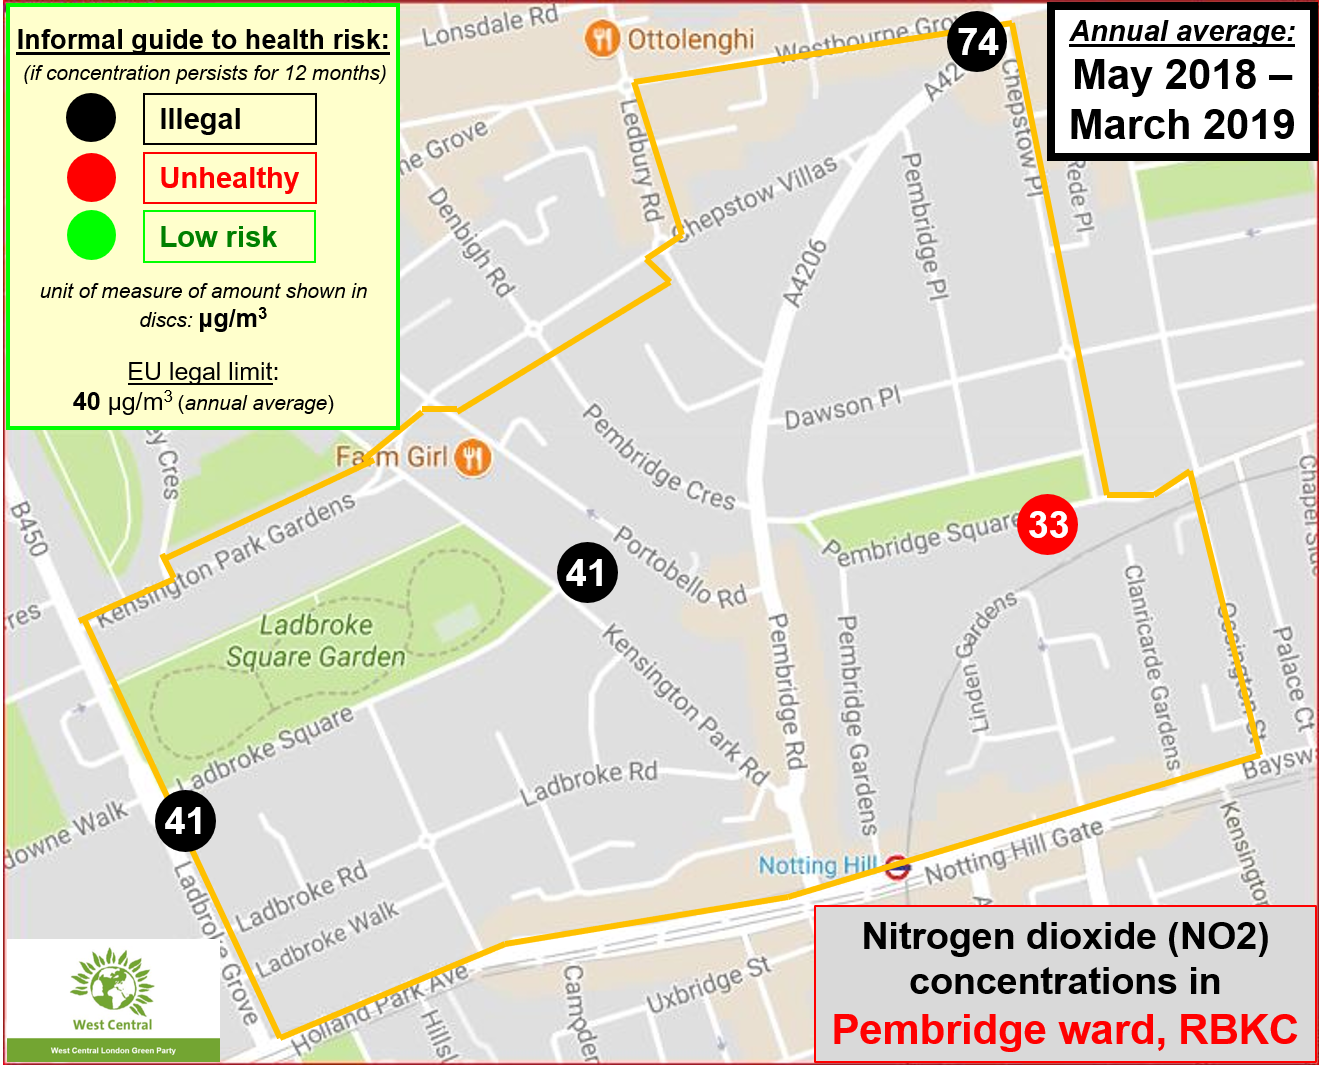
The following chart indicates the annual average concentration of NO2 for the most recent 12 months of data, and shows the where the diffusion tubes are located:
Comparison
between annual averages (click
here for full sequence)
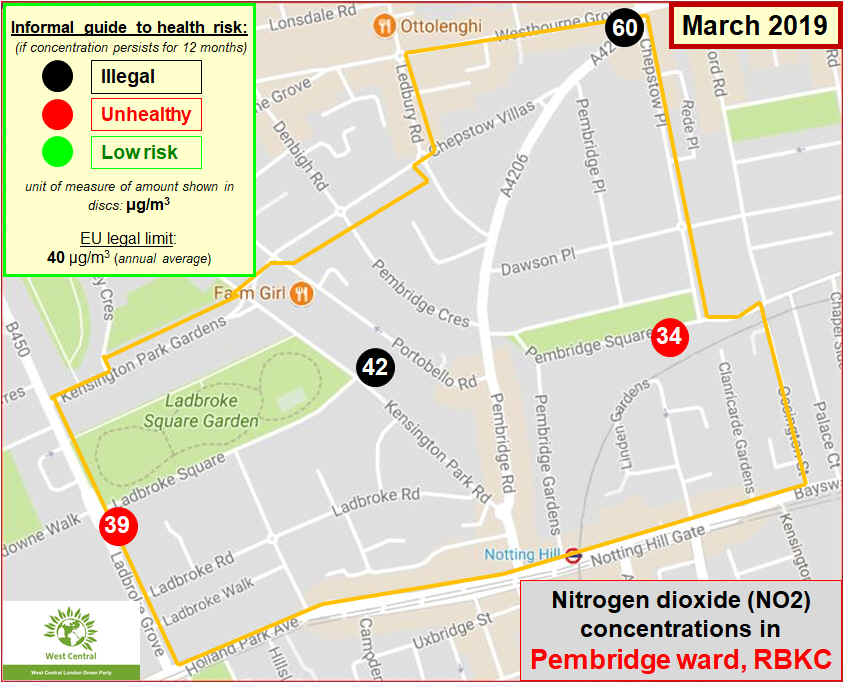
The following chart presents the concentration of NO2 for the most recent month of measurement.
Comparison
between monthly data (click
here for full sequence)
The following chart shows how the annual average concentration of NO2 at some locations in Pembridge and adjacent wards changed since 2003:
|
|
For further information, please contact: info@airqualitymatters.uk |
| Back |
| Click here for index on Home Page |